7
One of the most famous photographs in American history is of President Harry S. Truman holding up a copy of the Chicago Daily Tribune with headlines declaring that he had lost the presidency to his Republican rival, Thomas Dewey. Those in charge of the newspaper were so confident they knew the outcome of the election that they ran the headline declaring Dewey the winner the following morning without waiting for the official count. What gave the Tribune staff so much confidence were several opinion polls leading up to the 1948 presidential election, all showing Dewey with a commanding lead (Bailar, 1988, 1058). Similarly, in 2000, several television news stations reported that George W. Bush had won the presidential election. Al Gore subsequently called Bush to officially concede the election; however, when those same news stations reported Gore ahead as more polling results came in, Gore called Bush again to withdraw his concession (Marks & Carter, 2000). Eventually, George W. Bush would go on to become the president.
For many years following the erroneous Chicago Tribune headline, most people were understandably leery of polls designed to predict the outcome of elections. Today, with vastly improved sampling methodology, polls and other public opinion surveys are commonplace, and their results have become much more trustworthy as predictors of outcomes (Ward, 1995, 104). Social scientists, newspaper reporters, politicians, and advertisers have learned how to conduct surveys that can be accurate to within a few percentage points of the true figures. In this chapter, we explore the various types of sampling methods that are regularly used in the social and behavioral sciences.
THE NATURE OF SCIENTIFIC SURVEYS
In science, the term survey is applied to any research study that examines some empirical phenomenon without fundamentally disturbing it. The term ‘‘survey’’ is particularly appropriate if the aim of the study is to determine the prevalence of some phenomenon within a designated population and time frame.
Surveys are conducted in virtually all the sciences. For example, astronomers survey the heavens for the positions of planets, asteroids, and the existence of previously unknown galaxies. Zoologists survey forests to assess how many members of an endangered species remain or to estimate insect infestations.
Thousands of surveys related to human behavior and cultural practices are reported every year, not only by social scientists, but also by professionals in several allied fields such as education, journalism, advertising, and public administration. These surveys inquire into people’s opinions, interests, voting patterns, health and economic well being, and criminal victimization. Support for these surveys comes from government agencies, from nonprofit organizations, and from business enterprises of all types. Numerous other surveys are undertaken each year by academic researchers motivated by little more than personal curiosity about the fascinating diversity of human activities and attitudes.
BASIC TERMINOLOGY
In order to discuss surveying and sampling, it is important to be acquainted with several terms. One of the basic terms in surveying research is that of a population (sometimes called a universe).1 A population or universe refers to a naturally existing collection of some phenomenon (usually a collection of people living in a designated geographic area at a given point in time).
A sample is defined as a subset of some population. Normally, samples are very minuscule fractions of the populations from which they are drawn. For example, 3,000 U.S. citizens constitute a large sample of people, but they are far less than 1 percent of the entire U.S. population.
A representative sample is a fundamental concept in surveying. It refers to a sample whose members possess all characteristics in the same proportion as the population as a whole. For example, if the population being studied is the student body at a particular university and 12 percent of the student body at this university are females under the age of nineteen majoring in criminal justice, 12 percent of a representative sample from that student body will contain females under the age of nineteen majoring in criminal justice. Basically, a representative sample is a ‘‘miniaturized reflection’’ of the population being targeted for study.
Students should bear in mind that a representative sample refers to an ideal or a goal that a researcher strives to approximate in a survey. This chapter shows that there are different sampling methods used by researchers to approximate representative samples. Some of these methods have taken social scientists many years to develop and refine, while others are quite old.
A term that is related to but should not be confused with representative sample is random sample (although some researchers carelessly use these terms interchangeably). A random sample is a sample that has been drawn from a population in which every member of the population had an equal chance of being chosen. Whereas a representative sample is an ideal toward which most surveyors strive, a random sample is the result of certain procedures that allow a representative sample to be obtained.
Each individual composing a sample is referred to as a sampling unit. All random samples of sufficient size (sample sizes are discussed later) can be assumed to approximate a representative sample. However, as is shown later, there are ways of obtaining representative samples that do not rely entirely on random sampling methods. In order to obtain most random samples, a researcher needs to have access to what is called a sampling frame (Fowler, 1988, 19). A sampling frame refers to a complete list of all members of the population. One reason sampling procedures are not used more often is that obtaining complete lists of many populations of interest is often all but impossible.
Another basic term used in connection with surveys is census. This refers to a survey that includes (or at least comes close to including) 100 percent of the members of a population, either directly or indirectly (such as through another household member). The word census got its name from the fact that most census surveys are conducted once every ten years (at the beginning of each new decade) in virtually all literate countries (i.e., societies in which most adult citizens are able to read and write). A great deal of valuable information comes from these ‘‘nearly 100 percent surveys’’ of human populations. As is discussed later, census data can help determine the preciseness of a representative sample that has been obtained using tiny fractions of a population. Although it is proper to refer to a census as being a survey, it is normally not the custom to refer to the respondents in a census as a sample, in that a sample denotes a group of subjects composing much less than 100 percent of a population.
REPRESENTATIVE VERSUS NONREPRESENTATIVE SAMPLES
Samples are often chosen with the specific aim of being representative, although this goal is sometimes unrealistic or is not central to the objective of a study. The main advantage of a representative sample is that it allows a researcher to generalize from the sample to the population once a study is completed. A nonrepresentative sample is often less time-consuming and less expensive to obtain than a representative sample.
To illustrate the important distinction between a representative and a nonrepresentative sample, consider the following hypothetical example. Suppose a researcher wanted to study heroin addicts and the factors that are related to relapses in heroin use. This researcher would probably attempt to study every case that came to his or her attention (such as patients visiting a methadone maintenance clinic in a large city). Notice that this sort of sampling method is not likely to yield an entirely representative sample of heroin addicts, if for no other reason than it would not include those from smaller cities or rural areas. Nevertheless, because it would be much more difficult to obtain a representative sample, the choice for most researchers would be to either study addicts who visit one or two large city clinics or to not conduct the study at all. In other words, barring the existence of some comprehensive national registry of heroin addicts from which a random sample could be chosen, it would be virtually impossible for you or anyone else to obtain a representative sample of them.
Of course, in the previous hypothetical example, a researcher would be obliged to describe his or her sampling method so that readers are not misled into assuming that the findings are necessarily typical of a broader population of those addicted to heroin. Over the course of time, other researchers interested in studying this population could check the findings from the initial clinic population using other sampling locations and techniques. In this way, any gross inaccuracies in its findings would eventually become apparent.
This hypothetical example is intended to show that even though it is preferable to base all surveys on representative samples, there are legitimate reasons for not doing so. Another reason to conduct a survey even if it is not based on a representative sample has to do with the purpose of many studies. If the main reason for conducting a study is to determine how two or more variables are related to one another, the need for a representative sample is not nearly as crucial as when the main purpose is to describe the prevalence and distribution of variables within a particular population. More is said about this issue later in this chapter.
PROBABILITY VERSUS NON-PROBABILITY SAMPLING METHODS
Sampling methods that can be relied upon to approximate representative samples are called probability sampling methods, while sampling methods that cannot be trusted to be representative of some specified population are called non-probability sampling methods. Examples of these two sampling methods are described in the following text.
Main Probability Sampling Methods
Probability sampling can be accomplished in two ways. One way is through random sampling and the other is through various forms of cluster sampling. Random sampling methods can be divided into three forms: pure, systematic, and stratified. Cluster sampling can be described in two forms, although their distinction is not always perfectly apparent: simple and multistage. All of these are outlined in the following text.
Random Sampling Methods
Pure random sampling must conform precisely to the definition that was stated earlier (i.e., random sampling requires that every member of the universe be given an equal chance of being selected). Some statistical ‘‘purists’’ also note that this includes the possibility that each member of the universe could be selected more than once, thus requiring replacement (i.e., putting a sampling unit back into the selection pool after it has been chosen). However, surveys in the social sciences are based on random sampling methods that do not practice replacement.
For a long time, the two most common techniques for obtaining a pure random sample involved (1) literally throwing the names of every member of the population into a hat (or some other container) and drawing out names one at a time or (2) using what is called a ‘‘table of random numbers’’ (which is found in the back of most statistics texts). Today, computers can be programmed to generate random lists of names from sampling frames. Suppose a researcher wanted to get a random sample of students at some university, for instance. The registrar obviously holds the sampling frame and could generate multiple random lists of names within a very short time.
A special type of random sampling method used only in telephone surveys is called random digit dialing (e.g., King & Schafer, 1992; Strunin & Hingson, 1992; Wyatt & Notgrass, 1990;). Once the first three digits (the prefixes) used in an area to be sampled have been entered into a computer (which has been connected to a telephone via a modem), the computer can be programmed to dial the last four digits at random. This ensures that every household with a telephone—even those not listed in the phone directory—will have an equal chance of being called. By and large, only the homeless and institutionalized persons will be under-represented from random digit dialing sampling methods (DeKeseredy & MacLean, 1991, 148). This may change as more and more persons are using cell phones as their primary contact and therefore possibly not even having a conventional home telephone number.
Systematic (or interval) sampling is a type of random sampling that does not perfectly meet the conditions specified in the definition of pure random sampling. However, for all practical purposes, systematic sampling is considered equivalent to random sampling. Systematic sampling takes sampling units from a sampling frame at designated intervals (such as every tenth name in a directory) or at designated positions (such as the third name from the top of each page).
The reason systematic sampling methods cannot be considered random sampling in the strictest sense is that once the interval (or the position on the page) has been designated, most members of the universe no longer have a chance of being chosen. Nevertheless, no one seriously questions that systematic sampling methods are as representative as pure random sampling methods.
Stratified random sampling is a special type of random sampling that is undertaken to allow groups with low representation in a population to be more highly represented. Users of this sampling method take a sampling frame and divide its constituents up according to one or more characteristics, and then randomly sample subjects from the resulting separate lists.
Here’s an example of when to use stratified random sampling. Suppose a researcher was interested in comparing the attitudes of older-than-average students and students in their twenties on various issues at a particular college. Assume that the older-than-average students constitute only 10 percent of the students. This means that if a random sample of two hundred students was drawn, only about twenty older-than average students would be surveyed, a very small number from which to try to generalize. However, if the researcher were to separate the older-than-average and the regular-aged students, and then were to take one hundred subjects from each of the two sampling frames, two separate random samples of equal size would be obtained.
Cluster Sampling Methods
Cluster sampling methods contain elements of random sampling, but they are distinguishable from random sampling in significant ways. Whereas random sampling is based on a complete sampling frame, cluster sampling is not. The word cluster in this context refers to what might be called ‘‘naturally occurring groups’’ of subjects. Examples of clusters from which subjects might be drawn are members of a church congregation, students in a university, or members of particular neighborhoods within a city. In cluster sampling, sampling frames come in two or more ‘‘layers.’’ To get an idea of what this means, first consider the simplest form of cluster sampling.
In simple cluster sampling, a researcher chooses a few clusters, and then collects data from many of the subjects composing each of the clusters. For example, a researcher might be interested in studying the views of a particular religious group about whether homosexuals should be admitted as church members. If the researcher wanted to collect the data via personal interviews rather than by mailing out questionnaires, he or she would likely use simple cluster sampling. This could be done by choosing four or five specific church congregations (out of hundreds in the country), selecting ones that are geographically dispersed throughout the country. At each location, the researcher could obtain a list of current members and contact a random sample of these members for an interview. Note that even though the congregational members are randomly selected, the congregations to be sampled are not. Nevertheless, this sampling procedure normally approximates a representative sample.
Multistage cluster sampling has become a popular sampling method for nationwide surveys, especially when subjects are personally interviewed. The techniques involved in multistage cluster sampling were developed in the mid-1950s by private polling agencies such as Gallup International, Roper Surveys, and Harris Polls. A basic sketch of how multistage cluster sampling is commonly carried out is as follows:
1. Approximately two dozen major sampling clusters—such as counties or provinces—are chosen in a way that ensures geographical diversity and roughly mirrors the mix of demographic features of the population as a whole. In other words, if 6 percent of an entire population consists of persons over the age of seventy, then the counties or provinces that are picked will collectively contain about the same percent. Choosing these main sampling clusters is done most efficiently by computer, based on countywide (or provincewide) census figures.
2. City and rural maps are obtained for some or all of the cities and rural areas in each of these two or three dozen counties or provinces. Depending on the urban-rural mix of the county or province involved, twenty or so city blocks and rural square miles are selected for canvassing by the interviewers.
3. Starting at a random point on each block or square mile and proceeding clockwise, the interviewers conduct a designated number of interviews (usually four to six, depending on the final sample size desired). If an interviewer cannot obtain the designated number of interviews in the chosen block or square mile, he or she usually goes to an adjacent block or square to complete the interviews.
By following these steps, a researcher would obtain 2,000 to 2,800 subjects, depending on the number of interviews conducted in each block or square mile sampled. The sample obtained with this set of procedures will closely approximate a representative sample.
In many surveys using multistage cluster sampling, interviewers are given guidelines to use in choosing respondents. For example, to avoid oversampling females (which may happen if sampling is done during the day), interviewers might be required to conduct their interviews in the evening or to interview the same number of each sex.
There are two major advantages that either form of cluster sampling has over random sampling. First, cluster sampling allows a researcher to confine his or her interviewing to a few manageable geographical areas. Second, cluster sampling does not require a sampling frame for the entire population.
How to Assess a Sample’s Representativeness
Even if you used a probability sampling method, it is possible that your sample will not end up being representative of the population chosen for study. Fortunately, there is a simple way to determine how representative one’s final sample is, no matter what sampling method is used.
The simplest way to assess a sample’s representativeness is to compare its demographics with those of the population targeted for study. For example, if one’s sample includes 50 percent of each sex, but the targeted population contains 40 percent female and 60 percent male subjects according to the latest census, one would have to conclude that the sample under-represents males.
How to Adjust for a Sample’s Unrepresentativeness
Survey researchers sometimes impose representativeness on their samples after the data have been collected (Rust & Johnson, 1992). Although this may sound like ‘‘cooking the books,’’ it is not, as long as the researcher is forthright in noting that such adjustments were made. The technique is called weighting, and should only be used in surveys with large samples (i.e., over a thousand participants).
Weighting procedures can be illustrated as follows: Assume census figures show that 12 percent of the subjects in a population targeted for study are Hispanic males between the ages of thirty-five and fifty, but the sample you collected (by whatever means) contained only 10 percent. If the sample is large, computerized statistical procedures can be used to adjust all the results from the survey to show what the results would have been had the sample perfectly resembled the target population. Weighting procedures are technically very complicated and are only feasible using properly programmed computers.
Main Non-Probability Sampling Methods
If it is important that a research study be based on a representative sample, then a probability sampling method is strongly advised. For example, if a researcher is interested in knowing what proportion of a state’s voters are currently favoring a particular political candidate, a representative sample should be obtained (either in fact or via weighting). However if a researcher is interested in identifying campaign ads that significantly increase voters’ opinions of that candidate, the answer could probably be found without obtaining a representative sample. In the first instance, the representativeness of the sample is more central to the purpose of the research project than in the second case.
Another way to look at the representativeness issue is this: No research project will be criticized for being based on a representative sample, but many are considered weak if they are not. Nevertheless, most social science studies are not based on representative samples. Such studies still provide valuable information, especially when considered in the context of other studies of the same topic. If the question being asked pertains more to why people behave (or think) in a particular way than to identifying how many actually do so in a particular population, the representativeness of a sample is not nearly as important.
The following section describes the main types of sampling methods unlikely to yield representative samples. The result of these sampling methods are often called non-probability samples.
Grab Sampling
One of the crudest methods for obtaining a sample for a research study is to stand in one location such as a shopping mall or a convention booth and try to interview (or observe) whoever happens along. This is known as grab sampling (or sometimes incidental sampling or straw polling). Although this method is not worthless (especially for exploratory investigations), grab samples would never be used in a study where representativeness is a major goal.
Examples of grab sampling include a quick smattering of opinions obtained by news reporters for an evening news broadcast. Useful information is obtained with this sampling method, but researchers should be leery of any claim that the information can be generalized to an actual population.
Quota Sampling
Quota sampling methods are sometimes incorporated into probability sampling procedures to help ensure representativeness. However, as a sampling method by itself, quota sampling is little more than grab sampling with the added stipulation that a certain proportion of persons with certain characteristics (e.g., males versus females) are chosen. For instance, if a researcher is interested in the opinions of students at a university where two thirds of the student population is female, when the interviews are conducted, two females could be sampled for every male. There are more sophisticated forms of quota sampling methods, but they are difficult to apply in real situations (Babbie, 1973, 107).
Self-Selected Sampling
To some extent, all samples are self-selected because no one is ever forced to participate in a social science research project. However, in self-selected sampling methods, the subjects themselves actually take the initiative to be included in the study. Good examples of surveys based on self-selected samples are questionnaires inserted into magazines, marketing research studies examining people’s preference for a new product line, or programs that invite viewers to call a telephone number to register their opinions on some topic (e.g., Wysocki & Gilbert, 1989).
Although the results of surveys based on self-selected samples can be informative in studying relationships among variables, rarely can such surveys be considered representative of any naturally existing population, including the population of magazine subscribers or television viewers. The main problem with this sampling method is that such small proportions (i.e., usually less than 10 percent) of those invited to respond will actually do so. Incidentally, self-selected samples figured prominently in the surveys used to guess who was going to win the 1948 Truman-Dewey presidential election.
Snowball Sampling
In snowball sampling, research subjects are recruited and then asked to recruit additional subjects. The advantage of this sampling method is that it can build up sample sizes quickly and it can recruit subjects who are otherwise difficult to locate.
For example, if someone is interested in the behavior of the members of some secretive gang or religious cult, snowball sampling might be the only feasible way of obtaining a sizable sample. This sampling method was used in a study of homosexuality among American priests (Wolf, 1989) and in a study of criminal behavior among drug users in Scotland (Hammersley, Forsyth, & Lavelle, 1990). The likelihood is low that this sampling method will yield a representative sample.
Convenience Sampling
Convenience sampling involves obtaining a large group of subjects all at once, such as asking all the students in a criminology class to complete a questionnaire. Convenience sampling is probably the most widely used sampling method in the social sciences. Without intending any offense, a long-standing joke among social science researchers (especially psychologists) is that their two favorite groups of subjects are rats and sophomores. The fact is, however, that some social scientists have specifically criticized colleagues for relying too heavily on college students as research subjects.
It is now common for many introductory social science courses to require participation in at least one research study, especially at large, research-oriented universities. In this way, professors are able to conduct many useful studies while students have an opportunity to see how social science research is conducted. Nevertheless, the mix of students cannot be relied upon to be representative of an overall university’s student body, although students in a required introductory course might actually come close to representativeness in this regard.
Another example of convenience sampling comes from the field of ethnography (see chapter 10). Often an ethnographer generalizes about the cultural practices of an entire culture after studying the inhabitants of just one village. Most ethnographic work is based on the assumption that although convenience samples cannot be considered representative, they do provide the only real opportunity for social scientists to collect detailed information about cultures. Also, if one ethnographic report reflects sampling bias, additional reports from other villages linked to the same culture should eventually bring researchers close to unbiased generalizations.
Event Sampling
Obtaining a sample by taking every single instance of a rare event (or rare condition) is called event sampling. When event sampling is carried out in settings where people seek treatment, it is sometimes called clinical sampling.
For example, a study of child abuse was conducted a few years ago among children with cerebral palsy (Diamond & Jaudes, 1983). The sample was derived from all children diagnosed with cerebral palsy who entered a Chicago children’s hospital between September 1979 and August 1980. Such a sampling method is obviously not ideal for obtaining a representative sample, but given the rarity of the disease in a general population, it would be unrealistic to ever expect random or cluster samples of children with cerebral palsy to be obtained for study.
One particularly unusual example of event sampling comes from a study of more than 1.36 million emergency (911) calls made to the Kansas City, Kansas, police department between 1986 and 1989 (Walters, 1991). The initial assumption might be that this is a self-selected sample, but such a categorization would imply that the phone call was being made for research purposes (which is not the case). Rather, sampling consecutive calls made to an emergency number are best considered a type of event sampling.
Final Comments on Non-Probability Samples
Overall, the difference between a probability sample and a non-probability sample is that the former has a greater chance of being representative of an identifiable population than the latter. A researcher therefore is able to generalize the findings from the sample studied to the larger population with a representative sample. Thus, if a researcher has a choice between conducting a study based on either a probability sample or a non-probability sample of equal size, and there are no differences in time and expense, the probability sample should be used. However, many circumstances make probability sampling almost impossible to obtain.
Over the years, social scientists have been at odds about employing non-probability sampling methods. Some have argued that researchers should never attempt to generalize to any ‘‘real’’ population based on a non-probability sample (Berk, 1983; Grichting, 1989; Morrison & Henkel, 1969). Nonetheless, nearly all researchers agree that while probability samples are certainly preferable, when there is a choice between using a non-probability sampling method and not conducting a study at all, it is best to use the non-probability sampling method (Eysenck, 1975; Winch & Campbell, 1969).
SAMPLE SIZE
As noted in chapters 3 and 4, the larger the size of one’s sample, the more likely it is that the results will accurately reflect the universe from which the sample was drawn (assuming that the same sampling methods were used). Nevertheless, there are trade-offs when sample sizes are increased. In particular, larger sample sizes nearly always require additional time and expense in data collection, coding, and data entry.
Just for fun, guess the size of the largest probability sample survey ever conducted (with the exception of government-sponsored surveys that often consist of several million subjects). The answer is 113,000. The study was a nationwide survey dealing with religious beliefs and practices in the United States (Moss, 1991). Even though a sample size of 113,000 represents less than 0.05% of all U.S. citizens, it is large enough to allow researchers to generalize about people’s religious views and practices, even at the level of all fifty states, with only small margins of error.
The largest non-probability sample survey appears to be a survey conducted by the National Geographic. Inside all 10.5 million copies of its September 1986 issue was a questionnaire about people’s sense of smell (complete with scratch-and sniff samples of various odors). The number of readers who completed and returned this questionnaire was 1.42 million (Wysocki & Gilbert, 1989, 13). A close second in non-probability sample size was the study of the 1.36 million calls made to the 911 emergency number in Kansas City, Kansas, discussed earlier in this chapter (Walters, 1991).
Law of Diminishing Returns
In attempting to balance the increased accuracy of a survey against the additional time and expense accompanying larger sample sizes, keep in mind the law of diminishing returns. As mentioned in chapter 3, this mathematical law means that the larger the sample size, the less results are made more accurate by further increasing the number of subjects. Adding twenty subjects to a sample size of one hundred, for example, would increase the accuracy of a survey much more than adding twenty more subjects to a sample size of ten thousand.
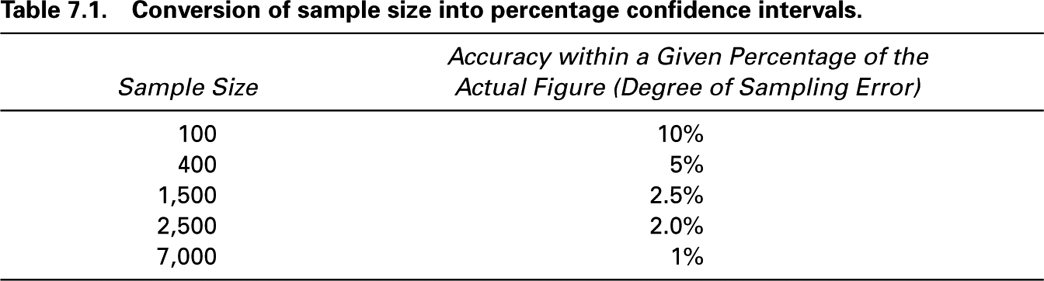
Over the years, statisticians have tried to develop precise guidelines for the size of samples needed for a given level of accuracy. Although there is value in such estimates for planning surveys, no sampling formulas or guidelines should ever replace the following commonsense rule: Attempt to obtain as large a sample as possible within a researcher’s time and expense constraints. As a rough rule of thumb, however, table 7.1 presents figures indicating examples of the sample sizes needed to achieve accuracy within various sampling error limits.
These figures indicate that if a researcher were to obtain responses from a probability sample of one hundred individuals, any percentages derived from their answers would be accurate to within ten percentage points of the real figure. In other words, if 32 percent of a sample responded affirmatively to a particular question, the real percentage (i.e., the percentage for the entire population) would be somewhere between 22 and 42 percent.2 The sample size needed for results that are within two percentage points of the actual percentage would be around 2,500.
Keep in mind that the figures in this table are approximations and that they only pertain to how accuracy is affected by sample size. Any inaccuracies due to invalid, unreliable, and imprecise questions (see chapter 6); inappropriate questions and response options (see chapter 9); or poor sampling procedures (as discussed earlier in this chapter) are in addition to inaccuracies due to sampling error.
Statistical Power
The concept of statistical power refers to the probability that a study will yield statistically significant results when a research hypothesis is true. Obviously, this probability increases with increasing sample size. However, other factors also affect statistical power. For example, say that a researcher wanted to compare males and females for two traits. While there is no way of ever knowing for certain, assume that for all of the people who have ever lived and died on earth, the actual difference between males and females for trait A is one fourth of a standard deviation, and for trait B it is one entire standard deviation. Stated in terms of effect size (as discussed in chapter 11), the effect size is four times greater for trait B than for trait A.
Obviously, with a sample of a few hundred males and females, a researcher will have a much greater probability of finding a statistically significant difference in the case of trait B than in the case of trait A. This means that statistical power is not only affected by the size of one’s sample but also by the extent of the ‘‘real’’ differences that are being assessed with one’s sample. For more detailed information about statistical power, effect size, and statistical significance, you will want to obtain training in statistics and probability theory.
SURVEYING OVER TIME
Sometimes researchers have a onetime interest in how a variable is distributed in a particular population. For these researchers, it is sufficient to conduct what is called a cross-sectional survey, meaning a survey undertaken at only one point in time. Other times, researchers may want to follow changes in a variable over two or more points in time. This requires what is termed a longitudinal survey. In the case of longitudinal surveys, it is useful to distinguish three different types according to how samples are drawn. These types are called panel, non-panel, and partial panel. Longitudinal surveys are more time consuming and costly for obvious reasons.
Panel longitudinal surveys are ones in which the same sample is used each time the survey is conducted. These surveys allow a researcher to follow specific individuals over time to assess how they may be changing. Panel surveys by economists, for example, have found that people’s annual earnings often vary substantially from one year to the next (Lillard & Willis, 1978; Schiller, 1977).
Non-panel longitudinal surveys involve selecting an entirely new sample (within the same population, of course) each time the survey is run. The advantage of this form of longitudinal survey is that a researcher is able to estimate how the population is changing without having to locate the same subjects time after time.
Partial panel longitudinal surveys represent a compromise between the panel and non-panel surveys. One example of a partial panel survey is the National Crime Survey conducted each year among a representative sample of U.S. citizens to determine if they have been recent crime victims, regardless of any calls they may have made to police (Blumstein Cohen, & Rosenfeld, 1991). Researchers make efforts to keep respondents in a survey for three consecutive years (although some will be lost due to change of residence or death). In most cases, one-third of the respondents are new each year, one-third were part of the panel the previous year, and one-third were in the panel for the two preceding years.
SUMMARY
In this chapter, surveys and sampling procedures were described. The two main categories of samples were identified as probability and non-probability. Probability samples are more likely than non-probability samples to be representative (i.e., a mirror image) of an existing population chosen for study.
There are two ways of obtaining representative samples. One way is by using a probability sampling method (one that is likely to yield a representative sample). Probability sampling methods include random sampling and cluster sampling. All but one form of random sampling require selecting sampling units (subjects) from a list of all members of the population targeted for study. These lists are referred to as sampling frames. The exception, called random digit dialing, is used in some telephone surveys. In cluster sampling, the sampling frames are in two or more ‘‘layers.’’ The first layer may consist of clusters of subjects (e.g., all universities in some country). Within the first sampling layer, a researcher then chooses the actual subjects to be studied.
The other way to obtain a representative sample involves weighting. After the data have been collected, weighting procedures can be used to inflate the responses from the proportions of a sample that were under-represented. In other words, if a population has exactly an equal number of males and females, but a sample contains only 40 percent males, responses from that 40 percent of the sample can be inflated until their responses have a weight equal to that of the female portion of the sample. Weighting is reserved for surveys with large numbers of subjects in which researchers have access to sophisticated computer programs.
Six non-probability sampling methods were identified. These include what are termed grab samples, quota samples, self-selected samples, snowball samples, convenience samples, and event samples. None of these sampling methods should be trusted to yield representative samples, but this does not preclude their use in scientific research, especially when probability sampling is not feasible.
Guidelines were given for deciding on the size of a sample. In general, the larger the sample the better, but remember the law of diminishing returns means that the larger the sample happens to be, the less sampling error is reduced with the addition of each new subject. Ultimately, researchers must always balance the accuracy needed in a survey against the additional time and expense of adding new subjects. More will be said about sampling issues and attempts to generalize about populations on the basis of samples in chapter 8.
A distinction was made between cross-sectional surveys and longitudinal surveys. Longitudinal surveys are subdivided into panel, non-panel, and partial panel according to whether the same subjects are being used each time the survey is conducted.
SUGGESTED READINGS
Converse, J. M. (1987). Survey research in the United States: Roots and emergence, 1890–1960. Berkeley: University of California Press. (A well-written book on the history of survey research. Highly recommended.)
Groves, R .M., Biemer, P. M., Lyberg, L. E., Massey, J. T., Nicholls, W. L., & Waksberg, J. (1988). Telephone survey methods. New York: Wiley. (A useful book for those interested in undertaking a research project in which subjects will be interviewed via the telephone.)
Kraemer, H. C., & Thiemann, S. (1987). How many subjects? Statistical power analysis in research. Beverly Hills, CA: Sage. (Provides a basic introduction to questions concerning sample size and how to provide reliable findings within the constraints imposed by time and expense.)
Lavakas, P. J. (1987). Telephone survey methods: Sampling, selection, and supervision. Beverly Hills, CA: Sage. (Helpful information for those interested in conducting surveys via the telephone.)
Walden, G. R. S. (1990). Public opinion polls and surveys. Beverly Hills, CA: Sage. (Provides an extensive annotated bibliography of studies of public opinion in the United States throughout the 1980s.)
Journals that specialize in survey research and sampling issues are
Gallup Reports
Journal of the Marketing Research Society
Public Opinion Quarterly