
9
Guidelines for Constructing Questionnaires
If you had an interest in the relationship between social status and involvement in delinquent behavior, what sort of questions might you ask on a questionnaire to obtain the necessary data? Or suppose you wanted to know if mental illness was associated with a variety of personality traits. How could you phrase questions that would provide meaningful information? These are the sort of issues addressed in the present chapter.
A research instrument refers to any physical thing that is used to collect scientific data. In general, questionnaires are research instruments in which persons from whom researchers are seeking information can provide that information, usually in written form. In other words, a questionnaire is a research instrument through which human beings provide information about their lives and behavior, and sometimes about the lives and behavior of others they know, such as family members.
Questionnaires can be completed either by directly responding to questions on a paper-and-pencil form, or via questions presented to participants during a telephone conversation or a face-to-face interview. As is discussed later in this text, a growing trend has involved constructing questionnaires using special computer programs that sometimes allow subjects to complete their questionnaire on line or via e-mail.
No one knows the precise figure, but it is safe to say that well over half of all social science data are collected by fellow human beings graciously willing to complete questionnaires. To warrant their continued cooperation, we social scientists need to take the construction and administration of questionnaires very seriously.
BASIC TERMINOLOGY
Before describing how to design a research questionnaire, it is useful to be acquainted with some basic terminology. First, a distinction can be made between a research subject and a respondent. The term respondent refers to a person who gives responses to questions on a questionnaire or in an interview. In other words, persons who are subjects (or participants) in a study are often called respondents if their involvement in a study simply involves completing a questionnaire.
Sometimes respondents are asked to respond to questions not about themselves, but about others who are known to the respondents. For instance, children may be asked about their parents, parents may be asked about their children, or teachers may be asked about their students.
A question (also called an item or a questionnaire item) refers to anything that calls for a linguistic or numeric response (in either written or oral form) from a respondent. Questions in a research questionnaire do not need to literally be phrased in the form of a question. For example, respondents might be asked to respond to the following statements:
I consider it important that whomever I marry share my religious beliefs.
As a child, I was hyperactive.
I always look forward to meeting new people.
These statements constitute questions (or items) in a questionnaire. Sometimes questions in a questionnaire consist of mere phrases. For example, subjects might be instructed to indicate how they perceive themselves with respect to the following adjectives:
Outgoing personality
Superstitious
Impulsive
Each of these phrases would be considered a question or item as long as subjects were permitted to make some sort of response to each one. More is said later in this chapter about how questions should be phrased, but let us now turn to the advantages and disadvantages of questionnaires and the types of response options that can be offered to subjects.
ADVANTAGES AND DISADVANTAGES OF DATA BASED ON SELF-REPORTS
Before exploring options surrounding the types of self-reported information that can be collected, let us consider a more basic issue: the main advantages and disadvantages to the use of self-reported data. The most obvious alternative to self-reports involves researchers (or their trained assistants) compiling the data themselves.
Advantages
An obvious advantage to most self-reported data is that the data can often be collected quickly. For instance, a professor could construct a questionnaire on Monday, have one hundred copies photocopied for administration to his or her criminal justice class by Wednesday, enter the results into a computer the following week, and know the main results a week later. Depending on the type of information being collected, this same professor might have to spend years doing direct observation of the same phenomenon for a comparable number of subjects.
Another advantage of self-reports is that there are many things that people know about themselves that no amount of observation by others will ever reveal. For instance, many persons have committed petty crimes or minor offenses in the past that never came to the attention of authorities; these are referred to as the ‘‘dark figures’’ of crime, and, unless we ask persons to self-report this type of behavior, we will never know about it. Similarly, there are many aspects of our private and intimate behavior that are impractical or illegal for researchers to attempt to directly observe (Baldwin, 2000).
Disadvantages
The main disadvantages of self-reported data have to do with reliability. Because most people who provide self-reported information have little if any social science background, they are not likely to appreciate why the questions are being asked and thus sometimes provide very inappropriate answers. Others may read some of the questions carelessly and then provide responses that are the opposite of what they intended to report.
Much has been discussed about how to improve the accuracy of self-reported data. However, the focus of this chapter is mainly on the mechanics of designing questions and response options to those questions. We first consider response options.
RESPONSE OPTIONS FOR QUESTIONS
Response options refer to the range of answers that researchers offer subjects in connection with the questions that are asked. These options are important to a researcher because they have a major influence on the type of data that will eventually be available for analysis. Response options fall into five general categories: open-ended, fill-in-the-blank, end-anchored, all-points-anchored, and ranking. There are several forms of each of these general types.
Open-Ended Response Options
Items that present a question (or make a statement) without providing any constraints on how subjects can respond are called open-ended. Examples of items providing open-ended response options include:
What preventive measures do you take to avoid being a victim of crime?
In what ways are your friends most important to you?
How do you feel future world conflicts can best be avoided?
Controversy has long surrounded the advisability of using open-ended questions (see Lazarfeld, 1944), with most researchers avoiding them whenever possible. The main drawback to open-ended response options is that they are time-consuming to code (Geer, 1991). Coding refers to the process of deciding how data will be entered into a standard format for analysis. Not only is a considerable amount of time involved in reading and then deciding how best to code each response, but responses to many open-ended questions can be ambiguous and impossible to decipher.
The main value of open-ended questions is in exploring areas of research that have received little prior attention (Geer, 1991). For example, following growing concern over sexual harassment in the workplace and on college campuses, subjects in the United States were asked to use an open-ended format to report any incidences of sexual harassment that they or someone they knew had experienced (Till, 1980). This helped researchers to more precisely delineate exactly what most people believed constituted sexual harassment. However, open-ended questions cannot provide precise estimates of how prevalent sexual harassment is in a population.
Fill-in-the-Blank Response Options
Questions that ask subjects to respond by writing in or uttering a limited number of words (usually one or two) are called fill-in-the-blank items. Examples of fill-in-the-blank questions are:
Religious preference (if Protestant, specify denomination) _________
How many times in the past year have you been the victim of a property crime? _________
Size of the town or city in which (or nearest which) you grew up _________
Items with fill-in-the-blank response options are often used for variables misread at the nominal level. Often, they are coded into categories (e.g., a dozen or so religious groups or crime categories such as property crime, drug crime, or violent crime) by the researcher.
An example of a fill-in-the-blank question comes from attempts to measure race and ethnicity. Prior to 1990, the U.S. Census Bureau had six categories to which each person was assigned (white non-Hispanic, Hispanic, black, Native American, Asian/Pacific Islander). Since then, census takers write down essentially whatever respondents answer with respect to identifying their race and ethnicity (Rosenwaike, 1993). In the 2000 census, respondents could even identify mixed ancestry. These changes have the advantage of better reflecting reality, but they mean that many racial and ethnic categories are too few in number for meaningful analysis.
End-Anchored Continuum Response Options
The distinguishing feature of an end-anchored continuum is that subjects are allowed to respond along a continuum in which only the two extreme values have specific meaning. There are three forms of this response option: the demarcated linear form and two numeric forms.
To give an example of the demarcated linear form, suppose a researcher is interested in attitudes toward capital punishment. In this case, the researcher might ask the following question:
To what degree do you believe that it is appropriate for the state to execute persons convicted of murder?
| Extremely Inappropriate | Extremely Appropriate |
The best known example of the demarcated linear form of the end-anchored continuum is called the semantic differential scale. Developed in the 1950s (Os-good et al., 1957), these scales arrange numerous polar-opposite adjectives at each end of a linear continuum (usually demarcated into seven response options), and ask subjects to respond to a single noun or phrase (e.g., murderers, the elderly, political liberals) by putting an X in the appropriate space. Examples of the adjectives might include Competent-Incompetent, Strong-Weak, Selfish-Generous, Good-Bad (Monette et al., 1990, 379; Neuman, 1991, 163). Here is an example of a semantic differential scale:
| American foreign policy | |
| Even Handed | Heavy Handed |
In the numeric form of the end-anchored continuum, the questions may be asked in the same way, but in place of the linear continuum, subjects are instructed to answer by writing in or circling a number. For the write-in end-anchored response option, the question might be stated as follows:
To what degree do you approve of the state executing persons convicted of murder? (Answer anywhere from 1 to 10, with 1 representing strong approval, and 10 representing strong disapproval)
An actual example comes from a study designed to more precisely measure homosexuality than by simply asking subjects whether they are homosexual, heterosexual, or bisexual (Ellis et al., 1987). The question allowed subjects to answer from 0 to 100, and was phrased as follows:
When imagining sexual relationships, the individual with whom you imagine interacting is:
a member of the opposite sex_________% of the time
a member of the same sex_________% of the time
The circled end-anchored response option of the question on the death penalty would normally appear as follows:
To what degree do you approve of governments executing persons convicted of murder?
| Strongly Disapprove | Strongly Approve |
1 2 3 4 5 6 7 8 9 10
A variation on the circled end-anchored response option involved a series of six questions designed by an anthropologist to measure variations in women’s feeling about sex and marriage (Cashdan, 1993). In each question, the researcher pitted two opposing viewpoints against one another, one advocated by a fictional character named Pat and the other by a fictional character named Sue. Subjects were then asked to report the degree to which they agreed with Pat or Sue. One of these six questions is represented here:
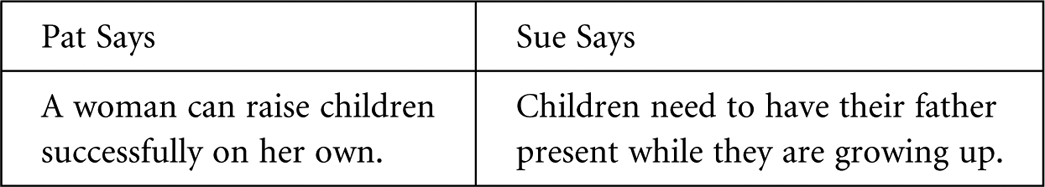
Do you agree more with Pat or with Sue? Circle the number that comes closest to your own opinion.
| (Agree with Pat) | 1 2 3 4 5 6 7 | (Agree with Sue) |
| (Agree with both equally) |
Notice that in this particular case, the median response of 4 is specifically designated as a neutral response. Nevertheless, such a structuring of response options is still classified as an end-anchored continuum. The main advantage of the numeric forms of the end-anchored continua compared with the demarcated line form is that numeric forms facilitate transcription for data entry.
All-Points-Anchored Response Options
The fourth type of response option involves anchoring all the response options with words (usually adjectives or adverbs). Although there are no hard-and-fast rules for the number of words used, the most common scales have five points and follow this form:
SA—Strongly Agree (or Strongly Approve)
A—Agree (or Approve)
N—Neutral
D—Disagree (or Disapprove)
SD—Strongly Disagree (or Strongly Disapprove)
This and similarly worded five-point response options are called the Likert scale, after one of the first social scientists to use it (Likert, 1932). The term Likert-type is sometimes used to refer to other types of all-points-anchored scales (e.g., Stuart & Jacobson, 1979, 245). Likert-type scales have three, four, six, or seven response options instead of five (Haque & Telfair, 2000, 47; Stoney et al., 1998, 647; Wyatt, 1989).
Some researchers have blended the features of a circle end-anchored and all-points anchored response option (Geary et al., 1995, 372; Goldberg, 1992, 42). The resulting scale is illustrated here.
To what degree are you introverted or extroverted?
| Very introverted | Moderately | Neither | Moderately | Very extroverted |
| 1 2 | 3 4 | 5 | 6 7 | 8 9 |
Ranking Response Options
A final type of response option to be discussed is one in which respondents are given a list of items to rank in some way. This has been most often used in the study of human values, such as the relative priority people put on honesty, freedom, civic responsibility, and the like (Rokeach, 1973; Rokeach & Ball-Rokeach, 1989; Schwartz & Kemnitz, 1992). Ranking the importance of such items is an alternative to rating each item (e.g., on a scale of 1 to 10).
There are two main differences between ranking and rating scales: First, ranking scales force subjects to arrange every item into a hierarchy, while scales in which each item is individually rated allow subjects who so choose to give the same rating to several (or even all) items. Second, ranking items is technically an ordinal measurement, while rating each item separately provides an interval measure for each item. Calculating means and Pearson correlations is not considered appropriate for measurement below the interval level. Therefore, from a statistical standpoint, rating scales are better.
A Canadian study undertaken to determine whether ranking or rating scales were the most valid for measuring values concluded that the differences are fairly minor, but that generally rating scales are better (Maio et al., 1996). The main problems the researchers found with the ranking scales involved the fact that many people actually place equal priority on two or more values, and that ranking scales forced people to make distinctions that they would not otherwise make. Thus, unless there are compelling reasons to do otherwise, there are few reasons to use ranking scales instead of rating scales for the same variables.
DECIDING WHICH RESPONSE OPTION TO USE
A researcher should consider several things in choosing which response option to offer subjects for each question asked. The following four points are particularly important:
1. Try to minimize the amount of coding. Generally, the fewer items that must be read, interpreted, and coded by a researcher (or coding assistant), the better. Of the four main types of response options just outlined, the latter two require no coding and are therefore generally preferred over the first two types.
2. Try to measure variables at least at the interval level. Whereas end-anchored continuum scales almost always meet the assumption of interval measurement, all-points-anchored scales are less certain in this regard. A researcher cannot be as sure that the adjectives used to anchor each point in a scale will be interpreted by subjects in equal-interval fashion as you can be when consecutive numbers are used. In other words, how confident can we be that everyone considers the distance between strongly agree (SA) and agree (A) is the same as the distance between agree (A) and undecided/neutra1 (U/N)? If we are not very confident, then it is inappropriate to consider such an all-points-anchored scale as providing interval-level data.
3. Avoid repeatedly switching from one type of response option to another. Respondents are more likely to provide inaccurate responses if they are frequently confronted with different types of response options. Therefore, a researcher should keep subjects focused on the content of the questions rather than continually changing the number and types of response options, and should organize the questions so that all, or at least most, of those with similar response options appear together.
4. Give subjects considerable latitude in their responses. Probably the most frequent error made in constructing items for research questionnaires is that of allowing insufficient response options for subjects. This error can be remedied by changing a question requiring a yes/no response to one that allows subjects to indicate to what degree they have a particular characteristic or attitude on a scale from 1 to 10. Consider the following research to help illustrate this point:
Findings regarding the percentage of North Americans who believe in extra-sensory perception (ESP) has been found to vary considerably, all the way from 50 percent to over 80 percent (Gray, 1990; Messer & Griggs, 1989, 189). The differences in these findings appear to be due mainly to the type of response options given to subjects. If subjects are given just two choices (either they believe in ESP or not), studies find considerably lower percentages (in the 50-percent range) than if they are allowed to respond on a nine-point scale ranging from + 4 (meaning extremely convinced that ESP actually occurs) to – 4 (meaning extremely doubtful that ESP actually occurs).
Notice that the second of these two options allows respondents who are only slightly open to the possibility that ESP really occurs to answer a + 1 or possibly + 2. However, in responding to the either/or response option, many of these slightly open respondents might say that they do not believe in ESP.
Subtle differences in how questions are phrased can also affect people’s responses. For example, a 1980 CBS–New York Times poll asked two different questions on abortion at different times in the interview (Reiss, 1981, 272). The questions were:
Do you think there should be an amendment to the Constitution prohibiting abortion, or shouldn’t there be such an amendment?
Do you believe there should be an amendment to the Constitution protecting the life of the unborn child, or shouldn’t there be such an amendment?
To the first question, 29 percent agreed and 62 percent disagreed (with 9 percent uncertain). To the second question, 50 percent agreed and 39 percent disagreed (with 11 percent uncertain). It is obvious that substantial percentages of respondents will express contradictory opinions simply because of the way the questions are phrased. There is even evidence that the order in which certain questions on controversial issues such as abortion are asked will affect many people’s responses (Miller et al., 2000, 133; Tenvergert et al., 1992). Similarly, the percentage of persons who support the death penalty in the United States also varies, depending upon how the question is asked. If you simply ask people if they support the death penalty, well over 70 percent of respondents in the United States do express support for it. If you reword the question and ask respondents whether they support the death penalty if there is an option of life without parole, the percentage of respondents who express support for the death penalty decreases.
Why would the types of responses offered to respondents make such a dramatic difference? Part of the answer may lie in the fact that most people think of themselves (correctly) as roughly average in most of their behavior and may assume that when people construct questionnaires, the response options provided reflect the typical range of responses people give (Rockwood et al., 1997, 119). Whatever the cause may be, how can such effects be avoided? Probably the easiest solution in cases such as these is to simply allow respondents a space in which to write their answers to survey questions.
As an overall take-home message, researchers should keep in mind the tremendous variability that exists in human behavior and attitudes. Given this variability, researchers should construct their questions in ways that allow as much as possible of this variability to be revealed. Of course, providing a limited number of response options is appropriate for many discrete variables, such as a respondent’s sex or political party affiliation. Also, there are times in the analysis of data when a researcher is justified in collapsing some of the response options. For example, if there are only thirty subjects in a study, and they respond to a question on a twenty-point scale, it may be best to collapse down the responses to just five or four. However, rarely should one restrict the response options for questions about continuous variables to a point that the real diversity in the behavior is being obscured.
Although not all social scientists agree on this point, our advice is that researchers use end-anchored continuum scales as much as possible when measuring continuous variables. Researchers used to recommend that in telephone and personal interview surveys, no more than four all-points-anchored categories be given to subjects because of the difficulty people have remembering the name of each response category as the questions were being presented. However, with end-anchored continua, subjects only need to remember the names of the two ends of the continuum and how many segments there are between the two ends. Thus, even with surveys based upon telephone and personal interviews, end-anchored continua have been increasingly recommended (Loken et al., 1987).
TYPES OF SELF-REPORTED ITEMS
Four different types of self-report items are utilized in questionnaires. These are descriptive items, recall items, attitudinal items, and projective items, each of which is discussed in the following text.
1. Descriptive Items. Descriptive items are those pertaining to factual information, including demographic information such as age and marital status. Other items of a descriptive nature are questions about personality or grades in school.
It is astonishing how many things of a descriptive nature that we can report about ourselves in a moment’s notice. But just how accurate is this information? Over the years, several studies have sought to find out, usually by asking subjects to respond to the same questions again a few weeks later (a form of test-retest reliability). Numerous research studies have shown that the responses to most basic descriptive items are extremely reliable.
2. Recall Items. Items requiring subjects to reach back into their memories to recall some specific event, or type of event, are called recall (or retrospective) items. Obviously, many recall items can also be considered descriptive items, but the main distinction is that recall items are usually not of the type that people routinely use in describing themselves or their background.
Recall items in which respondents are asked about a type of specific experience people may or may not have had are called episodic recall items (Kessler et al. 2000; Shiffman 2000). Here are a few examples of episodic recall items:
Have you ever had a near-death experience?
How old were you when you had your first crush on a member of the opposite sex?
Have you ever felt so depressed that you sought professional help?
As a child, were you ever sexually abused or molested by an adult?
Considerable research has attempted to assess the reliability of people’s responses to episodic recall items. These studies suggest that the mere occurrence of most events are more accurately reported than circumstances surrounding the events (Ayers & Reder, 1998). The further back in time one is asked to go in recalling events, the more distortion there tends to be in the details about the event.
3. Attitudinal Items. Attitudinal items ask people to express their opinions about topics. These types of questions can give researchers insight into people’s views on a wide range of issues. However, as noted later in this chapter, the way attitudinal items are phrased can often have major effects on the proportions of people agreeing or disagreeing with a particular point of view. Examples of attitudinal items, expressed both as statements and as questions, are as follows:
Should embryonic stem cell research be legal?
To what degree do you feel homosexual behavior is sinful?
Indicate your agreement or disagreement with the following statements: Gambling should be legalized.
Even in adulthood, abused children should be able to sue their parents in a court of law.
4. Projective Items. A projective (or hypothetical) item is one in which subjects are asked to report what they would do under specified conditions, particularly ones that have not yet happened. A couple of examples include:
How would you react if a child of yours was seriously injured in an automobile wreck caused by a drunk driver?
Would you insist that your children adopt your own religious faith, or encourage them to explore options and make up their own minds?
Sometimes projective items require making a series of stipulations rather than just one. These projective items are usually called scenarios (or vignettes). Scenario items can be useful for comparing subjects on events that rarely occur, but that can provide insight into personality. By far, the most common type of behavior focused on with scenario questions have to do with various forms of aggression.
An example is one in which one of the authors of this text was involved in for the purpose of comparing both homosexual and heterosexual males and females regarding their tendencies toward aggression (Ellis et al., 1990). One of the scenario items we presented to subjects was as follows:
You loaned $100 more than a year ago to someone who is now avoiding you. You locate the person, and remind him or her that the money has not yet been repaid. The person laughs and says he or she did return it several months ago, and tells you that you are lying about not remembering. What would you most likely do?
In responding to this question, subjects were allowed five options, ranging from ‘‘Say nothing and/or walk away’’ to ‘‘Physically attack the person.’’
Another example of a scenario item is one given to police officers to assess how they would react to the same law-violating behavior committed by a black or white suspect (Sutphen et al., 1993). In this study, police officers were provided information simulating actual incidences and then they were asked to fill out an incident report, including the charges being made against the suspect.
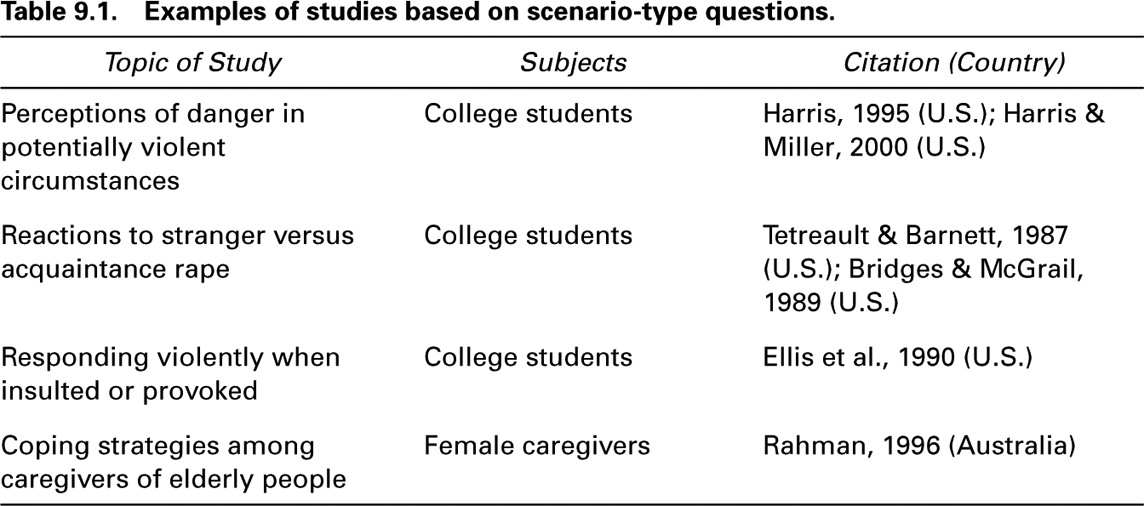
Other examples of scenario measures are shown in table 9.1. Notice that most of them have to do with human aggression in one form or another.
GUIDELINES FOR ITEM CONSTRUCTION
Much of the advice given by seasoned researchers about question construction falls within the realm of common sense. For example, questions should be easy to understand and arranged in the questionnaire in an easy-to-follow format. If several different types of questions are asked, it is usually a good idea to group similar questions together. Otherwise, respondents are forced to repeatedly switch their frame of mind as they proceed through the questionnaire.
Other rules for those beginning to learn questionnaire construction are to put yourself in the place of your respondent, and, above all, to carefully pretest any questionnaire before it is mass produced (Diamantopoulos et al., 1994; Fowler & Mangione, 1990). Pretesting refers to the administration of a questionnaire to would-be subjects before giving it to actual subjects. It is best to pretest in four distinct steps, each of which is described here:
Self-Test Phase: Every questionnaire should first be taken by the person who designed it. After the questionnaire has been completed, it should be set aside for a few days so that it is no longer fresh in the researcher’s mind. Then a copy should be printed out and completed by the designer as though he or she were an actual respondent. In completing the questionnaire, the designer should try to assume the role of a subject who will actually be surveyed.
Informed Pre-Subject Phase: Copies of the questionnaire should be given to three or four people who are aware of the basic purpose of the study. These pre-subjects should be asked to critique each question for clarity and likelihood of eliciting responses relevant to the purpose of the study.
Uninformed Pre-Subject Phase: Up to a dozen or so copies of the revised questionnaire should be administered to people who are unaware of the detailed purpose of the study. This group of pre-subjects should be asked to complete the questionnaire in its entirety without critiquing it. After completing the questionnaire, these pre-subjects should be debriefed and asked to identify any problems with the wording of the questions. Since the designer of the questionnaire is often tempted in these debriefing sessions to correct the pre-subjects about how they should have interpreted the questions, it is better to have someone other than the questionnaire’s designer performing these interviews. None of these completed questionnaires will be used in the study.
Early Actual Subject Phase: Assuming that all the questionnaires do not have to be administered at one time, it is a good idea to conduct one final pretest of the first ten to twenty-five questionnaires actually administered. Unless some serious problems arise, the data from these questionnaires will be included in the study.
Pretesting of questionnaires is very important, whether the questionnaires are completed directly by respondents or by trained interviewers.
CLUSTERING ITEMS WITH SIMILAR FORMATS
If you have several things you want your subjects to disclose to you, it is often a good idea to group a series of similar questions together under a single heading, a practice known as item clustering. For example, if you are interested in a wide range of behavior or personality patterns, you might present your subjects with the following statement linked to a list of specific items.
Please rate the degree to which you enjoy the following things (Respond on a scale from 1 to 9, with 1 being the least enjoyable and 9 being the most enjoyable):
One-on-one competition with others _________
Being alone and exploring nature _________
Attending a party filled with people you have never met _________
Taking serious risks with your life in the balance_________
Exercising control over other people_________
Notice how much easier it will be for subjects to answer these question in their abbreviated form than it would be if each question was separated from the others. Item clustering is a good way to obtain responses to numerous questions in a minimum space. It also has the advantage of minimizing the number of words a subject must read, which in turn minimizes the risk that a question will be misinterpreted.
TYPES OF QUESTIONS TO AVOID
Even though no ironclad rules can be made regarding exactly how to design and phrase questionnaire items, six recommendations can be made with respect to the types of questions that should not be used. These are as follows:
1. Avoid Rhetorical and Leading Questions
Leading questions are stated in such a way as to beg for a particular response. Rarely should items that are rhetorical or leading be included in a questionnaire (unless a questionnaire is simply being used as a propaganda tool rather than for scientific research).
Especially when studying people’s attitudes on some subject, a researcher may be tempted to try to open their minds. As a result, questions are likely to be argumentative or have a preachy tone to them. The following two questions are essentially rhetorical in character:
Wouldn’t you say it is high time that women in this country receive equal treatment under the law?
How much justification can you see in the way people on welfare are being treated in today’s society?
The rhetorical nature of these questions may elicit affirmative responses from significant numbers of subjects who would not have responded affirmatively to a neutrally phrased question. However, the value of this information as reflections of people’s real attitudes will have been compromised.
2. Avoid Conjunctive Items
Conjunctive items ask subjects to respond to more than one issue at a time. For example, if it is the researcher’s intention to determine how favorable people’s attitudes are toward a country’s current president, the question might ask whether subjects consider the president to be an honest and competent leader. Although both of these personal qualities would be seen as favorable, some respondents might consider the president honest but not competent, or vice versa. Normally, if one is interested in someone’s overall attitudes toward something, rather than in how they would objectively assess various qualities of something, the questions should be phrased in a straightforward way: for example, ‘‘What is your overall impression of the current president?’’
Avoid Yea-Saying Items
Social scientists have discovered that certain types of statements often elicit what are called yea-saying responses from a substantial proportion of subjects (Goldsmith, 1987). Basically, these items have a philosophical-sounding tone that seems to compel many respondents to affirm them. Here are two examples:
These days, a person does not really know who he can count on.
With the way things look for the future, it is hardly fair to bring children into the world.
What makes these items noteworthy is that they were among the items used for years to measure anomie, a widely used concept roughly meaning without social identity (Durkheim, 1951). In the early 1970s, the validity of such items for measuring anomie was called into question when it was discovered that many subjects who agreed with these two statements also agreed with their exact opposite (sometimes even within the same questionnaire!) (Carr, 1971).
Items such as these have a quality about them that seems to ring true for many people regardless of any objective meaning they may convey. Other examples of yea-saying items come from studying the way people express their views on highly emotional issues. Overall, items that are likely to elicit yea-saying responses should be avoided.
4. Avoid Kernel-of-Truth Items
Many emphatic statements may be partially true. As a rule these should be avoided in social science questionnaires, particularly if they are obviously condescending (i.e., insulting). Examples of these questions are:
The elderly are a burden to society.
Ex-convicts cannot be trusted.
Both of these statements would put many respondents in a quandary as to how to respond. They would feel uncomfortable grossly generalizing about people in ways that are obviously derogatory. Nevertheless, they might also feel that both the elderly and ex-convicts as groups do differ from people in general as the statements assert.
5. Avoid Questions That Have Ambiguous Words or Phrases
Even though the following items at first glance seem to be clear, they can be taken in a variety of ways:
Do you believe that prisons are effective?
Are you a drug user?
Why are these examples ambiguous? The concept of prison effectiveness could be interpreted in several ways. It could be interpreted in the sense of keeping convicted prisoners from committing crimes as long as they are behind bars, committing new crimes after prison release, or even remaining steadily employed after leaving prison. Regarding the question of drug use, would not the type of drugs (including prescription drugs), the amounts, and the time frame involved all be important?
6. Avoid Questions about Behavior Not Bounded by Time (and Sometimes by Place)
For example, the following questions would be difficult for subjects to answer if their church-attending behavior had recently changed or if they just recently became eligible to vote:
How often do you go to church?_________
Do you usually vote?_________
To make the first question more meaningful, it might be bounded in time as follows, assuming that the researcher is primarily interested in recent church attendance:
Over the past year, how many times did you attend church services?_________
Or, if church-attending behavior in childhood is of primary interest, then the question might be phrased as follows:
As you were growing up, approximately how many times did you attend church services in an average year?_________
Or, if both childhood and current church attendance are of interest, the question might be phrased as follows:
Please indicate about how many times you attended church services in an average year during the following times in your life:
From ages one to ten
From ages eleven to eighteen
From age nineteen to the present (if applicable)
Regarding the voting question, the researcher should assess what it is that he or she is trying to determine. Then the question should be made more specific in terms of the types of voting and the time frame during which subjects would have an opportunity to vote.
EXAMPLES OF POORLY PHRASED QUESTIONS
Although many questionnaire items can only be meaningfully critiqued within the context of the overall purpose of the study for which they were designed, some items are so obviously flawed that they should not be used for any research study. Read each of the following four examples, and see if you can spot problems with them:
1. What is the size of your family?
2. Do you have good relations with your parents?
3. If a woman says no to sex, she means no.
4. Is peer pressure a result of your drinking?
Below are brief critiques and more suitable alternatives for each of these four questions.
1. What Is the Size of Your Family?
Some subjects answering this question might assume that the researcher is only interested in knowing how many brothers and sisters (siblings) they have, while other respondents would probably include their parents plus their siblings in the count. Subjects whose parents are divorced might not know whether to include both parents or just one. Also, those with older siblings no longer living at home would probably not know whether to count them or not. This question is simply too vague.
Most of the ambiguities could be avoided by asking subjects, ‘‘How many brothers and sisters do you have?’’ Of course, a researcher interested in more detailed aspects of various family arrangements might instead ask whether all family members were presently in the home, or whether subjects had any half-siblings (either in or outside the home).
2. Do You Have Good Relations with Your Parents?
This question has two problems. First, it asks for an either/or answer to a question to which many subjects would want to give an intermediate answer. The second problem is that the question is not bounded in time (e.g., within the past year, the past five years, throughout childhood). Obviously, parent-child relationships are dynamic and almost certain to vary over time. A better question might be:
On a scale from 1 to 10 (with 1 being the worst, and 10 being the best imaginable), how would you rate your relationship with your parents during the following periods of your life?
From early childhood to age twelve
From ages thirteen to eighteen
From age eighteen (if applicable)
3. If a Woman Says No to Sex, She Means No.
This statement seems straightforward, and has been used to assess people’s attitudes toward so-called date-rape (Briere & Malamuth, 1983; Malamuth et al., 1980). However, research has shown that a substantial minority of women (about 40 percent) self-report that they sometimes say no to a male’s sexual advances in dating situations when they are in fact willing to have sex (Muehlenhard & Hollabaugh, 1988). Members of either sex who are aware of (or at least suspect) this possibility will find it difficult to give an unqualified agree/disagree response to such a statement.
Depending on the exact purpose for including this item in a research questionnaire, a better phrasing might be as follows:
To what degree do you feel that, in a dating situation, if a woman says she does not want to have sex, her date has no right to push the issue further? Answer from 0 to 10, with 0 meaning that her date has no right to pressure her, and 10 meaning that he has a right to pressure her until he gets his way.
4. Is Peer Pressure a Result of Your Drinking?
This question is poorly phrased. Presumably, the researcher who proposed it wanted to know to what degree subjects who drank did so because of peer pressure (rather than because they liked its taste, were becoming addicted, or wanted to drink for some other reason). This question might be better broken into the following two questions:
In the past year or so, how often have you consumed alcohol? (circle one)
never
seldom
occasionally
fairly often
very often
If you do drink, indicate which of the following best explains why you do so? (Assign a 1 to the main reason and a 2 to the second most important reason)
___Because my friends are doing it
___Because I enjoy the taste
___Because I am (or may be becoming) addicted
___Because I was encouraged to do so at home
___Because I like the way it makes me feel
___Other (specify)
COMBINING TWO OR MORE ITEMS TO IMPROVE RELIABILITY
If a variable can be reliably and validly measured with a single item, there is little justification for including more than one question about it in a questionnaire. For example, researchers need not develop more than one item for measuring the sex and age of subjects. However, for variables that are difficult to measure accurately (as many variables pertaining to behavior, emotions, and attitudes are), researchers often ask more than one question within the same questionnaire and then combine the responses to these items into a single score. These measures are called multi-item scales (or multi-item tests) and have been shown to substantially improve the reliability of difficult-to-measure variables (Mould, 1988, 332; Neston & Safer, 1990; Rushton et al., 1983; Sax, 1980, 271).
An example of a multi-item scale for measuring variations in handedness was discussed at the beginning of chapter 6. Recall that a number of researchers ask subjects which hand is used in performing four or five different handedness tasks. Then numbers are assigned to the answers for each question and added together for a single handedness measure.
Another example of a multi-item scale involves examinations that are taken by students. While an instructor might sometimes make a determination of a student’s grade based on a single question, more often numerous questions are asked and a grade assigned on the basis of the proportion of the questions answered correctly.
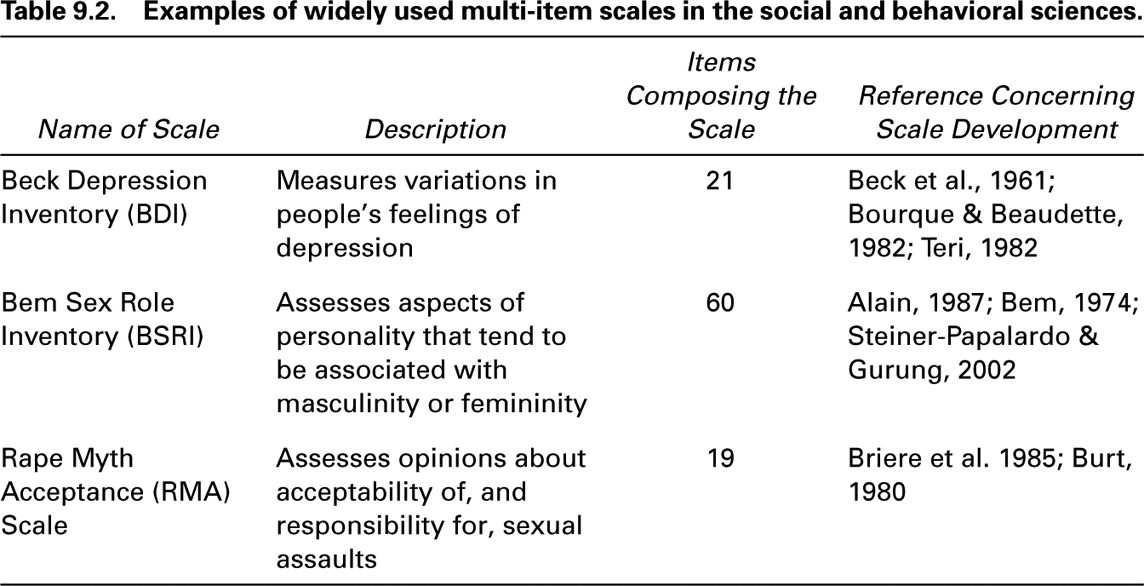
Examples of a few of the most widely used multi-item scales in social science research are shown in table 9.2.
Researchers should take advantage of the efforts by others to develop valid and reliable multi-item scales for the variables in which they have an interest. Nevertheless, there are sometimes good reasons for developing new multi-item scales or seeking to improve old ones. Some guidelines to keep in mind when devising multi-item scales are as follows:
1. Make sure that all the items used in a given scale are relevant to the variable targeted for measurement. Unfortunately, determining the relevance of items to a variable is not always easy or obvious, even for experienced researchers. Because intuitive methods of judging whether or not questions are really relevant to a particular variable can sometimes be incorrect (especially when dealing with complex intellectual and attitudinal variables), many researchers supplement their intuition with a special statistical technique called factor analysis. Basically, as noted in chapter 6, factor analysis is a type of multivariate correlational statistic that allows researchers to locate subtle patterns in the way large numbers of subjects respond to questions. From these statistically derived patterns, questionnaire items can be grouped together in precise mathematical terms (Thompson, 1962). As with all multivariate statistics, you should get help from someone familiar with it the first time or two that you use it.
2. The items composing a scale are usually equally weighted. This means that no question has more influence on the final scale score than any other question. To give each item equal weight, the structure and number of response options for each item should all be the same.
3. Whenever possible, researchers should measure continuous variables (the opposite of discrete variables) at the interval or ratio levels. Continuous variables measured at the nominal and ordinal levels make it difficult for a researcher to treat the results in statistically meaningful ways. In particular, only variables measured at the interval or ratio levels allow one to calculate means and standard deviations. In this regard, even though many treat data based on Likert scale data as interval data by calculating mean responses on these scales, statisticians point out that Likert scales are best considered ordinal, rather than interval data (Sobel, 1992, 664).
4. In deriving individual scores on a scale, researchers should be sure to reverse score any items that are negatively assessing what the scale is designed to measure. For example, suppose the following two items were used to measure the degree to which adults exhibited hyperactive-disruptive symptoms in childhood:
To what degree do you recall being disruptive in grade school? (Answer from 1 to 9, with 1 representing not at all and 9 representing to an extreme degree)_________.
When you were a child, to what degree did you enjoy playing quietly by yourself or with a friend, rather than engaging in boisterous, rowdy play? (Answer from 1 to 9, with 1 representing not at all and 9 representing to an extreme degree)_________.
In order for the possible scores on this two-item scale to range as they should from 2 to 18, the score for one of them needs to be inverted. Since this is a scale for measuring childhood hyperactivity and disruptiveness, which of the two items should be reverse scored? The answer is the second one.
TIME DIARIES: A SPECIAL TYPE OF QUESTIONNAIRE
Most questionnaire items either ask about things that have occurred in the past or are concerned with people’s attitudes. In a few types of questionnaires, however, subjects are asked to maintain daily or weekly logs of their ongoing behavior. These logs are usually called time diaries, and the resulting data are termed time-use data. The first use of time diaries on a large scale involved the Multinational Time Use Project, involving twelve industrialized countries during the 1960s (Harvey, 1993). Most time diaries ask subjects to record information about their behavior at least on a daily basis, and often several times each day. In a few time diary studies, subjects wear a beeper device that tells them when to provide an entry into their log (Stone & Shiffman, 1994).
Time diaries usually provide respondents with few specific categories within which to code their activities. An Italian study indicated that respondents would rather use their own words to describe their activities and let coders fit the responses into analyzable categories (Harvey, 1993, 215).
One of the earliest ongoing activity studies was conducted among police officers while on duty (Reiss, 1971). This study found that only about 20 percent of the typical officer’s time was spent investigating crime; the remaining time had more to do with community service activities.
Several studies have employed time diaries to detect changes in gender-related division of household labor. These studies indicate that despite the fact that women in industrialized countries work outside the home much more now than was true thirty to forty years ago, men’s contribution to household chores such as cooking and cleaning seems to have changed very little during that time (Brines, 1994; Marini & Shelton, 1993; Presser, 1994).
COMPUTERIZED QUESTIONNAIRES AND USE OF THE INTERNET
Two related technological developments are in the midst of improving questionnaire design and administration. One is the advent of the Internet, which opened up a lot of new opportunities for obtaining research subjects. The other involves recently developed computerized programs for designing virtual interactive questionnaires. These questionnaires can remind subjects that they failed to answer certain questions, and even follow up on any seemingly inconsistent responses.
Because these questionnaire options are relatively new, their use is still somewhat limited to experimental and demonstration projects. However, they are becoming more and more widely used with the creation of websites like www.surveymonkey.com, and many others. These websites make survey construction relatively easy because, for a price, the website will create your survey, disseminate it via e-mail, create a URL for your website, and even tally the results from the respondents. One of the first questions addressed by those who have been on the forefront of computer design and Internet administration of questionnaires has been the type of subjects most likely to respond to Internet questionnaires. The answer has been fairly reassuring in the sense that the respondents seem to be similar to college-educated young people who have always weighed most heavily in social science research (Horswill & Coster, 2001; Pasveer & Ellard, 1998), and who constitute the bulk of subjects currently completing social or behavioral questionnaires (Sears, 1986). To help ensure against multiple submissions by overly enthusiastic subjects, one researcher asked for each subject’s e-mail, which was later used to thank the subject for participating in the study (Schmidt, 1997).
An additional advantage of using Internet technology in social science research is that it allows researchers to combine questionnaire data with other types of data. For example, a British study combined a questionnaire measure of risk-taking behavior with a test consisting of a series of photographs to assess preferences on driving speed, passing safety, and gaps in following other vehicles (Horswill & Coster, 2001). This study indicated that there was general agreement between the two measures.
Another example of combining computerized questionnaire data and other forms of data was a study of people’s abilities to judge the ‘‘dominance’’ qualities in schematic sketches of faces (Senior et al., 1999). While the research was touted as a demonstration project, it suggested that certain aspects of human faces provide cues to others as to their dominance and charisma.
As the use of computerized questionnaires and other Internet research data opportunities grow, one of the most promising outcomes may be the speed and accuracy with which results can be tabulated and analyzed. With subjects entering their own data in digital form, data entry is automatic, and all the researcher needs to do is to run his or her analysis when sufficient numbers of subjects have responded. These surveys are also cheaper than their mail survey counterparts, and can reach potentially large samples with the click of a button. Disadvantages, however, include that some of the subjects researchers want to study do not have as easy access to computers and the Internet as others, there could be problems with e-mail (spam filters, etc.), and the fact that respondents can easily delete the survey with the click of the mouse. Ethical problems could also arise with the lack of anonymity through e-mail or trouble with consent forms and safeguards to protect confidentiality. A final point is that as more and more people access the World Wide Web, the subjects in social science research should become increasingly international.
FINAL COMMENTS ON QUESTIONNAIRE DATA
In measuring variables, it is wise to employ operational measures that have been previously developed and shown to be reliable and valid according to criteria presented in chapter 6. For this reason (as well as others), those not familiar with the literature in a specific area should seek help from someone who has done prior work in that area.
Having made the point in favor of using already tried-and-true operational measures when they exist, it should be quickly added that if one is familiar with a field and feels there are good reasons for defying conventional ways of measuring a variable, do so. Often, the biggest breakthroughs in science come from novel innovations in the operationalization of some key variable (Kennedy et al., 1972, 602).
Additional closing remarks center around not abusing the goodwill of those who agree to serve as subjects in a study. One of the heartwarming aspects of social science research comes from discovering how willing most people are to cooperate as research subjects. This willingness to help is greatest, of course, when the time involved seems reasonable, when they believe that the results will be worthwhile, and when they are treated courteously and in accordance with the golden rule (Do unto others as you would have them do unto you). Also, people are more inclined to be subjects in a research project if the questions are stated clearly and concisely, and the response options are appropriate and easy to understand.
Another general point has to do with the phrasing of questionnaire items. Sometimes fairly subtle changes in the wording can have substantial effects upon response patterns. For a case in point, consider a recent study in which 42 percent of college males self-reported having coerced a female into some type of sexual behavior (Craig et al., 1989). This percentage of men who admitted to sexual assault is nearly three times higher than what most other studies of males have found (reviewed by Ellis, 1989, 4). In discussing these findings, the investigators speculated that the difference may have been due to the unique way they phrased their question. Instead of asking subjects, ‘‘Have you ever . . . ,’’ Craig et al. (1989, 430) asked, ‘‘How many times have you ever. . . .’’ If this simple change in wording is responsible for their unusual findings, it still leaves open the issue of which is the more valid way to phrase such questions.
Finally, it should be noted that not all data in the social sciences are collected via questionnaires. In particular, a number of social science studies have been based on direct observations. These data collection methods are given attention in the next two chapters.
SUMMARY
This chapter dealt with issues and options concerning the construction of social science research questionnaires. No one knows exactly what proportion of social science data is derived from questionnaires (either directly by having respondents read and respond to questions, or indirectly by having them respond to questions asked by an interviewer), but it is safe to say that the figure is well over half. The main advantage of questionnaire data, compared with direct observation by trained researchers, is that it makes possible the collection of massive amounts of data inexpensively and quickly. However, the main potential dis advantage is that the data may be low in reliability. Unless both the questions and the response options are carefully phrased and pretested, and the subjects are motivated to provide honest and thoughtful answers, the results can be very misleading.
Three major topics about questionnaire construction were addressed in this chapter. The first had to do with the types of response options that can be presented to respondents. These options were subsumed under the following five categories: open-ended, fill-in-the-blank, end-anchored (both linear and numeric), all-points-anchored, and ranking. Each option has legitimate uses in the social sciences. Many factors need to be weighed by researchers in deciding which response option to use, including the degree of precision desired, the age and educational background of the subjects, and the audience for which the final report of the results is being prepared.
The second topic covered in this chapter dealt with ways of phrasing items in a questionnaire. A number of guidelines were offered while recognizing that sometimes there are legitimate reasons for deviating from some of them. About the only guideline that should never be ignored has to do with pretesting questionnaires. Ideally, questionnaire pretesting should consist of four phases: a self-test phase, an informed pre-subject phase, an uninformed pre-subject phase, and an early actual subject phase.
The third topic of this chapter pertained to the formation of multi-item scales by combining the results of two or more individual questions intended to measure the same variable. This procedure can serve to broaden the variation in scores as well as to increase the reliability of a variable’s measurement.
In addition to these three topics, this chapter briefly discussed time diaries and computerized questionnaires. Studies based on time diaries basically involve asking subjects to maintain logs pertaining to their daily activities. These studies have most often been used to assess cultural variations in how people allocate their time and energy.
Regarding computerized questionnaires, several programs are now available for helping researchers better design questionnaires. Some of these programs allow researchers to automatically download responses into data analysis programs. Along similar technological lines, growing numbers of studies have begun to draw research participants from visitors to sites on the World Wide Web.
SUGGESTED READINGS
Schumann, H., & Presser, S. (1981). Questions and answers in attitude surveys. New York: Academic Press. (Contains a great deal of useful advice on how to measure variations in people’s attitudes.)
Sudman, S., & Bradburn, N. M. (1982). Asking questions. San Francisco: Jossey-Bass. (A book well worth consulting for helpful hints on asking questions with maximum clarity.)
True, J. A. (1989). Finding out: Conducting and evaluating social research (2nd ed.). Belmont, CA: Wadsworth. (Part II of this book provides many examples of how social and behavioral science data may be collected, including how questions should be phrased and organized.)