Chapter 3: Putting Diagrams on Slides
In This Chapter
 Creating a diagram
Repositioning and resizing diagrams
Laying out and changing the look of diagram shapes
Changing the appearance of a diagram
Creating a diagram from shapes
Using the Equation Editor to construct an equation
Along with charts and tables, diagrams are the best way to present your ideas to an audience. Diagrams clearly show, for example, employees’ relationships with one another, product cycles, workflow processes, and spheres of influence. A diagram is an excellent marriage of images and words. Diagrams allow an audience to literally visualize a concept, idea, or relationship.
This chapter explains how PowerPoint diagrams are constructed from SmartArt graphics and how to create a diagram. It shows how to customize diagrams by changing the size of diagrams and diagram shapes, adding and removing shapes, and changing shapes’ colors. You also discover how to change the direction of a diagram and enter the text. Finally, this chapter shows how to create a diagram from scratch with shapes and connectors and how to put an equation on a slide by taking advantage of the Equation Editor.
The Basics: Creating SmartArt Diagrams
In PowerPoint, diagrams are made from SmartArt graphics. These diagram graphics are “interactive” in the sense that you can move, alter, and write text on them. In other words, you can use them to construct diagrams. Because SmartArt graphics are based on the XML format (Book I, Chapter 2 explains what XML is), you can alter them to your liking. You can make the diagram portray precisely what you want it to portray, although you usually have to wrestle with the diagram a bit.
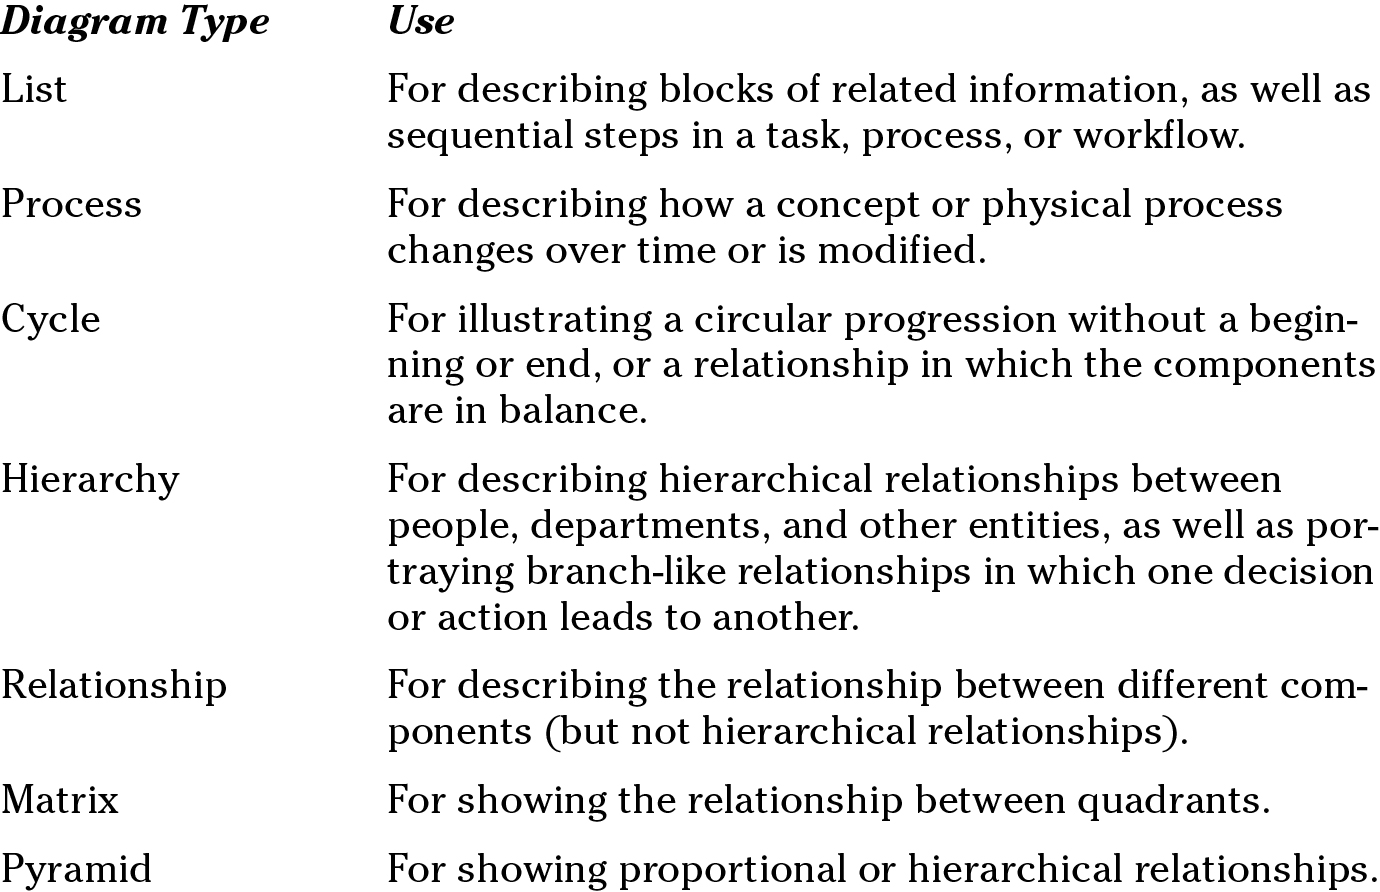
The first step in creating a diagram is to select a layout in the dialog box shown in Figure 3-1. After you create the initial diagram, you customize it to create a diagram of your own. There are about 80 diagrams in the dialog box. They fall into these seven types:
|
Figure 3-1: To create a diagram, start by selecting a diagram in this dialog box. |
|
.jpg)
After you select a generic diagram in the Choose a SmartArt Graphic dialog box and click OK, the next step is to make the diagram your own by completing these tasks:
 Change the diagram’s size and position: Change the size and position of a diagram to make it fit squarely on your slide. See “Changing the Size and Position of a Diagram,” later in this chapter.
Add shapes to (or remove shapes from) the diagram: Adding a shape involves declaring where to add the shape, promoting or demoting the shape with respect to other shapes, and declaring how the new shape connects to another shape. See “Laying Out the Diagram Shapes,” later in this chapter.
Enter the text: Enter text on each shape, or component, of the diagram. See “Handling the Text on Diagram Shapes,” later in this chapter.
If you so desire, you can also customize your diagram by taking on some or all of these tasks:
Changing its overall appearance: Choose a different color scheme or 3-D variation for your diagram. See “Choosing a Look for Your Diagram,” later in this chapter.
Change shapes: Select a new shape for part of your diagram, change the size of a shape, or assign different colors to shapes to make shapes stand out. See “Changing the Appearance of Diagram Shapes,” later in this chapter.
If you’re comfortable creating a diagram of your own by drawing shapes and lines, no law says you have to begin in the Choose a SmartArt Graphic dialog box. Later in this chapter, “Creating a Diagram from Scratch” looks into creating a diagram by making use of text boxes, lines, and shapes.
Creating the Initial Diagram
The first step in fashioning a diagram is to choose a SmartArt graphic in the Choose a SmartArt Graphic dialog box. After that, you roll up your sleeves, change the diagram’s size and shape, and enter the text. If you select the wrong diagram to start with, all is not lost. You can choose another diagram in its place, although how successful swapping one diagram for another is depends on how lucky you are and how far along you are in creating your diagram. These pages explain how to create an initial diagram and swap one diagram for another.
Creating a diagram
Follow these steps to create a diagram:
1. Open the Choose a SmartArt Graphic dialog box.
Figure 3-1 (shown earlier in this chapter) shows this dialog box. You can open it two ways:

• On the Insert tab, click the SmartArt button.

• Click the SmartArt icon in a content placeholder frame. You can find this icon on slides created with the Title and Content, Two Content, Comparison, and Content with Caption slide layouts.
2. Select a diagram in the Choose a SmartArt Graphic dialog box.
Diagrams are divided into seven types, as I explain earlier in this chapter. The dialog box offers a description of each diagram. Either select a type on the left side of the dialog box or scroll the entire list to find the graphic that most resembles the diagram you want.

In the Hierarchy category, select the Organization Chart, Hierarchy, or Horizontal Hierarchy if you want to create a graph with many levels and branches. These three diagrams are much more complex than the others. See “Laying Out the Diagram Shapes,” later in this chapter, for details.
3. Click OK.
The next section in this chapter explains how to swap one diagram for another, in case you chose wrongly in the Choose a SmartArt Graphic dialog box.

Starting from a sketch
You can spare yourself a lot of trouble by starting from a sketch when you create a diagram. Find a pencil with a good eraser, find a blank piece of paper, and start drawing. Imagine what your ideal diagram would look like. Draw the arrows or lines connecting the different parts of the diagram. Enter the text. Draw the diagram that best illustrates what you want to communicate to your audience.
Later, in the Choose a SmartArt Graphic dialog box (refer to Figure 3-1), you can choose the diagram that most resembles the one you sketched. The dialog box offers about 80 types of diagrams. Unless you start from a sketch and have a solid idea of the diagram you want, you can get lost in the dialog box. Unless you start from a sketch, adding shapes to the diagram and landing them in the right places can be a chore.
As I explain throughout this chapter, you can tinker with diagrams. You can add shapes, increase and decrease the size of shapes, and otherwise alter a diagram, but if you start with a diagram very close to the one you want, you won’t have to do much of that. You’ll get a head start. Your sketch will show you the diagram you want, and you’ll be able to identify it in the Choose a SmartArt Graphic dialog box.
Swapping one diagram for another
If the diagram you chose initially doesn’t do the job, you can swap it for a different diagram. How successful the swap is depends on how far along you are in creating your diagram and whether your diagram is complex. Follow these steps to swap one diagram for another:
1. Click your diagram to select it.
2. Click the Change Layout button.
You see a gallery with diagrams of the same type as the diagram you’re working with.
3. Select a new diagram or choose More Layouts to open the Choose a SmartArt Graphic dialog box and select a diagram there.
You may have to click the trusty Undo button and start all over if the diagram you selected for the swap didn’t do the job.
Changing the Size and Position of a Diagram
To make a diagram fit squarely on a slide, you have to change its size and position. Resizing and positioning diagrams and other objects is the subject of Book IV, Chapter 2, but in case you don’t care to travel that far to get instructions, here are shorthand instructions for resizing and positioning diagrams:

Resizing a diagram: Select the diagram, move the pointer over a selection handle on the corner or side, and start dragging when the pointer changes into a two-headed arrow. You can also go to the (SmartArt Tools) Format tab, and enter new measurements in the Width and Height boxes (you may have to click the Size button first, depending on the size of your screen).

Repositioning a diagram: Select the diagram, move the pointer over its perimeter, and when you see the four-headed arrow, click and start dragging.
Notice when you resize a diagram that the shapes in the diagram change size proportionally. Most diagrams are designed so that shapes fill out the diagram. When you change the size of a diagram, remove a shape from a diagram, or add a shape, shapes change size within the diagram.
Laying Out the Diagram Shapes
At the heart of every diagram are the rectangles, circles, arrows, and whatnots that make the diagram what it is. These shapes illustrate the concept or idea you want to express to your audience. Your biggest challenge when creating a diagram is laying out the diagram shapes.

These pages explain how to select diagram shapes, add shapes, and remove shapes from diagrams. They offer instructions specific to working with hierarchy diagrams.
Selecting a diagram shape
Before you can remove a shape from a diagram or indicate where you want to add a new shape, you have to select a diagram shape. Selecting a shape isn’t simply a matter of clicking if text has been written on the shape. Follow these instructions to select a diagram shape:
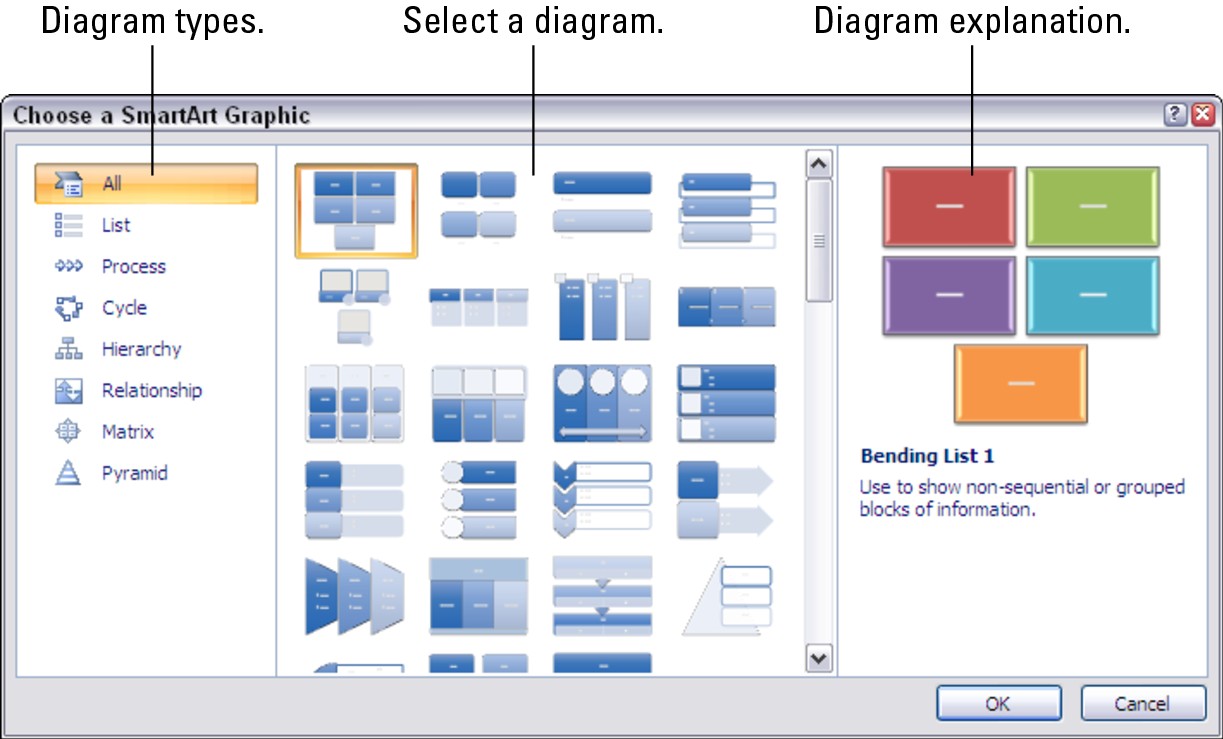
Selecting a shape with text: Click the shape twice, as shown in Figure 3-2. First click anywhere in the shape and then move the pointer to the perimeter of the shape and click when a four-headed arrow appears beside the pointer.
Selecting a shape without text: Simply click anywhere in the shape.
|
Figure 3-2: A selected diagram shape is surrounded by solid, not dotted, lines. |
|
Removing a shape from a diagram
Removing a shape from a diagram is as easy as falling off a turnip truck, as long as you correctly select the shape before you remove it (the previous section in this chapter explains how to select shapes).
To remove a shape, select it and then press Delete. Other shapes grow larger when you remove a shape in keeping with PowerPoint’s “fill out the diagram by any means necessary” philosophy.
Adding shapes to diagrams apart from hierarchy diagrams
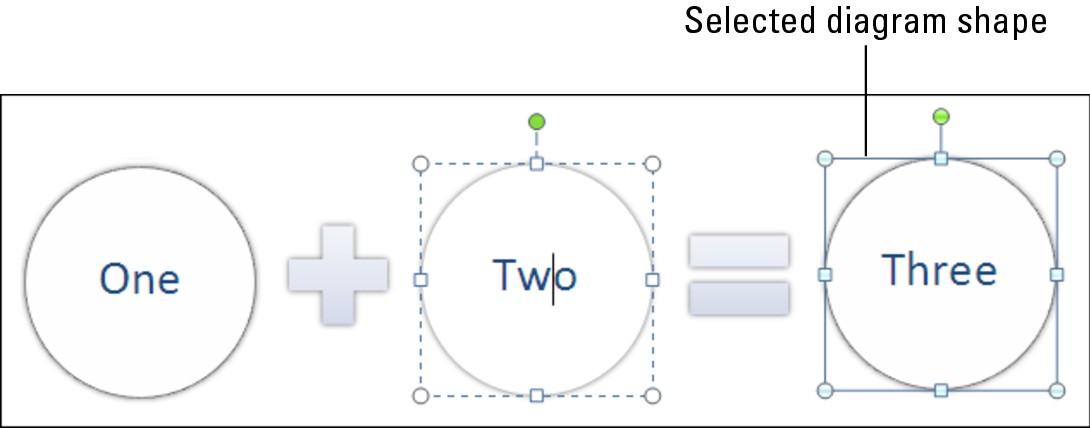
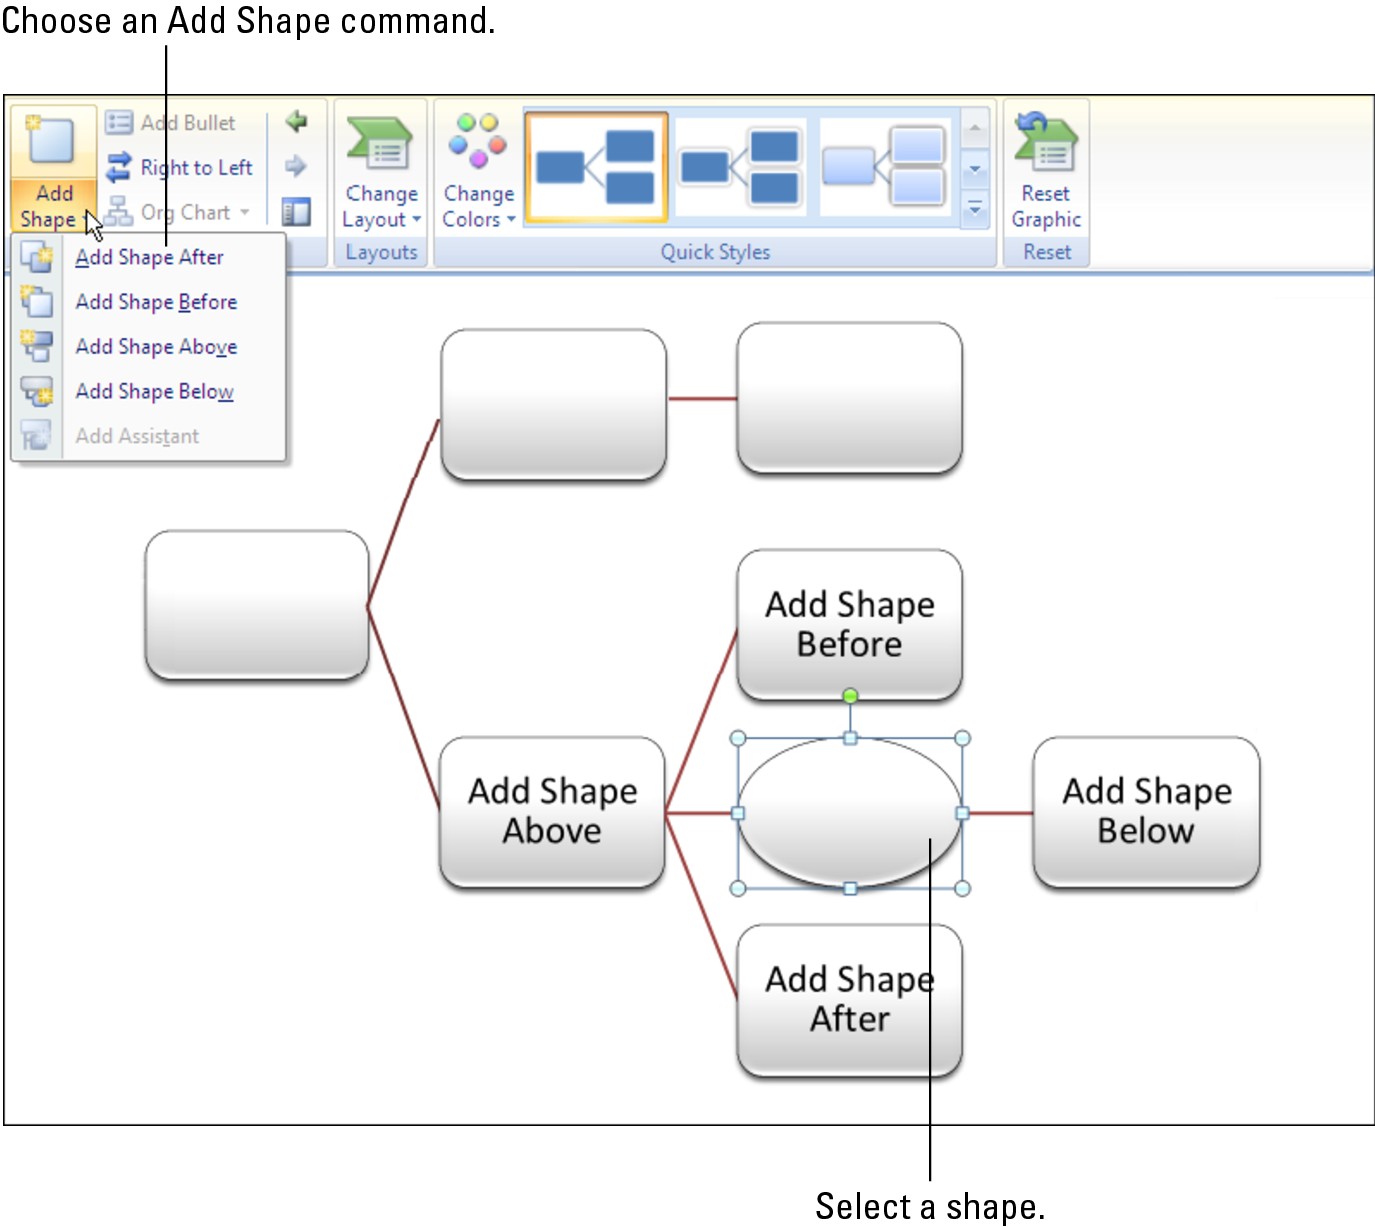
Unlike hierarchy diagrams, list, process, cycle, relationship, and matrix diagrams don’t have branches. They always travel in one direction only, which makes adding shapes to these diagrams fairly straightforward. To add a shape, you select a shape in the diagram and then add the new shape so that it appears before or after the shape you selected, as shown in Figure 3-3.
Follow these steps to add a shape to a list, process, cycle, relationship, matrix, or pyramid diagram:
1. In your diagram, select the shape that your new shape will appear before or after.
|
Figure 3-3: To add a shape, start by selecting the shape that your new shape will go before or after. |
|
Earlier in this chapter, “Selecting a diagram shape” explains how to select shapes.
2. Choose the Add Shape After or Add Shape Before command.
To get to these commands, use one of these techniques:

• On the (SmartArt Tools) Design tab, open the drop-down list on the Add Shape button and choose Add Shape After or Add Shape Before, as shown in Figure 3-3.
• Right-click the shape you selected, choose Add Shape on the shortcut menu, and then choose Add Shape After or Add Shape Before on the submenu.
The new shape appears in your diagram.
Adding shapes to hierarchy diagrams
Hierarchy diagrams are more complex than other diagrams because they branch out such that shapes are found on different levels. This branching out makes adding shapes to hierarchy diagrams problematic.
In the first place, the Add Shape commands do different things on hierarchy diagrams, depending on whether the diagram is horizontally or vertically oriented. In hierarchy diagrams, you can promote and demote shapes, something that you can’t do in other diagrams. If you’re working with an Organization Chart, you get a set of commands — the Layout commands — for making shapes “hang” rather than fall below other shapes.
These pages explain how to add shapes to vertically oriented diagrams, horizontally oriented diagrams, and Organization Charts. (One hierarchy diagram, Hierarchy List, is just two right-hanging diagrams shapes, and it isn’t truly a hierarchy diagram.)
Adding shapes to horizontally oriented diagrams
A horizontally oriented diagram (Horizontal Hierarchy and Horizontal Labeled Hierarchy) is a simple branching, horizontal diagram. In a horizontally oriented diagram, shapes can branch only from a shape in the level above; shapes can’t branch sideways from one another, as they can in an Organization Chart diagram. Figure 3-4 shows a Horizontal Hierarchy diagram along with the Add Shape drop-down list for adding shapes to diagrams.
Follow these steps to add a shape to a horizontally oriented diagram:
1. In your diagram, select the shape to which your new shape will be connected.
Earlier in this chapter, “Selecting a diagram shape” demonstrates how to select a shape.
2. Choose an Add Shape command.
You can choose Add Shape commands with one of these techniques:
|
Figure 3-4: In a horizontally oriented diagram, the Add Shape commands are based on rank. |
|
• On the (SmartArt Tools) Design tab, open the drop-down list on the Add Shape button and choose an Add Shape command (refer to Figure 3-4).
• Right-click the shape you selected, choose Add Shape on the shortcut menu, and then choose an Add Shape command.
Figure 3-4 shows what Add Shape commands do.
In effect, you choose two commands when you choose Add Shape Above — you insert a shape above the shape you selected and you demote the shape you selected to the next level in the hierarchy. The Add Shape Above command demotes the shape you selected to the next lowest level to make room for the new shape. Rather than choose the Add Shape Above command, you might consider selecting a shape in the level above and then choosing the Add Shape Below command.
Adding shapes to vertically oriented diagrams
Follow these steps to add a shape to the vertically oriented Hierarchy, Labeled Hierarchy, or Table Hierarchy diagram:
1. Select the shape to which your new shape will be connected.
Earlier in this chapter, “Selecting a diagram shape” demonstrates how to select a shape.
2. Choose an Add Shape command.
You can choose Add Shape commands with either these techniques:
• On the (SmartArt Tools) Design tab, open the drop-down list on the Add Shape button and choose an Add Shape command.
• Right-click the shape you selected, choose Add Shape on the shortcut menu, and then choose an Add Shape command.
The Add Shape Before command places the new shape to the left of the shape you selected; the Add Shape After command places the new shape to the right.
Handling shapes on Organization Charts
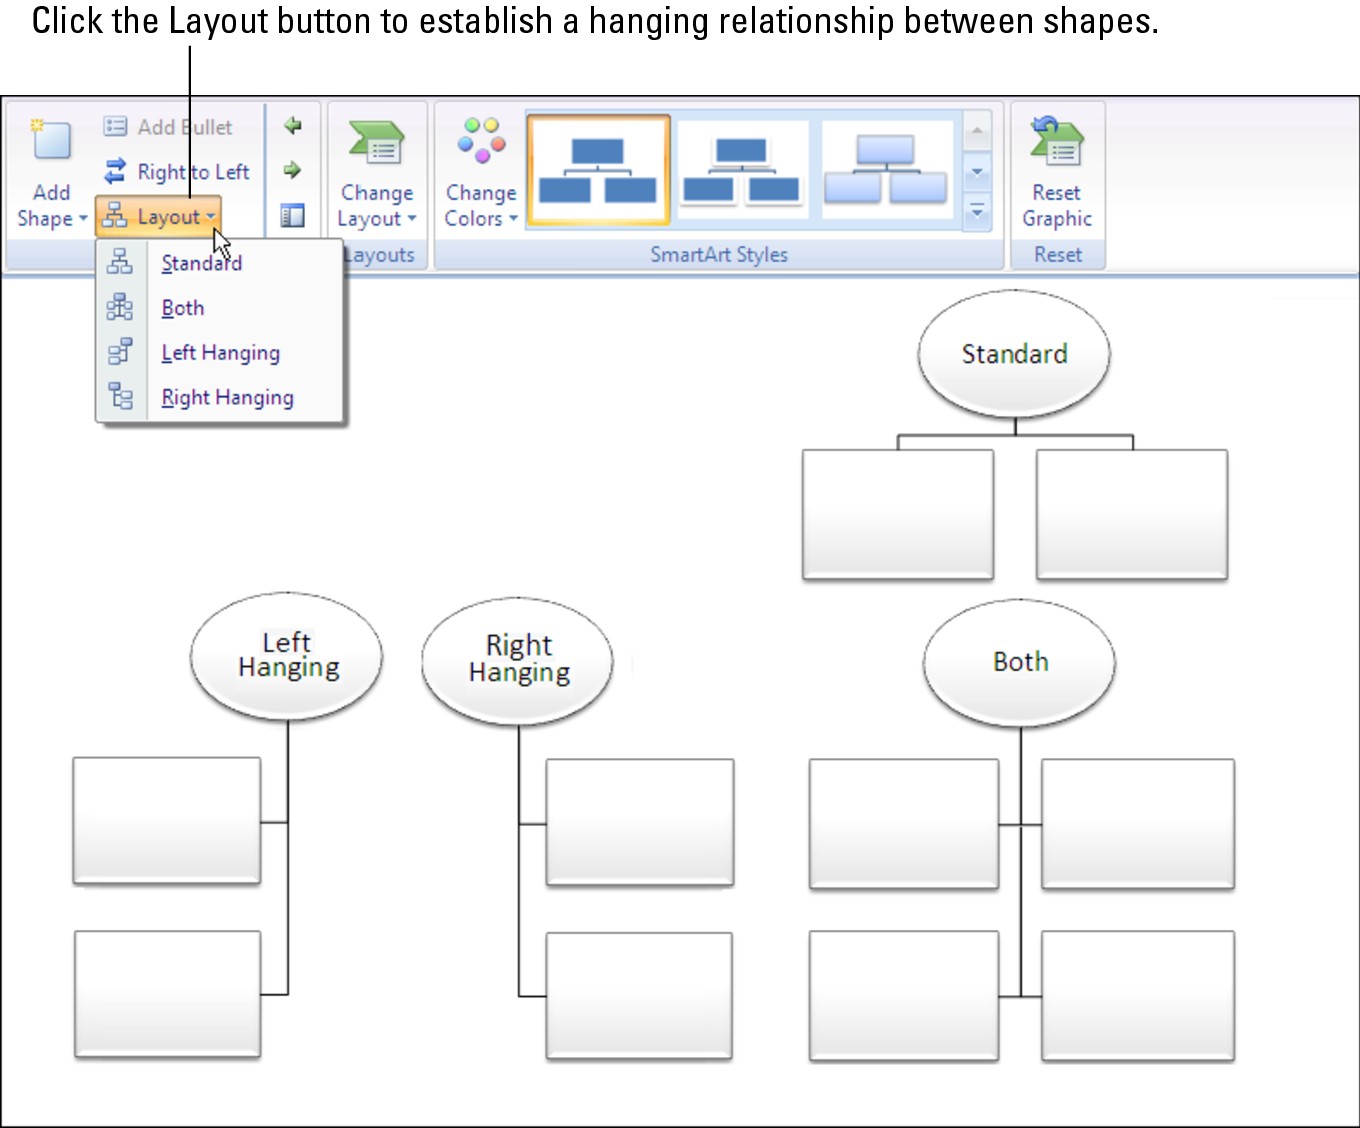
An Organization Chart offers many opportunities for connecting shapes. The shapes can branch out from one another in four directions as well as appear to the side in the “assistant” position. When you place one shape below another shape, you can make the new shape hang so that it is joined to a line, not joined directly to the shape above it. Figure 3-5 shows what hanging shapes look like. Compare the standard connection to the hanging connections — Left Hanging, Right Hanging, and Both. Hanging shapes connect to a line that drops, or hangs, from a shape above.
To add a shape to an Organization Chart diagram, decide where you want the shape to go, and if you want to place one shape below another, decide whether you want a hanging or standard relationship. These pages explain how to add shapes and create hanging relationships between one shape and the shapes below it.
Adding a shape
Follow these steps to add a shape to an Organization Chart diagram:
1. Select the shape to which you will add a shape.
|
Figure 3-5: Ways that shapes can hang in Organization Chart diagrams. |
|
Earlier in this chapter, “Selecting a diagram shape” explains how to select shapes. As shown in Figure 3-6, shapes are surrounded by solid lines, not dotted lines, when you select them properly.
2. Choose an Add Shape command.
You can choose Add Shape commands in two ways:
• On the (SmartArt Tools) Design tab, open the drop-down list on the Add Shape button and choose an Add Shape command (see Figure 3-6).
• Right-click the shape you selected, choose Add Shape on the shortcut menu, and then choose an Add Shape command on the submenu.
Figure 3-6 demonstrates what the Add Shape commands do. Notice that Add Shape Before places a new shape to the left of the shape you selected; Add Shape After places a new shape to the right.
Be careful about choosing the Add Shape Above command. This command effectively bumps the shape you selected to a lower level in order to make room for the new shape. In effect, you demote one shape when you place a new shape above it.
|
Figure 3-6: Adding a shape to an Organization Chart diagram. |

|
The Add Assistant command creates an intermediary shape between two levels, as shown in Figure 3-6. The command is called “Add Assistant” because assistants don’t have a ranking in organization charts. Executive assistants, secretaries, and the like are attached to the bigwigs of the organization and don’t have a real place in the hierarchy, although everyone knows they do most of the work.
Hanging a shape below another shape
Besides the standard relationship between shapes above and below one another, you can create a hanging relationship. Earlier in this chapter, Figure 3-5 shows the three kinds of hanging relationships — Both, Left Hanging, and Right Hanging. In a hanging relationship, the line hangs from a shape, and subordinate shapes are connected to the line.
You can create a hanging relationship between shapes before or after you create the subordinate shapes. Follow these steps to create a hanging relationship:
1. Select the shape to which other shapes will hang or are hanging.
2. Select the (SmartArt Tools) Design tab.

3. Click the Layout button (refer to Figure 3-5).
4. Select an option on the drop-down list — Both, Left Hanging, or Right Hanging.
The Standard option on the drop-down list is for creating a standard relationship, not a hanging relationship.
Promoting and demoting shapes in hierarchy diagrams
Shapes in hierarchy diagrams are ranked by level. If a shape is on the wrong level, you can move it higher or lower in the diagram by clicking the Promote or Demote button on the (SmartArt Tools) Design tab. Promoting and demoting shapes can turn into a donnybrook if you aren’t careful. If the shapes being promoted or demoted are attached to subordinate shapes, the subordinate shapes are promoted or demoted as well. This feature can have unforeseen and sometimes horrendous consequences.
Follow these steps to promote or demote a shape (and its subordinates) in a hierarchy diagram:
1. Select the shape that needs a change of rank.
You can select more than one shape by Ctrl+clicking.
2. Select the (SmartArt Tools) Design tab.


Do you like what you see? You may have to click the Undo button and start all over.
Handling the Text on Diagram Shapes
When you create a new diagram, “[Text]” (the word Text enclosed in brackets) appears on shapes. Your job is to replace this generic placeholder word with something more meaningful and less bland. These pages explain how to enter text and bulleted lists on shapes. You also discover how to enter text on shapes you create. These shapes don’t come with the generic [Text], which makes entering the text slightly problematic.
Entering text on a shape
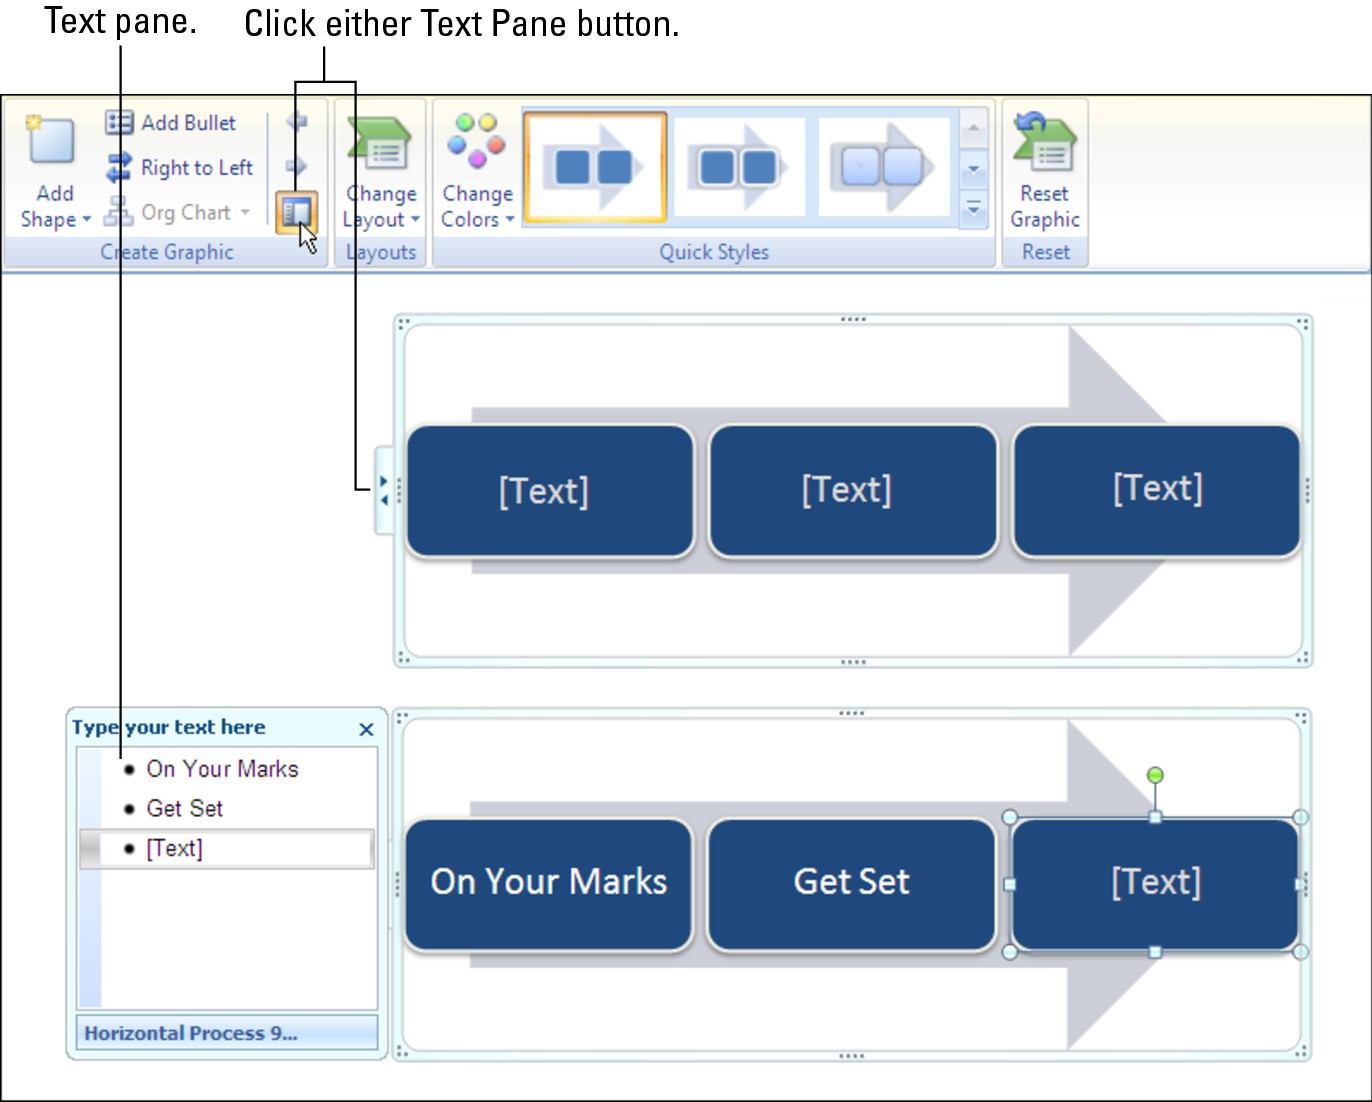
You can click in the middle of a shape and start typing to enter text, but PowerPoint also offers the Text pane, which gives you another, simpler way to enter text. Follow these steps to open the Text pane and enter the text there:
1. Select your diagram.
2. Select the (SmartArt Tools) Design tab.

3. Either click the Text Pane button or click the same button to the left of the diagram.
Figure 3-7 shows the two places you can click to open the Text pane. The Text pane opens to the left of the diagram, as shown on the bottom of Figure 3-7.
|
Figure 3-7: The easiest way to enter text is on the Text pane. |
|
4. Enter the text in the Text pane.
As you enter text, the diagram shapes are selected so that you know which shape you’re entering text on.
5. Click the Close button (the X) in the Text pane to close the pane.
If you make a spelling error, click the Text Pane button to reopen the Text pane and correct it.
PowerPoint shrinks the text in diagrams as you enter more text so that all text is the same size. If you want to make the text larger or smaller in one shape, see “Changing fonts and font sizes on shapes,” later in this chapter.
Entering text in a diagram shape you added
Diagram shapes you add on your own don’t come with the generic [Text] placeholder. Select your newly minted shape and do one of the following to enter text on it:
Click the Text Pane button to display the Text pane (refer to Figure 3-7). You see a blank place in the Text pane for entering text for your new shape. Enter the text in the Text pane.
Click in the diagram shape and start typing. That’s all there is to it.
Entering bulleted lists on diagram shapes
Some diagram shapes have built-in bulleted lists, but no matter — whether a shape is prepared to be bulleted or not, you can enter bullets in a diagram shape. Here are instructions for entering and removing bullets:

Entering a bulleted list: Select the shape that needs bullets, and on the (SmartArt Tools) Design tab, click the Add Bullet button. When you click inside the shape, the first bullet appears. Either enter the bulleted items directly into the shape (pressing Enter as you type each entry) or click the Text Pane button to open the Text pane (refer to Figure 3-7) and enter bullets there.
Removing bulleted items: Click before the first bulleted entry and keep pressing the Delete key until you have removed all the bulleted items. You can also start in the Text pane (refer to Figure 3-7) and press the Delete key there until you’ve removed the bulleted items, or drag to select several bulleted items and then press Delete.
Turning a bulleted list into a diagram
Suppose you’re puttering along in a PowerPoint presentation, gazing at the text, when suddenly it strikes you — a bulleted list in a text frame or text box would work much better as a diagram. For those occasions, PowerPoint provides the Convert to SmartArt button. By clicking this button, you can turn the text in a text frame or text box into a diagram. If the text frame or box contains a bulleted list, each bulleted item becomes a diagram shape.
Follow these steps to turn a text frame or text box into a diagram:
1. Select the text frame or text box.
2. Click the Home tab.
3. Click the Convert to SmartArt button.
You see a drop-down list with basic diagram choices.
4. Either select a diagram on the list or choose More SmartArt Graphics to open the Choose a SmartArt Graphic dialog box and select a diagram there.

Changing a Diagram’s Direction
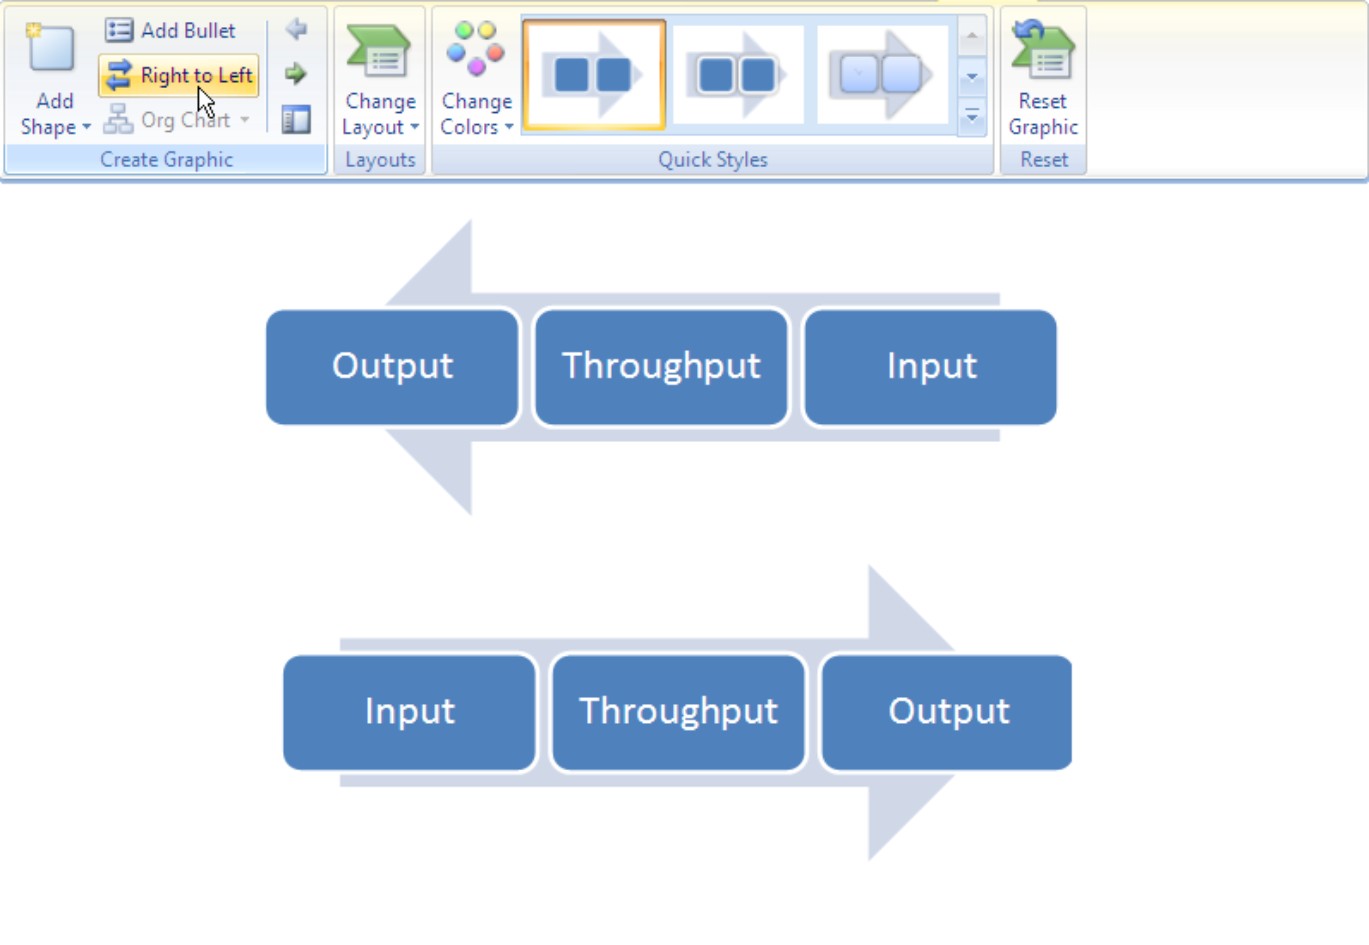
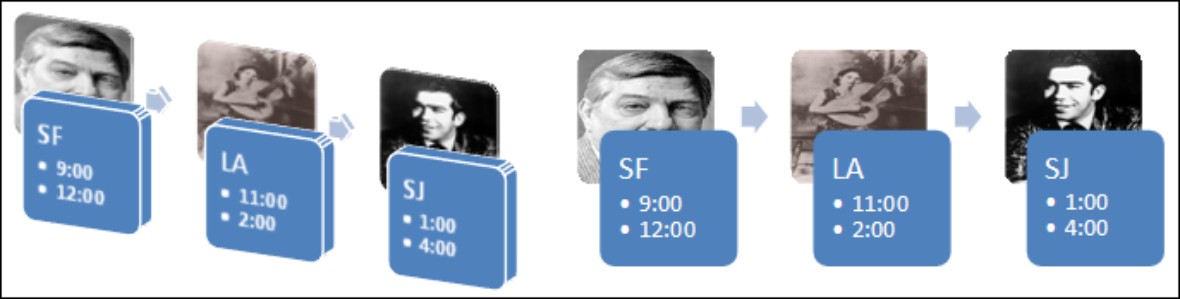
As long as your diagram is horizontally oriented, you can change its direction. As shown in Figure 3-8, you can flip it over such that the rightmost shape in your diagram becomes the leftmost shape, and what was the leftmost shape becomes the rightmost shape. If there are arrows in your diagram, the arrows point the opposite direction after you flip the diagram. You can’t flip vertically oriented diagrams this way. Sorry, but diagrams that run north to south, not west to east, can’t be rolled over.
Follow these steps to flip a horizontally oriented diagram like the one in Figure 3-8:
1. Select the diagram.
2. Select the (SmartArt Tools) Design tab.

3. Click the Right to Left button.
If you don’t like what you see, click the button again or click the Undo button.
|
Figure 3-8: You can flip horizontal diagrams so that they run the opposite direction. |
|
Choosing a Look for Your Diagram
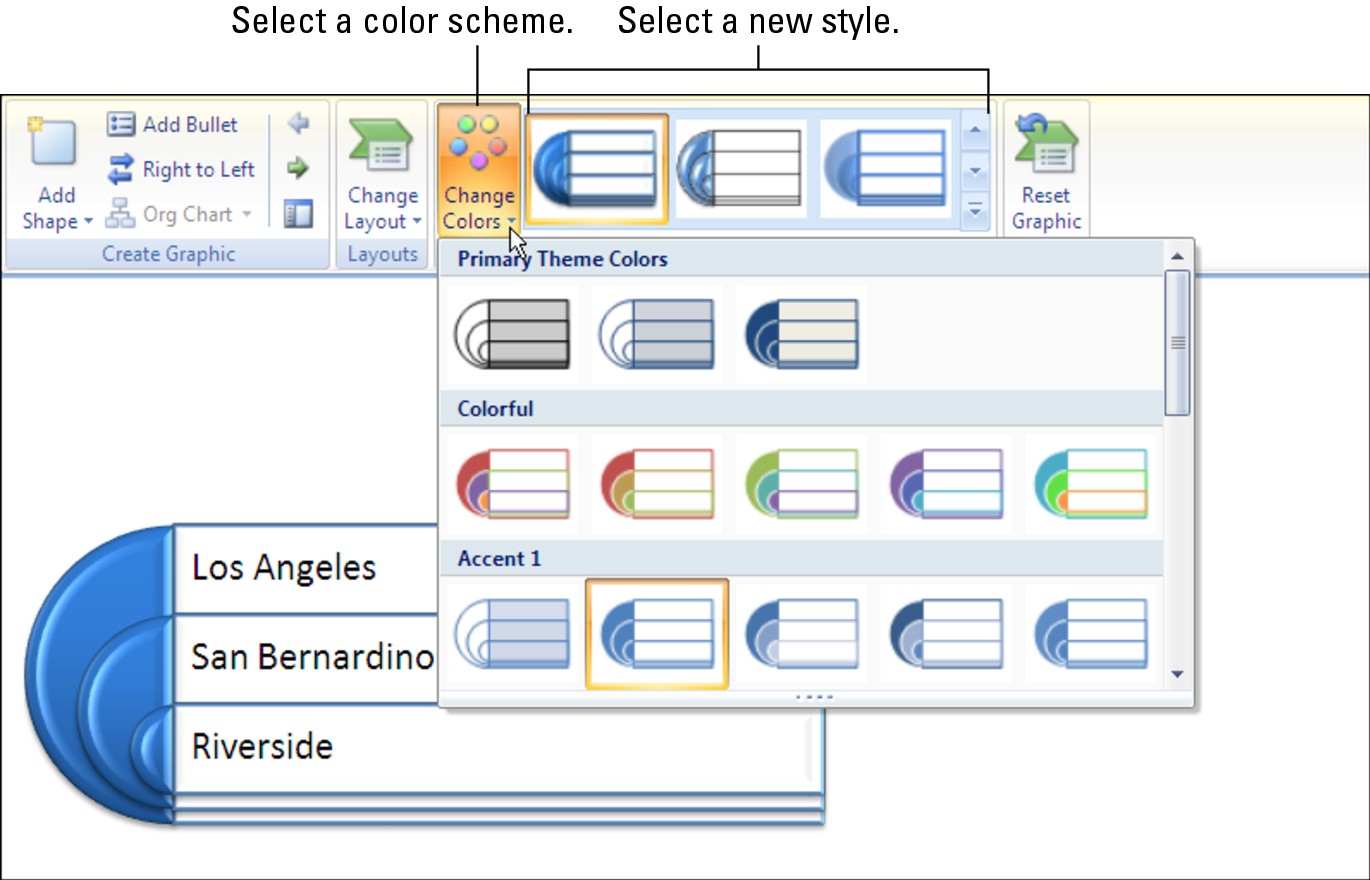
Decide how a diagram looks by starting on the (SmartArt Tools) Design tab. Starting there, you can choose a color scheme for your diagram and a 3-D or other style. Between the Change Colors drop-down list and the SmartArt Styles gallery, you can find a combination of options that presents your diagram in the best light:

Change Colors drop-down list: Offers color schemes for your diagram, as shown in Figure 3-9. Point at a few options to “live-preview” them.
SmartArt Styles gallery: Offers simple and 3-D variations on the diagram.

|
Figure 3-9: Experiment freely with the Change Colors and SmartArt Styles gallery options. |
|
Changing the Appearance of Diagram Shapes
To call attention to one part of a diagram, you can change the appearance of a shape and make it stand out. Any part of a diagram that is different from the other parts naturally gets more attention. To change the appearance of a shape, consider changing its size or color, exchanging one shape for another, or changing the font and font size of the text. These topics are covered in the following pages.
Changing the size of a diagram shape
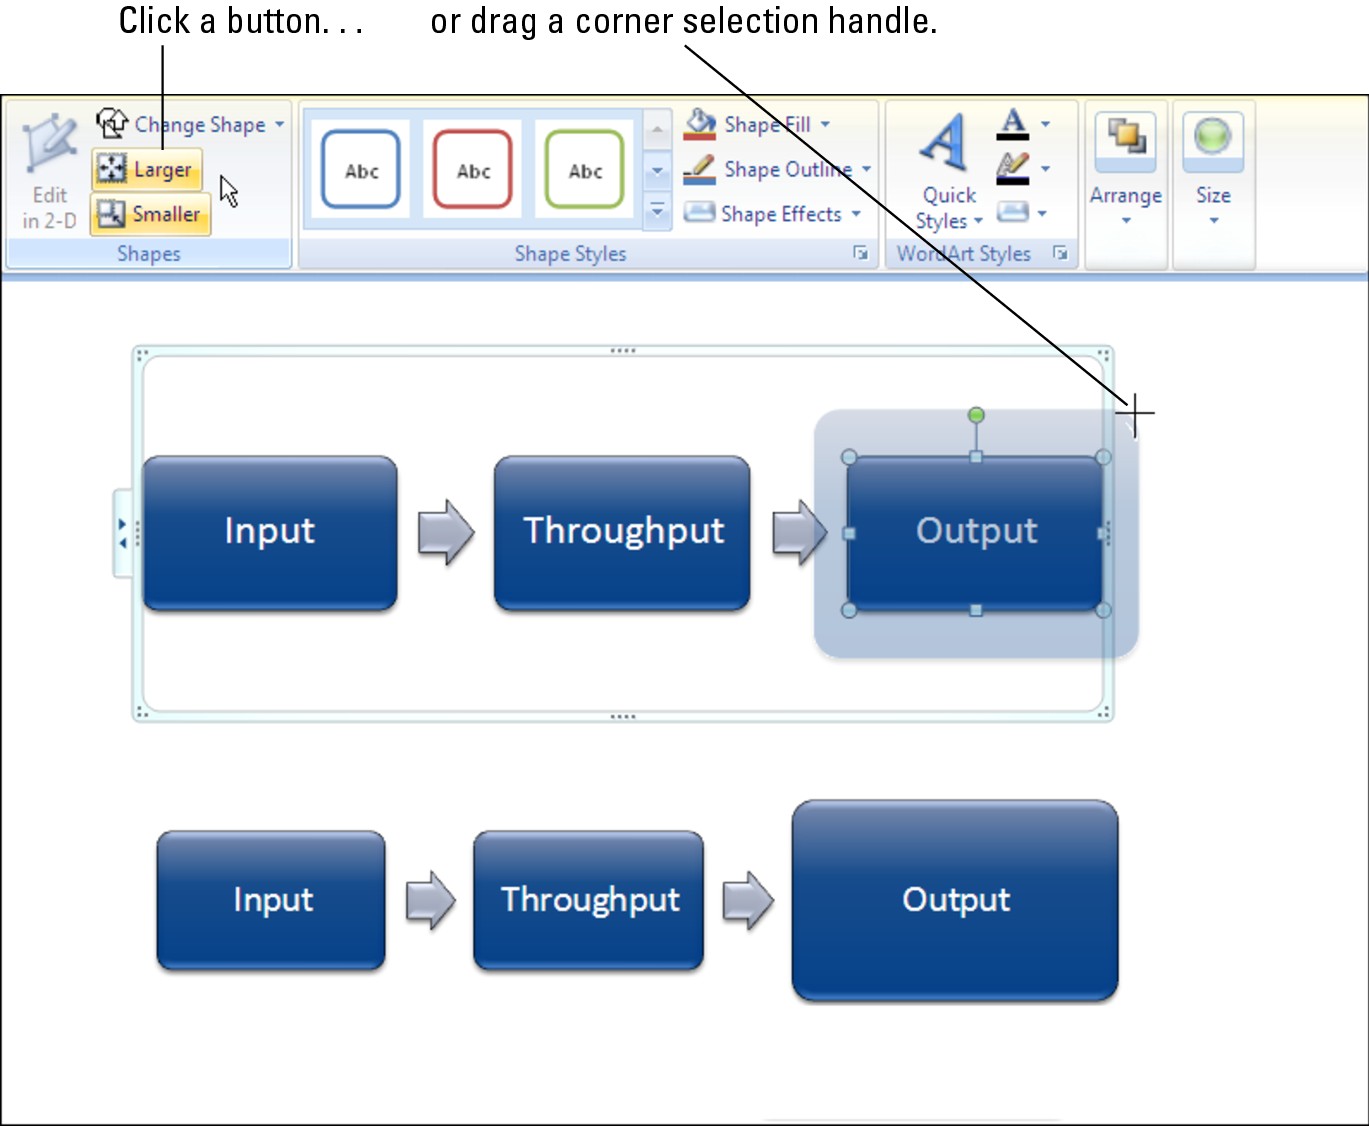
A shape that is larger than other shapes in a diagram gets the attention of the audience. Select your shape and use one of these techniques to enlarge or shrink it:

On the (SmartArt Tools) Format tab, click the Larger or Smaller button as many times as necessary to make the shape the right size.

Move the pointer over a corner selection handle, and when the pointer changes to a two-headed arrow, click and start dragging. As shown in Figure 3-10, PowerPoint shows how large the shape will be when you release the mouse button.
|
Figure 3-10: Enlarge a shape to call attention to it. |
|
Notice that the text inside the shape remains the same size although the shape is larger. To change the size of the text in a shape, see “Changing fonts and font sizes on shapes,” later in this chapter.
To return a diagram shape to its original size after you’ve fooled with it, right-click the shape and choose Reset Shape or click the Reshape button on the (SmartArt Tools) Design tab.
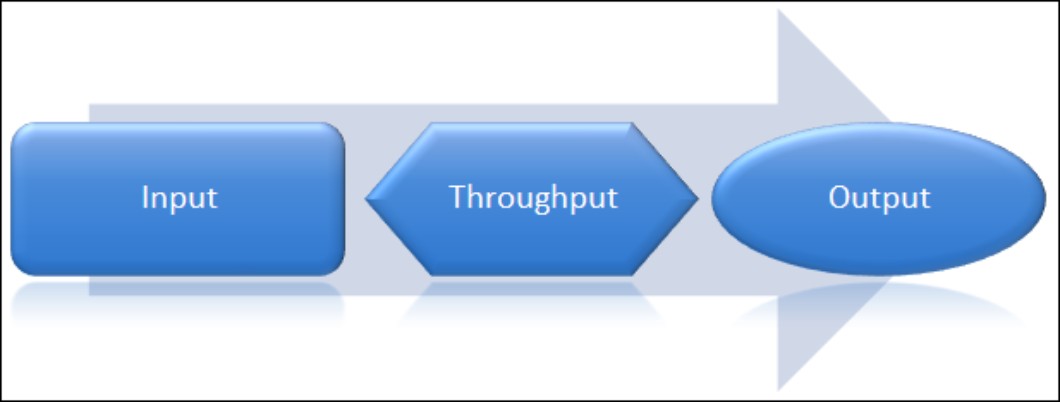
Exchanging one shape for another
Another way to call attention to an important part of a diagram is to change shapes, as shown in Figure 3-11. Rather than a conventional shape, use an oval, block arrow, or star. You can substitute a shape in the Shapes gallery for any diagram shape (Book IV, Chapter 2 explores the Shapes gallery). To exchange one shape for another in a diagram, select the shape and use one of these techniques:

On the (SmartArt Tools) Format tab, click the Change Shape button and select a shape in the Shapes gallery.
Right-click the shape, choose Change Shape on the shortcut menu, and select a shape on the submenu.
|
Figure 3-11: Introducing a different shape in a diagram calls attention to the shape. |
|
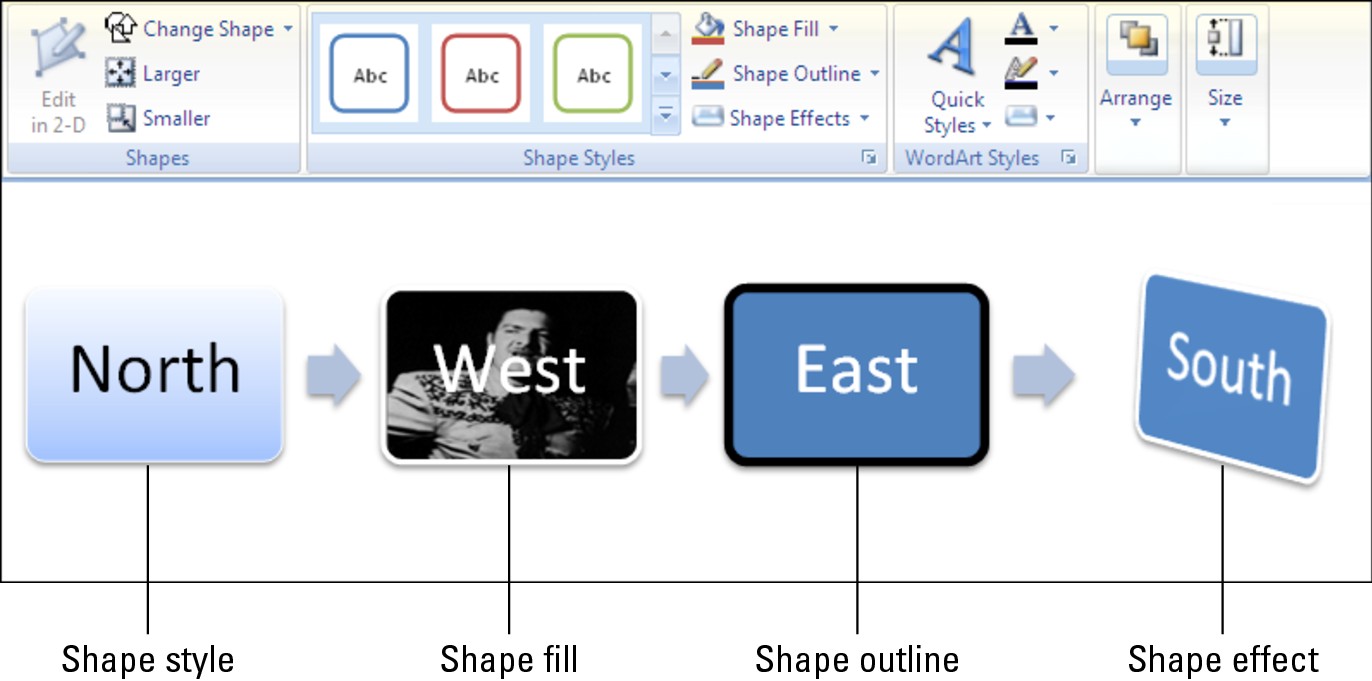
Changing a shape’s color, fill, or outline
Yet another way to call attention to a shape is to change its color, fill, or outline border. Select a shape and go to the (SmartArt Tools) Format tab, as shown in Figure 3-12, to change a shape’s color, fill, or outline.
Restyling a shape: Select an option on the Shape Styles gallery to give a shape a makeover.

Filling a shape with a new color: Click the Shape Fill button and make a choice on the drop-down list to select a color, picture, two-color gradient, or texture for the shape. Book IV, Chapter 2 explains how to fill an object with a color, picture, or texture.

Changing the outline: Click the Shape Outline button and choose a color and weight for the shape’s border on the drop-down list.

Applying a shape effect: Click the Shape Effects button to select a shape effect for your shape. Book IV, Chapter 2 explains what shape effects are and how to apply them.
|
Figure 3-12: Ways to make a diagram shape stand out. |
|
Editing 3-D diagrams in 2-D

Three-dimensional diagrams are wonderful. You can impress your friends with a 3-D diagram. All you have to do to turn a mundane two-dimensional diagram into a three-dimensional showpiece is go to the (SmartArt Tools) Design tab, open the SmartArt Styles gallery, and select a 3-D option.
Unfortunately, editing a 3-D diagram can be difficult. The shapes and text are all aslant. It’s hard to tell where to click or what to drag when you’re editing a 3-D diagram.
Fortunately, you can get around the problem of editing a 3-D diagram by temporarily displaying it in two dimensions. On the (SmartArt Tools) Format tab, click the Edit in 2-D button to temporarily render a 3-D graphic in two dimensions. Click the button a second time to get the third dimension back.
Changing fonts and font sizes on shapes
To make a diagram shape stand out, try changing the font and font size of the text on the diagram. Before you change fonts and font sizes, however, you should know that changing fonts in a shape effectively disconnects the shape from the other shapes in the diagram. Normally when you remove or add a shape in a diagram, the other shapes change size, and text on the shapes changes size accordingly. But when you change the font size on one shape, the text on the shape no longer changes along with its brethren.
Follow these steps to choose a different font or font size for the text on a diagram shape:
1. Select the text.
2. Click the Home tab.
3. Open the Font Size menu and select a font size.
4. Open the Font menu and choose a font.
Creating a Diagram from Scratch
If you have the skill and the wherewithal, you can create a diagram from scratch by piecing together shapes, arrows, and connectors on the Insert tab. The diagram in Figure 3-13, for example, was made not from SmartArt graphics but from shapes, arrows, and connectors. Book IV, Chapter 1 explains how to draw shapes and lines between shapes; Book IV, Chapter 2 explains how to give lines and shapes different colors and borders. You can enter text on any shape merely by clicking inside it and wiggling your fingers over the keyboard.
|
Figure 3-13: A homegrown diagram made without SmartArt graphics. |

|
Making a diagram from scratch has some advantages. You can draw the connectors any which way. Lines can cross the diagram chaotically. You can include text boxes as well as shapes (the diagram in Figure 3-13 has four text boxes). Don’t hesitate to fashion your own diagrams when a presentation calls for it.
Writing Equations with the Equation Editor
Use the Equation Editor to place mathematical equations and expressions on slides. The Equation Editor offers tools for entering equations. The equations you draw are embedded objects. Because the equations are embedded, you can edit them using Equation Editor commands without leaving PowerPoint. (Book VII, Chapter 4 explains embedded objects in detail.)
Launching the Equation Editor
The Equation Editor is a program unto itself. Follow these steps to start the Equation Editor and begin constructing an equation or expression on a PowerPoint slide:
1. Click the Insert tab.

2. Click the Insert Object button.
You see the Insert Object dialog box.
3. Select Microsoft Equation 3.0 in the Object Type list.
4. Click OK.
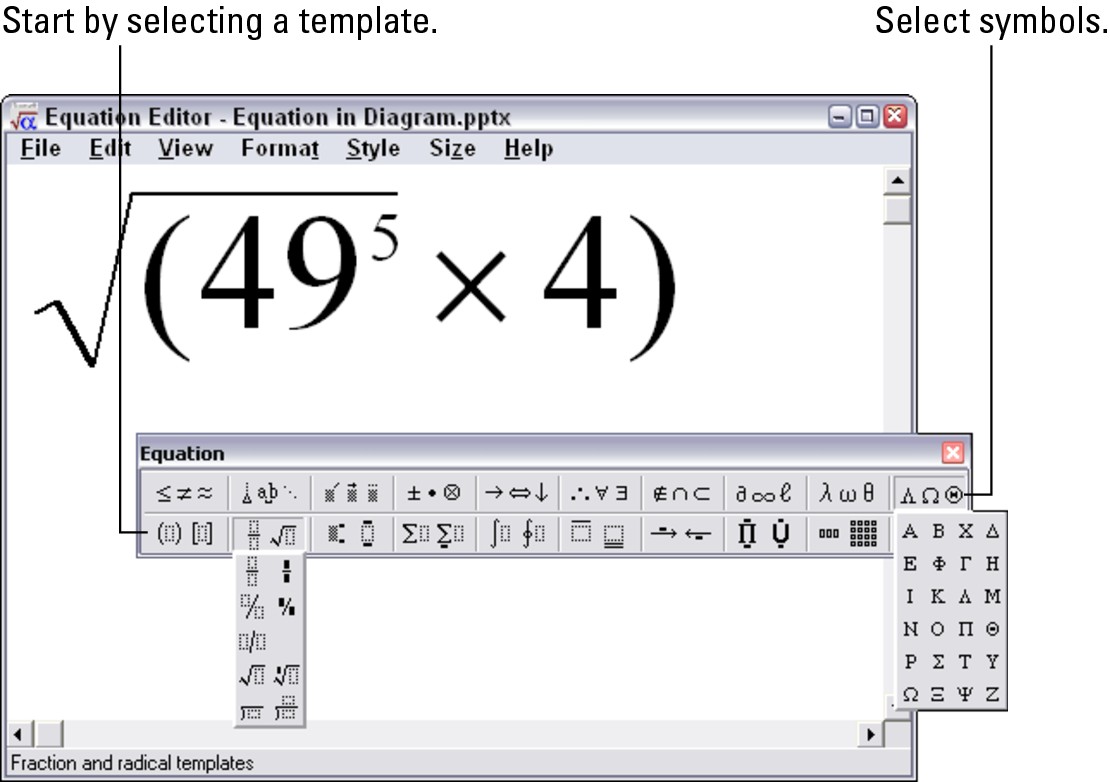
The Equation Editor opens on-screen, as shown in Figure 3-14. You see the Equation toolbar, the menu bar, and a frame in which to write an expression (if you don’t see the Equation toolbar, choose View⇒Toolbar).
|
Figure 3-14: The Equation Editor in action. |
|
Templates and slots
Here are the basic tasks for constructing an equation:
Choosing a template: Start by choosing a template on the bottom row of the Equation toolbar (refer to Figure 3-14). In Equation Editor terminology, a template is a frame for entering part of an equation. In the slots provided by the template, you either type numbers or symbols on your keyboard or choose symbols from the top half of the Equation toolbar.
Filling in the slots: Each template includes one or more slots, the places where you enter a number or symbol. Dashed-line boxes indicate where the slots are. When you open a template drop-down list on the Equation toolbar and look at the options, you can see where slots are in the templates. Slots are marked by small dashed-line boxes.
The Equation Editor italicizes letters when you enter them to conform to mathematical typesetting conventions, but if you want to enter real text in an equation — a name or word of explanation, perhaps — you have to switch from Math style to Text style. You can do so by way of the Style menu. Similarly, to enter Greek characters, characters that represent matrix or vector quantities, or abbreviations for standard mathematical functions, choose the appropriate option on the Style menu.
Drawing equations
Now that you are acquainted with the Equation Editor, here are instructions for drawing equations:
Going from place to place: Besides clicking here or there, you can go forward from slot to slot by pressing the Tab key; press Shift+Tab to move backward.
Entering symbols: The top row of the Equation toolbar offers symbols. To choose a symbol, click a button on the toolbar and then make your choice from the drop-down list that appears (refer to Figure 3-14).
Deleting a template: Drag the mouse over the template to select it and then press the Delete key, or choose Edit⇒Clear. You can’t delete the first template, the one that appears automatically when you start the Equation Editor.
Changing the size of part of an equation: Select a part of the equation and make a choice from the Size menu or choose Size⇒Other and enter a point size in the Other Size dialog box.
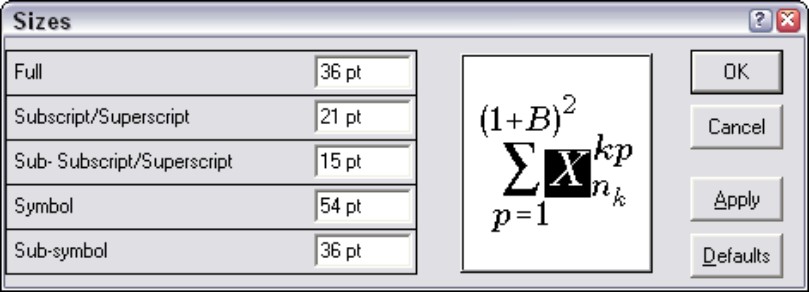
Changing the size of the entire equation: Choose Size⇒Define to open the Sizes dialog box shown in Figure 3-15. Parts of equations fall into one of five categories. Change sizes in the five categories and you change the size of all parts of your equation. (If you regret changing sizes, return to the Sizes dialog box and click the Defaults button.)
|
Figure 3-15: Changing the size of an entire equation. |
|
The easiest way to change the size of the entire equation is to wait until you are finished constructing it. When you return to PowerPoint, the equation appears in an object box. Drag a corner handle of the box to enlarge or shrink the equation.
Adjusting the position of parts of an equation: Nudge parts of an equation in one direction or the other by selecting them and pressing Ctrl and an arrow key. You can also choose an alignment command from the Format menu.
Including text in an equation: To write a word or two of explanation in an equation, do so in the Text style. To change to the Text style, choose Style⇒Text (or press Ctrl+Shift+E) and type the words. Be sure to choose Style⇒Math (or press Ctrl+Shift+=) to go back to entering numbers and symbols.