Chapter 3: Decorating Slides with Graphics and Photographs
In This Chapter
 Understanding the different graphics file formats
Looking at copyright issues
Placing graphics on slides and changing graphics’ appearance
Compressing graphics
Recoloring, cropping, and altering graphic’s brightness and contrast
Downloading graphics from a scanner or digital camera
Using a graphic as the background in slides
Creating a photo album
Handling graphics with Office Picture Manager
A picture, so they say, is worth a thousand words. Whether it’s worth a thousand words or merely 950 is debatable. What is certain is that visuals help people remember things. A carefully chosen image in a presentation may help audience members remember or understand what your presentation is about. The image reinforces in their minds the ideas that you are trying to put across.
This chapter explains how you can make pictures — photographs and graphics — a part of your PowerPoint presentations. It looks into graphic file formats, copyrights, and other issues pertaining to graphics, as well as how to touch up graphics in PowerPoint and an auxiliary program called Office Picture Manager. You find out how to compress graphics, use them in the background, and compile them in a photo album as well.
By the way, the next chapter looks at another way to decorate PowerPoint presentations with images — by using clip art.
All about Picture File Formats
Graphics and photographs come in many different file formats, and as far as PowerPoint is concerned, some are better than others. These pages explain what you need to know about graphic files to use them wisely in a PowerPoint presentation. Here, you find out what bitmap and vector graphics are, what resolution and color depth are, and how graphic files are compressed.
Bitmap and vector graphics
All graphic images fall into either the bitmap or vector category. A bitmap graphic is composed of thousands upon thousands of tiny dots called pixels that, taken together, form an image (the term “pixel” comes from “picture element”). A vector graphic is drawn with the aid of computer instructions that describe the shape and dimension of each line, curve, circle, and so on.
As far as PowerPoint presentations are concerned, the difference between the two formats is that vector graphics do not distort when you enlarge or shrink them, whereas bitmap graphics lose resolution when their size is changed. Furthermore, vector images do not require nearly as much disk space as bitmap graphics. Drop a few bitmap graphics in a PowerPoint presentation and soon you’re dealing with a document that is close to 750K in size and takes a long time to load.
Table 3-1 describes popular bitmap graphic formats; Table 3-2 lists popular vector graphic formats. The clip-art images that come with PowerPoint are Windows Metafile (WMF) files. The next chapter in this book explains how to handle these clip-art images.
| Extension | File Type | |
|---|---|---|
| CDR | CorelDRAW | |
| CGM | Computer Graphics Metafile | |
| DXF | AutoCAD Format 2-D | |
| EMF | Enhanced Windows Metafile | |
| EMZ | Windows Enhanced Metafile | |
| EPS | Encapsulated PostScript | |
| PCT | Macintosh PICT | |
| WMF | Windows Metafile | |
| WPG | WordPerfect Graphics |
Resolution
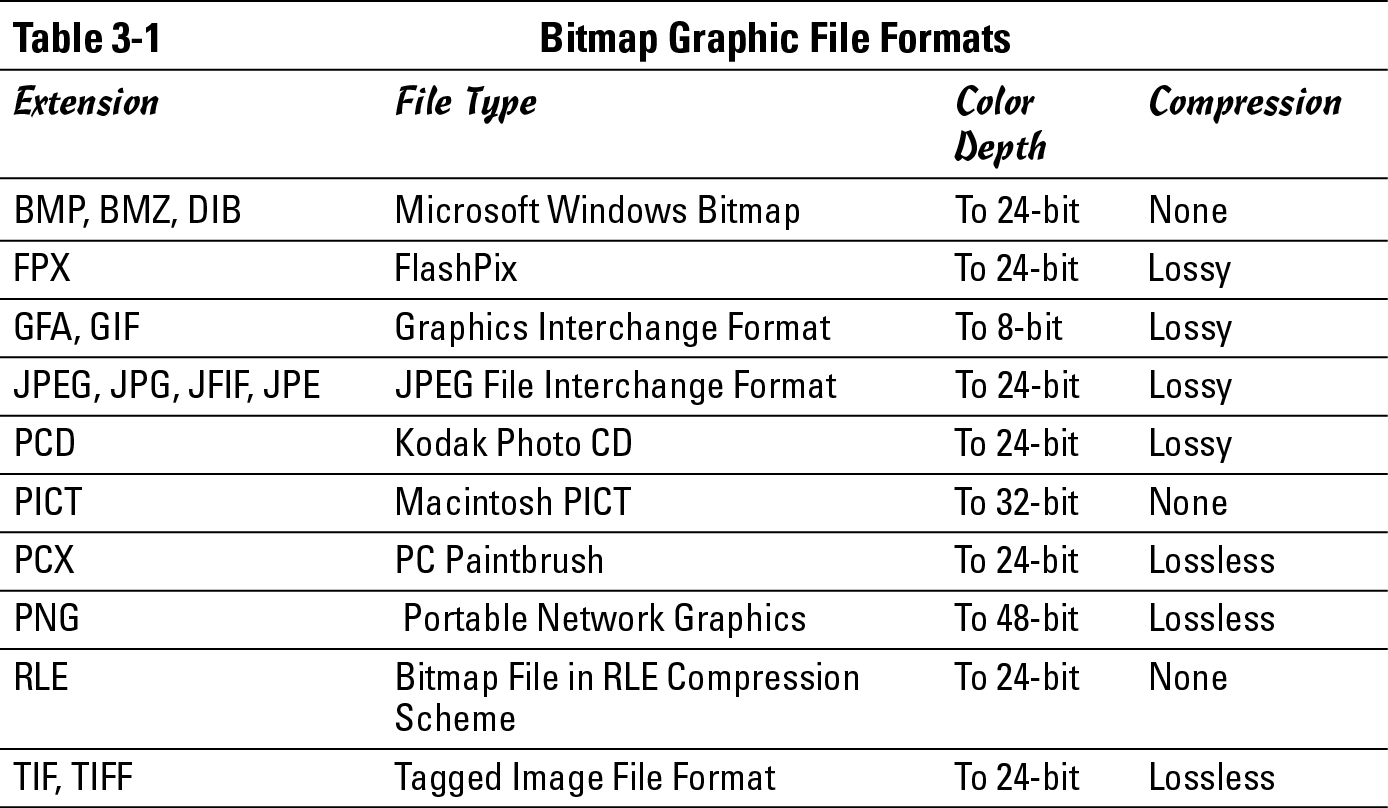
Resolution refers to how many pixels comprise a bitmap image. The higher the resolution, the clearer the image. Resolution is measured in dots per inch (dpi), sometimes called pixels per inch (ppi). Images with more dots — or pixels — per inch are clearer and display more fineness of detail. When you scan an image, your scanner permits you to choose a dots-per-inch setting.
High-resolution images look better but require more disk space than low-resolution images. Figure 3-1 illustrates the difference between a high-resolution and low-resolution photograph.
|
Figure 3-1: A high-resolution photo (left) and the same photo at low resolution (right). |
|
Compression
Compression refers to a mathematical algorithm by which bitmap graphic files can be made smaller. In effect, compression enables your computer to store a bitmap graphic with less disk space. Some bitmap graphic types can’t be compressed; other bitmap graphic types are compressed using either lossless or lossy compression:
 Lossless compression: To maintain the picture’s integrity, the same number of pixels are stored in the compressed file as in the original. Because the pixels remain intact, you can change the size of a file that has undergone lossless compression without losing picture quality.
Lossy compression: Without regard for the picture’s integrity, pixel data in the original picture is lost during compression. Therefore, if you try to enlarge a picture that has undergone lossy compression, the picture loses quality.
Color depth
Color depth refers to the number of colors that can be displayed in a graphic file. The larger the color depth, the larger the number of colors that can be displayed, the richer the graphic looks, and the larger its file size is. Color depth is measured in bits. To get technical on you, color depth is measured in the number of bits that are needed to describe each pixel’s color in the image. A bit, or “binary digit,” is the smallest unit of data measurement in computing. These are the color-depth measurements:
To look like photographs and not cartoons, photographs require a color depth of at least 16 bits. Sometimes color depth is described in terms of a color palette. For example, a graphic format with an 8-bit color depth is said to have a 256-color palette.
Choosing File Formats for Graphics
.jpg)
The trick is to find a balance between high-quality, high-resolution graphics and the need to load presentations quickly. Here are some tips for choosing graphic file formats:
Consider sticking with vector graphics if you’re including graphics in your presentation strictly for decoration purposes. As the next chapter explains, PowerPoint offers vector clip-art images. These images are easy to come by, don’t require very much disk space, and can be edited inside PowerPoint.
For photographs, make JPEG your first choice for graphics. JPEG images have a fairly high resolution. If you intend to transfer your PowerPoint presentation to the Internet, you can’t go wrong with JPEGs; they are the de facto photograph standard on the Internet.
If you’re dealing with black-and-white photos or resolution doesn’t matter, use GIF files. These files eat up the least amount of disk space.
The All-Important Copyright Issue
To save any image on the Internet to your computer, all you have to do is right-click it and choose Save Picture As. By starting from Google Image Search (www.images.google.com), you can scour the Internet for any image you need for a PowerPoint presentation. Never before has it been easier to obtain images for your own use.
Still, obtaining images and using them legally are two different matters. Would it surprise you to learn that the vast majority of graphics can’t be used without the owner’s permission? The copyright laws have a “fair use” provision for borrowing written words. You can quote others’ words as long as you cite the author and work and you don’t quote passages longer than 250 to a thousand words (the “fair use” provision is vague on this point). The copyright law about using graphics is quite straightforward. Unless you have the owner’s permission, you can’t legally use a graphic.
Sometimes it’s hard to tell who owns a graphic. The artist or photographer (or his or her estate) doesn’t necessarily own the copyright, because artists sometimes relinquish their copyrights when they create works for hire. The only way to get permission to use a graphic is to ask. Contact the owner of the Web site with the image you want, the publisher if the image is in a book, or the museum if the work is owned by a museum. You will be asked to write a letter describing precisely how you intend to use the image, reproduce it, and distribute it. Your letter should also say how long you intend to use it and at what size you will reproduce it.
Inserting a Graphic on a Slide
After you’ve weighed the merits of different kinds of graphics and decided which one is best for your presentation, you can insert it. Inserting a graphic is as simple as choosing it in the Insert Picture dialog box. (By the way, you can insert many graphics simultaneously in a Power Point presentation by using the Photo Album feature. See “Putting Together a Photo Album,” later in this chapter.)
Follow these steps to insert a graphic on a slide:
1. Click the Insert tab.
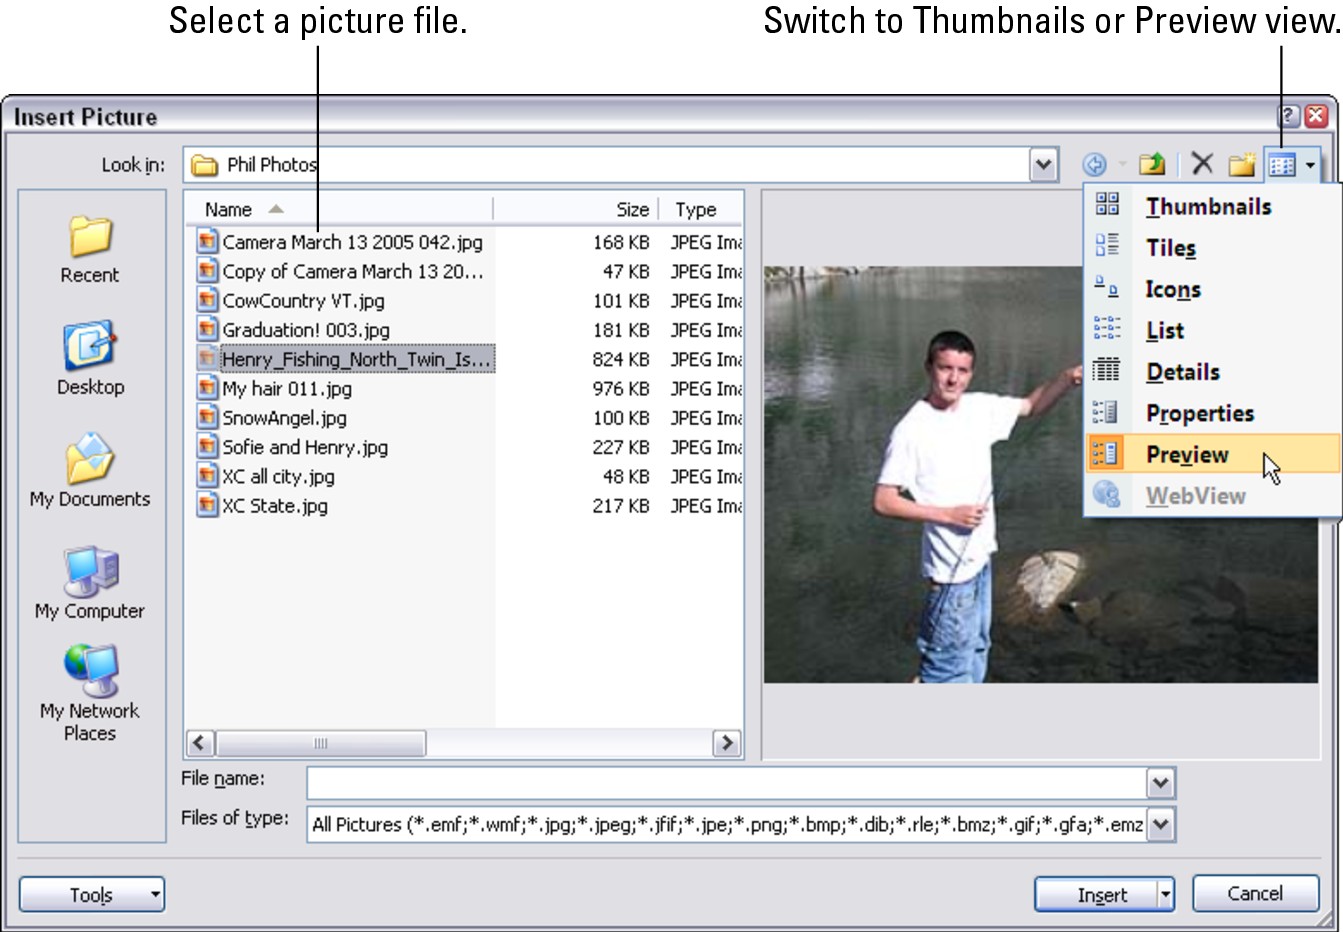
2. Open the Insert Picture dialog box, shown in Figure 3-2.
|
Figure 3-2: You can preview a picture file before you insert it. |
|
PowerPoint offers two ways to open this dialog box:

• Click the Picture icon if you want to insert the graphic in a content placeholder frame.

• Click the Insert Picture from File button.
3. Select a file in the Insert Picture dialog box.
As Figure 3-2 shows, you can open the drop-down list on the Views button and choose Preview to see what the graphic looks like before you import it. Thumbnails view can also be a help because it gives you a glimpse of several different files.
You can open the Files of Type drop-down list and choose a file type to locate files of a certain type in the dialog box.
4. Click the Insert button.
Select the (Picture Tools) Format tab to see all the different ways you can manipulate a graphic after you insert it. After a graphic lands on a slide, it becomes an object. The previous chapter explains how to manipulate objects — how to move them, change their sizes, and change their borders. The following pages look into various ways to change the appearance of graphics.
Touching Up a Graphic
Every graphic in a PowerPoint presentation can be a collaboration, not the work of a single artist. On the (Picture Tools) Format tab, you can find commands for recoloring, changing the brightness, and changing the contrast of a graphic. You can collaborate with the original artist and create something new. You can also crop an image — that is, cut off part of it.

Changing a graphic’s brightness and contrast
Figure 3-3 shows a graphic that has been made over several times with the Brightness and Contrast commands. Select a graphic, go to the (Picture Tools) Format tab, and experiment with the Brightness and Contrast commands to alter a graphic’s look. You’ll find the Brightness and Contrast commands in the Adjust group.
|
Figure 3-3: Experiments with the Brightness and Contrast commands. |
|

Brightness: Click the Brightness button and choose an option on the drop-down list. The positive percentage options make the picture brighter; the negative percentage options make it darker.

Contrast: Click the Contrast button and choose an option to enhance or mute the difference between light and dark colors or shades. The positive percentage options heighten the differences; the negative percentage options mute the differences.
You can also click the Picture Styles group button and adjust the Brightness and Contrast settings in the Picture category of the Format Picture dialog box.
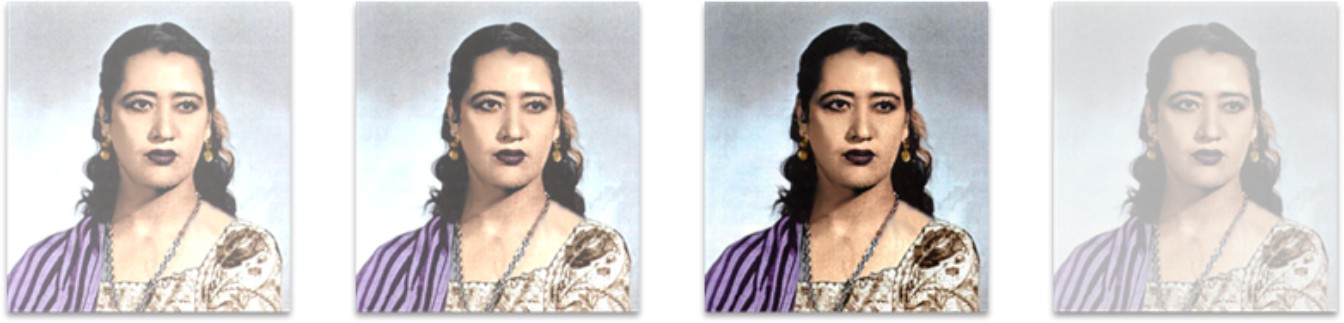
“Recoloring” a graphic
Recolor a graphic when you want to bleach it a certain color. Recoloring gives a graphic a uniform color. Recolored graphics are useful for backgrounds, as shown in Figure 3-4. Follow these steps to recolor a graphic:
1. Select the graphic.
|
Figure 3-4: This graphic was “recolored” for use with a text box. |
|
2. Click the (Picture Tools) Format tab.

3. Click the Recolor button to open the Recolor drop-down list.
4. Choose a Recolor option.
“Live previewing” really comes in handy when you’re recoloring a graphic. Move the pointer over options on the Recolor drop-down list and watch your graphic to see what happens. The Washout option creates a transparent image and is useful when creating watermarks (“Using a picture in the background,” later in this chapter, explains watermarks). Choose the More Variations option to open a submenu with many color options.
Another way to bleach out a graphic is to change its transparency. Book IV, Chapter 2 explains how to do that.
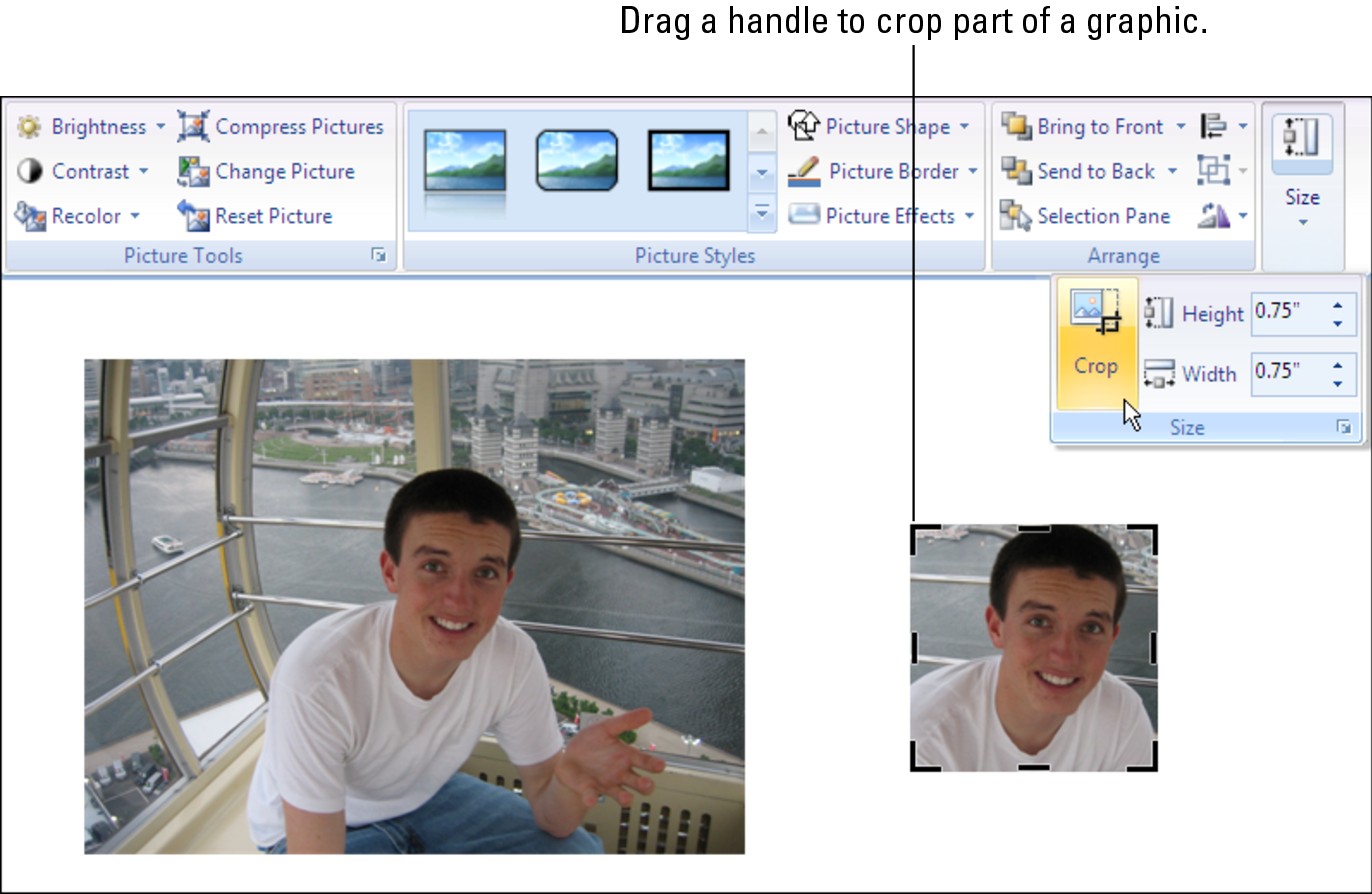
Cropping off part of a graphic
Cropping means to cut off part of a graphic. I’m afraid you can’t use PowerPoint’s cropping tool like a pair of scissors or X-ACTO knife to cut zigzag around the edges of a graphic or cut a hole in the middle. You can, however, cut strips from the side, top, or bottom. In Figure 3-5, the cropping tool was used to cut off all but the head of a figure to turn a portrait into a head shot.
|
Figure 3-5: You can cut off parts of a graphic with the Crop tool. |
|
Follow these steps to crop off part of a graphic:
1. Select the graphic.
2. Click the (Picture Tools) Format tab.

3. Click the Crop button.
Depending on the size of your screen, you may have to click the Size button to get to the Crop button, as shown in Figure 3-5. You see the cropping pointer, and instead of selection handles, cropping handles appear around the graphic. You see eight cropping handles, one on each side and one on each corner.
4. Drag a handle to crop start cropping.
5. Release the mouse button when only the portion of the graphic that you want is inside the dashed lines.
If you cropped too far, grab a cropping handle and drag away from the center of the image. What you cropped reappears.
Click the Crop button again or press Esc when you are finished cropping your graphic.

Compressing Graphics to Save Disk Space
By compressing graphics, you reduce their file size and consequently the file size of your presentation. Not all graphics can be compressed, as “Compression” explains earlier in this chapter, and some types of graphics lose their integrity when they are compressed. You can’t resize lossy- compressed graphics without their looking odd.
Compress graphics to make presentations load faster and make e-mail messages with PowerPoint attachments travel faster over the Internet. Compressing a graphic file reduces its points per inch (ppi) setting. Follow these steps to compress graphics:
1. Optionally, select the graphic or graphics you want to compress if you want to compress only one or two graphics.
The Compress Pictures command compresses all the graphics in a presentation unless you select graphics first.
2. Click the (Picture Tools) Format tab.

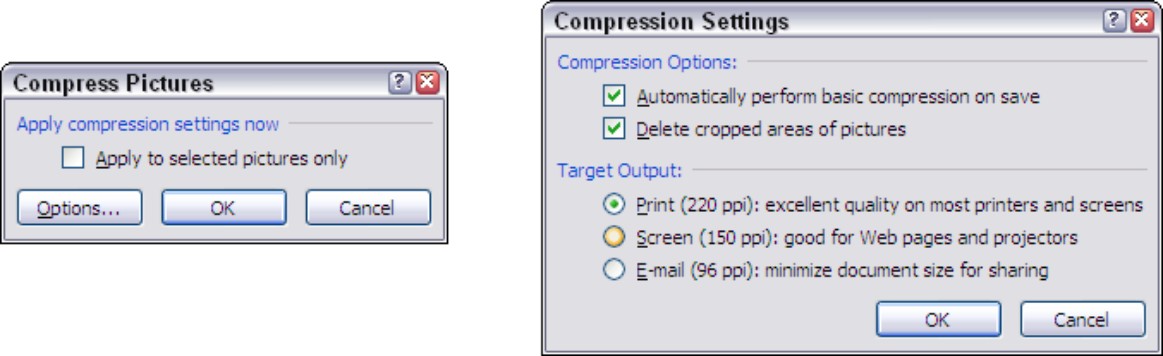
3. Click the Compress Pictures button.
You see the Compress Pictures dialog box shown on the left side of Figure 3-6.
|
Figure 3-6: Compressing graphics (left) and telling PowerPoint how to compress (right). |
|
4. Select the Apply to Selected Pictures Only check box if you selected graphics in Step 1 and you want to compress only a couple of graphics.
5. Click OK.
By clicking the Options button on the Compress Pictures dialog box, you can open the Compression Settings dialog box, as shown in Figure 3-6, and tell PowerPoint how to compress your graphics:
Automatically Perform Basic Compression on Save: Select this check box to compress graphic files each time you save your PowerPoint file.
Delete Cropped Areas of Pictures: As “Cropping off part of a graphic” explains earlier in this chapter, PowerPoint crops graphics in name only. PowerPoint retains the cropped part of the graphic in case you want it back, but you can remove the cropped part as well by selecting this check box.
Target Output options: These options — Print (220 ppi), Screen (150 ppi), and Email (96 ppi) — tell PowerPoint which pixels-per-inch (ppi) setting to use when compressing graphics. Choosing a higher setting makes the graphics look sharper but also requires more disk space. In other words, the higher setting doesn’t compress the graphic as much.
Using Graphics as Backgrounds
Graphics are nice all by themselves, and you can make even more use of them in backgrounds. Maybe “backdrops” is the better word. These pages explain how you can make a faint image appear in the background of a slide and use a graphic as a background for text in a text box. I also describe how to use text as a background for a slide.
Using a picture in the background
As long as the picture is faint to begin with or you use a washout or light variation of a picture, a picture can serve nicely in the background of a slide. Figure 3-7 shows examples of pictures as slide backgrounds. Notice on each slide that the picture has been “washed out” so that you can read the text. (Book II, Chapter 3 explains how to make a picture fill the entire slide background.)
|
Figure 3-7: Pictures as slide backgrounds. |
|
Follow these steps to place a graphic in the background:
1. Insert the image that you want to use in the background.
See “Inserting a Graphic on a Slide,” earlier in this chapter, for instructions about inserting images.
2. Position the graphic and resize it.
3. On the (Picture Tools) Format tab, click the Recolor button and choose the Washout option or a Light Variation option.
You can find the Washout option under “Color Modes.”

4. If necessary, click the Send To Back button.
Taking this step moves your graphic behind text and other objects that you placed on your slide. Experiment with the Brightness and Contrast settings on the Format tab to make your graphic stand out or shrink like a violet behind the scenes.
To make the same watermark appear on all or some of the slides in your presentation, seek the help of a master slide. Book II, Chapter 2 explains master slides and how you can use them to format many slides simultaneously.
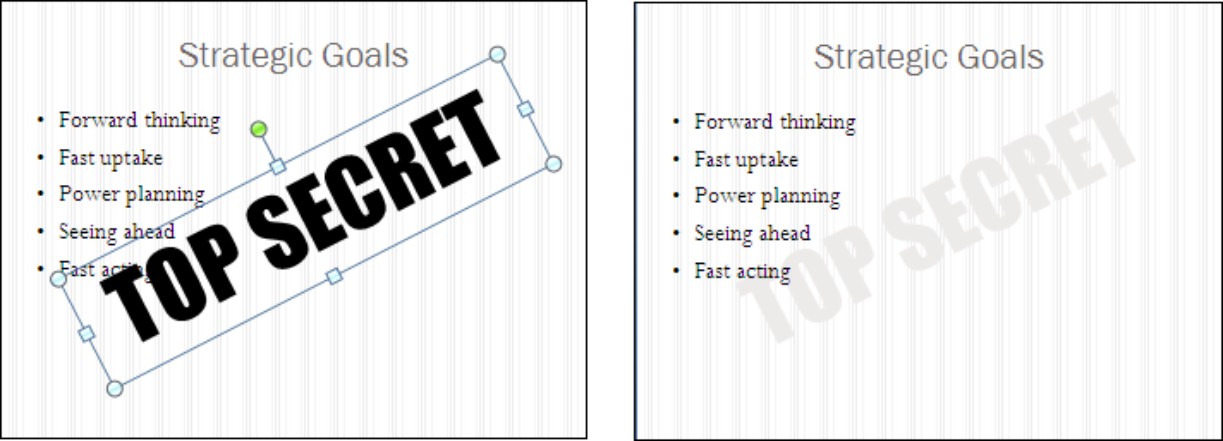
Using text as a slide background
Text on the background of a slide can be very cool, especially if you slant the words or turn them on their side. I like “Top Secret” text because it makes the audience think it’s seeing something it shouldn’t see.
Follow these steps to place text in the background of a slide:
1. Create a text box and enter the words.
Book II, Chapter 5 describes how to create text boxes.
2. Select the text in the text box.
To select the text, drag over it.

3. On the Home tab or Mini-toolbar, open the drop-down list on the Font Color button and choose a light color suitable for the background of slides.
4. Select the text box.
5. Click the Home or Format tab.
6. Click the Send to Back button (you may have to click the Arrange button first, depending on the size of your screen).
Clicking this button places the text box behind other text or artwork that you place on the slide.
To make a text appear in the background of all or some of the slides in a presentation, place the text on a master slide. Book II, Chapter 2 explains master slides.
Using a graphic as background for text
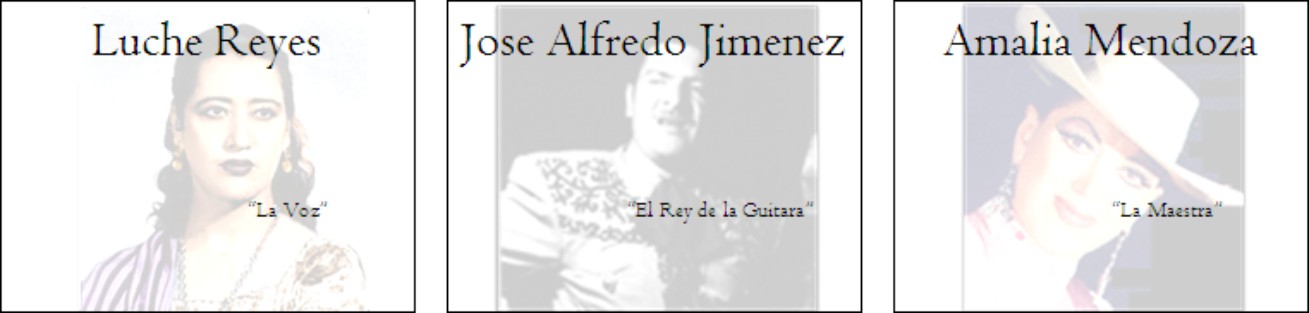
Figure 3-8 shows an example of a graphic, in this case a photograph, being used as the background in a text box. Sophisticated, is it not? You can impress your friends and intimidate your enemies by using a graphic as a background this way. To make it work, however, you need a graphic that serves well in the background. Black-and-white and “recolored” photographs work best in the background.
|
Figure 3-8: A black-and-white photograph used as the background of a text box. |

|
Using a graphic as a background is a three-step business. First you create the text box with the graphic, then you position the text box and make it the right size, and then you enter the text. On your marks, get set, go!
Creating the text box
Follow these steps to create a text box with a graphic in the background:

1. On the Insert tab, create a text box (but don’t enter any text).
Book II, Chapter 5 describes how to create text boxes.
2. Right-click your text box and choose Format Shape on the drop-down list.
You see the Format Shape dialog box.
3. In the Fill category, select the Picture or Texture Fill option button.
As soon you select the option button, commands for inserting pictures appear in the dialog box.
4. Click the File button, and in the Insert Picture dialog box, locate and select the picture you want for the background; then click the Insert button.
You return to the Format Shape dialog box.
5. Select the Text Box category.
6. Click the Do Not AutoFit option button.
By turning AutoFit off, you make it possible to change the size of the text box. You’ll have a squished box unless you turn AutoFit off.
7. Click the Close button.
Now you’re ready to position the text box and make it the right size.
Enlarging and positioning the text box
At this point, you’re looking at a puny text box with a little graphic inside it. Your next task is to enlarge the text box and position it on the slide:
Enlarging the text box: On the (Picture Tools) Format tab, enter Height and Width measurements (depending on the size of your screen, you may have to click the Size button to get to the measurement boxes). You can also move the pointer over a corner selection handle of the text box, and when you see the two-headed arrow, click and start dragging.

Positioning the text box: Move the pointer onto the perimeter of the text box, and when you see the four-headed arrow, click and start dragging.
The previous chapter explains how to position objects, including graphics, on a slide, as well as how to enlarge graphics.
Entering the text
Your next task is to enter and align the text:
1. Click the Home tab.
2. Open the drop-down list on the Font Color button and choose a color for text.
Choose a color that will show up well in front of the graphic. If the graphic is a dark one, choose a light font color; if the graphic is light, choose a dark font color.
3. Choose a Font on the Font drop-down list.
4. Choose a font size on the Font Size drop-down list.
Book II, Chapter 4 explains fonts and everything a mortal needs to know about entering text in a text box.
5. Type your text.
6. In the Paragraph group, choose Alignment options to arrange the text inside the text box.
Once again, Book II, Chapter 5 explains the Alignment options in detail. Click an Align button — Align Left, Center, or Align Right — to arrange the text inside the text box; to shunt the text to one part of the text box, click the Align Text button and choose Top, Middle, or Bottom on the drop-down list.
Putting Together a Photo Album
Photo album is just PowerPoint’s term for inserting many photographs into a presentation all at once. You don’t necessarily have to stuff the photo album with travel or baby pictures for it to be a proper photo album. The Photo Album is a wonderful feature, I think, because you can use it to dump a bunch of photos in a PowerPoint presentation without having to create slides one at a time, insert the photos, and endure the rest of the rigmarole. Create a photo album to quickly place a bunch of photos on PowerPoint slides.
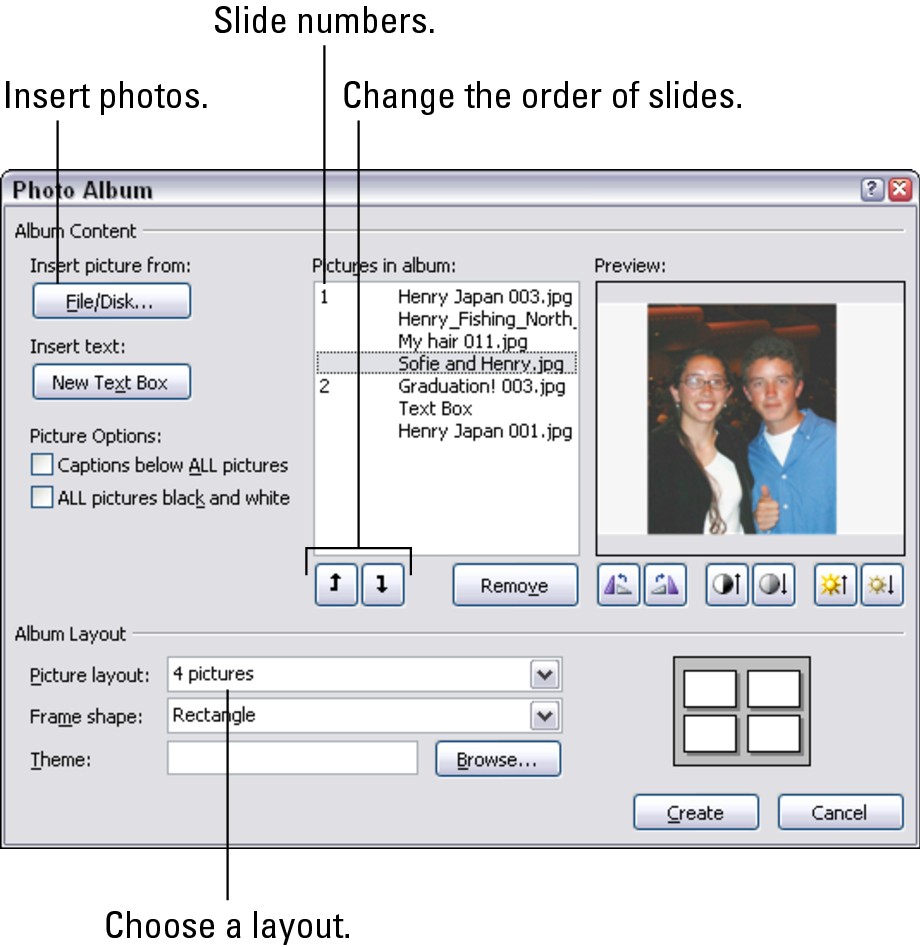
Creating your photo album

|
Figure 3-9: Create a photo album in this dialog box. |
|
Inserting the pictures and creating slides
Here is the lowdown on choosing pictures for your photo album:
Inserting photos: Click the File/Disk button and choose photos in the Insert New Pictures dialog box. You can select more than one photo at a time by Ctrl+clicking in the dialog box. The filenames of photos you selected appear in the Pictures in Album box. Slide numbers appear as well so you know which photos are on which slides.
Inserting a text box: Insert a text box if you want to enter commentary in your photo album. In the Pictures in Album box, select the picture or text box that you want your new text box to go after, and then click the New Text Box button. Later, you can go into your presentation and edit the placeholder text, which PowerPoint aptly enters as “Text Box.”
Providing captions for all pictures: To place a caption below all the pictures in your photo album, select the Captions Below ALL Pictures check box. PowerPoint initially places the picture filename in the caption, but you can delete this caption and enter one of your own (to select this option, you must have chosen any picture layout but Fit To Slide; see the next section in this chapter).
Changing the order of pictures: Select a picture in the Pictures in Album box and then click an arrow button to move it forward or backward in the presentation.
Changing the order of slides: Ctrl+click to select each picture on a slide. Then click an arrow as many times as necessary to move the slide forward or backward in the presentation.
Removing a picture: Select a picture in the Pictures in Album box and click the Remove button to remove it from your photo album. You can Ctrl+click pictures to select more then one.
Choosing a layout for slides
Your next task is to go to the bottom of the Photo Album dialog box (refer to Figure 3-9) to choose a layout for the slides in the presentation:
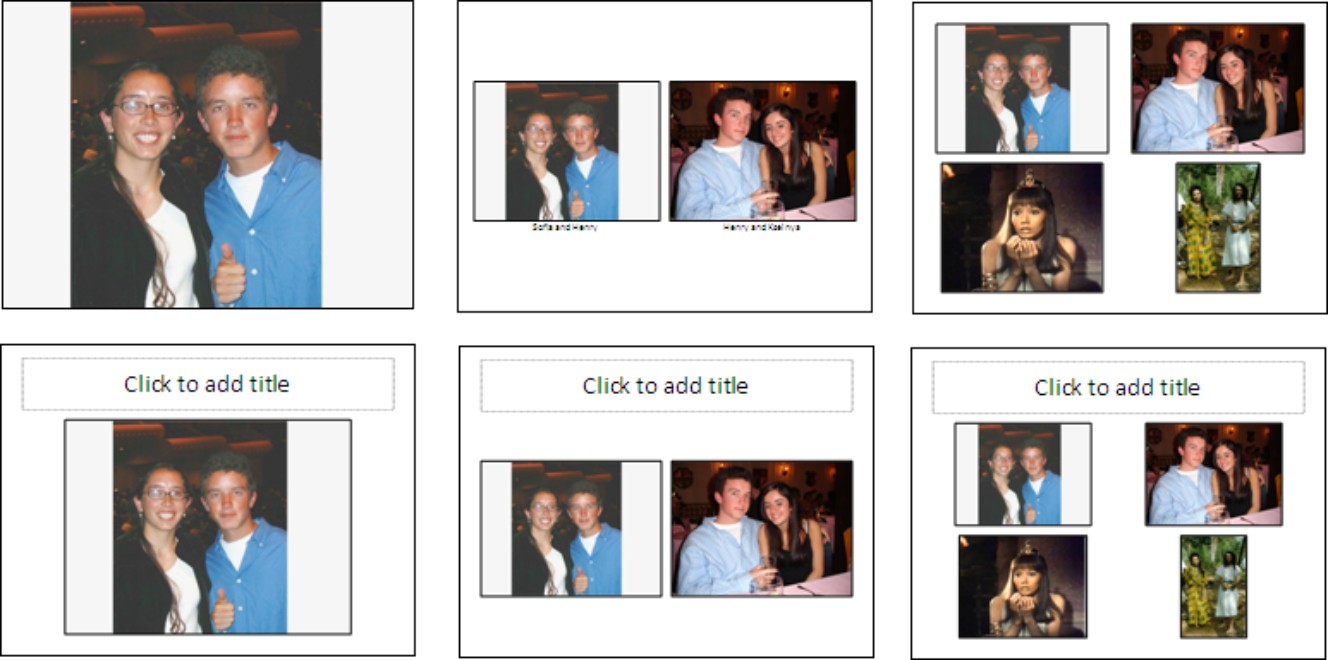
Choosing a slide layout: Make a choice on the Picture Layout drop-down list to choose a layout for your slides. Figure 3-10 demonstrates six of the seven picture layouts:
• Choose Fit to Slide for a presentation in which each picture occupies an entire slide.
• Choose a “pictures” option to fit 1, 2, or 4 pictures on each slide.
• Choose a “pictures with title” option to fit 1, 2, or 4 pictures and a text title frame on each slide.
|
Figure 3-10: Picture Layout options: (top row) Fit to Slide, 2 Pictures, 4 Pictures; (bottom row) 1 Picture with Title, 2 Pictures with Title, 4 Pictures with Title. |
|
Changing the look of pictures
The Photo Album dialog box (refer to Figure 3-9) offers a handful of tools for changing the look of the pictures. As you use these tools, keep your eye on the Preview box — it shows you what you’re doing to your picture.
Making all photos black and white: Select the ALL Pictures black and white check box.
Rotating pictures: Click a Rotate button to rotate the picture clockwise or counterclockwise.
Changing the contrast: Click a Contrast button to sharpen or mute the light and dark colors or shades in the picture.
Changing the brightness: Click a Brightness button to make the graphic brighter or more somber.
Choosing a frame shape for pictures: If you opted for a “picture” or “picture with” slide layout, you can choose a shape — Beveled, Oval, or another — for your pictures on the Frame Shape drop-down list. The preview slide in the dialog box shows what your choice means in real terms.
Choosing a theme for your photo album: If you selected a “picture” or “picture with” slide layout, you can choose a theme for your slide presentation. Click the Browse button and choose a theme in the Choose Theme dialog box.
At last, click the Create button when you’re ready to create the photo album. PowerPoint attaches a title slide to the start of the album. It says, “Photo Album” with your name below.
Putting on the final touches
Depending on the options you chose for your photo album, it needs all or some of these final touches:
Fix the title slide: Your title slide should probably say more than the words “Photo Album” and your name.
Fill in the text boxes: If you entered text boxes in your album, by all means replace PowerPoint’s generic text with meaningful words of your own.
Write the captions: If you asked for photo captions, PowerPoint entered photo filenames below photos. Replace those filenames with something more descriptive.
Editing your photo album
To go back into the Photo Album dialog box and rearrange the photos in your album, go to the Insert tab, open the drop-down list on the Photo Album button, and choose Edit Photo Album on the drop-down list. You see the Edit Photo Album dialog box. It looks and works exactly like the Photo Album dialog box (refer to Figure 3-9). Of course, you can also edit your photo album by treating it like any other PowerPoint presentation. Change the theme, fiddle with the slides, and do what you will to torture your photo album into shape.
Using Microsoft Office Picture Manager
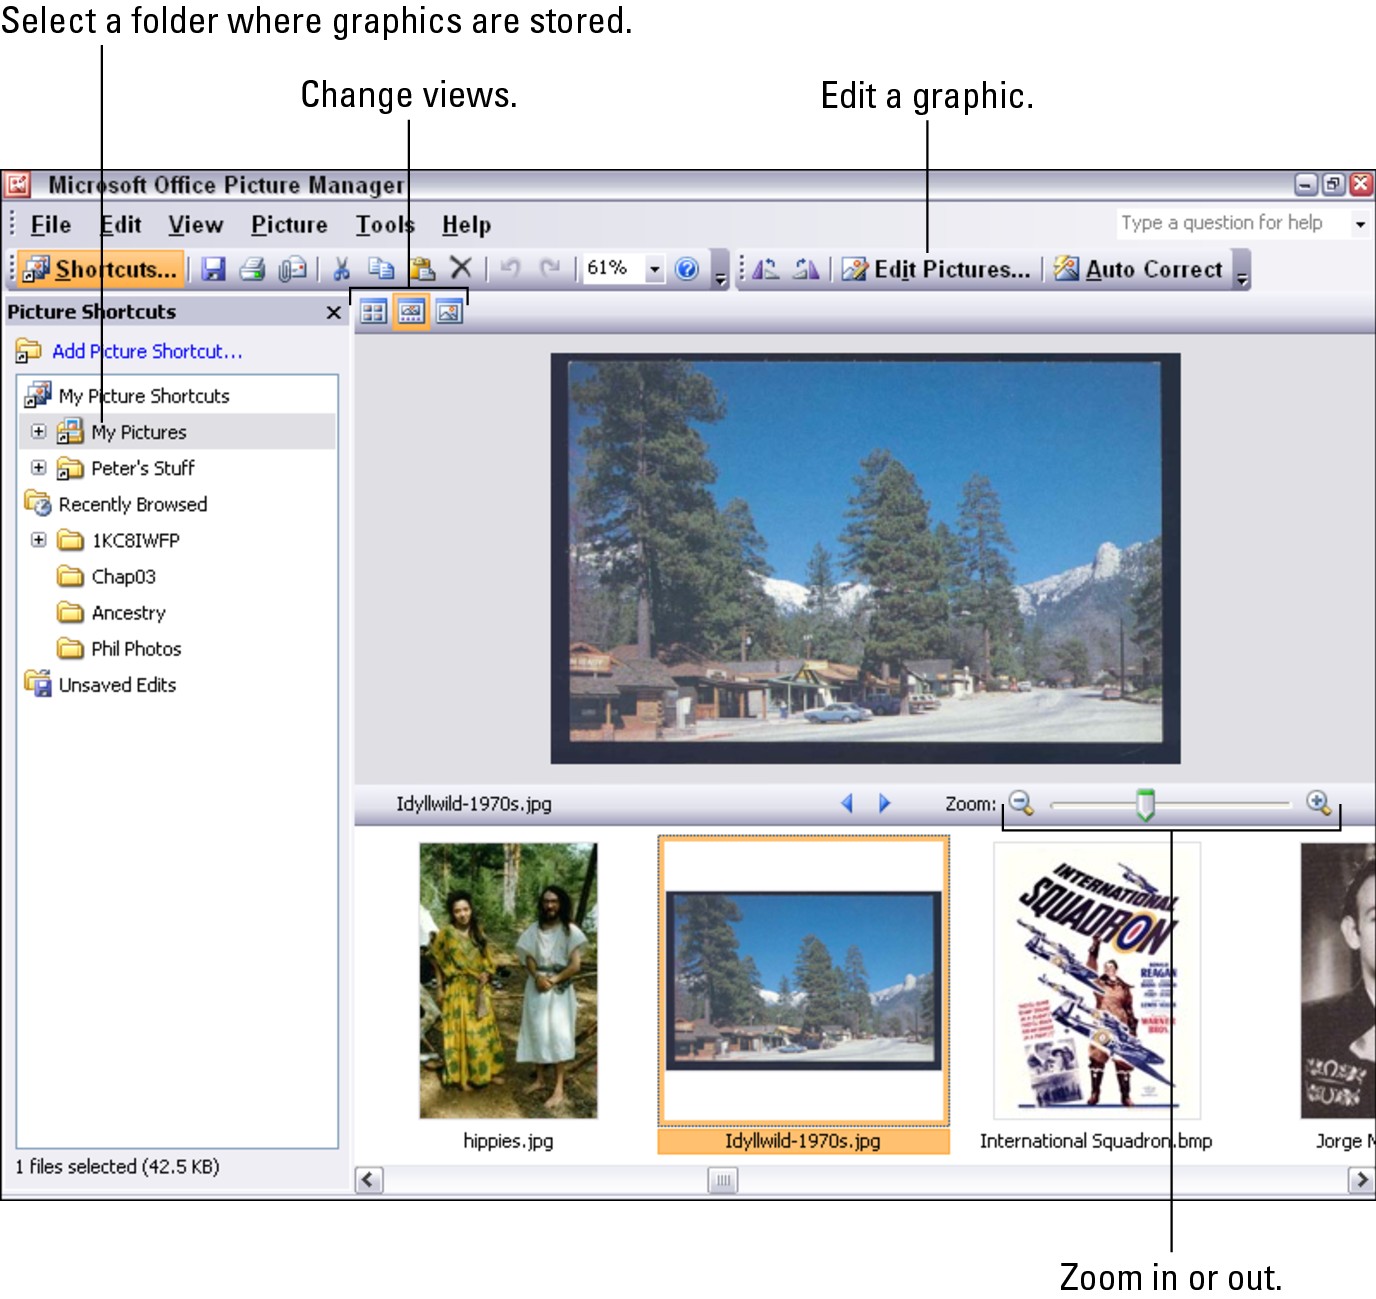
You may not know it, but you installed a program for managing and editing pictures when you installed Office. The program is called Microsoft Office Picture Manager, and you can use it to organize graphics and touch up graphics before inserting them in PowerPoint slides. As shown in Figure 3-11, Picture Manager displays graphics so that you can see precisely what your editorial changes do to them. The program makes it easy to find and organize graphic files on your computer. In every Office program, PowerPoint included, you can find commands for editing graphics, but you often have to dig into obscure dialog boxes to find them. Office Picture Manager puts the editing commands on the side of the screen where you can find them easily.
|
Figure 3-11: The Microsoft Office Picture Manager window in Single Picture view. |
|
To open Office Picture Manager, click the Start button and choose All Programs⇒Microsoft Office⇒Microsoft Office Tools⇒ Microsoft Office Picture Manager. You see the window shown in Figure 3-11. Starting there, you can display a graphic on your computer and change its appearance in several different ways.
Mapping the graphic files on your computer
The first step in using the Office Picture Manager is to tell the program what kind of graphic files you work with and point to the folders on your computer where these graphic files are located. After you tell Office Picture Manager which folders graphic files are kept in, shortcuts to the folders appear in the Picture Shortcuts pane on the left side of the window (refer to Figure 3-11). By clicking one of these shortcuts, you can open a folder, view its contents, and edit a graphic file.
Follow these instructions to get started in Office Picture Manager:
Telling the program which graphic file types you use: Choose Tools⇒ File Types to open the File Types dialog box (Windows XP only). Select the file types you want to manipulate with Office Picture Manager and click OK. Earlier in this chapter, Tables 3-1 and 3-2 explain what these files types are.
Telling the program which folders contain graphic files: Choose File⇒ Add Picture Shortcut or click the Add Picture Shortcut link in the Picture Shortcuts pane (click the Shortcuts button to see this pane). The Add Picture Shortcut dialog box opens. Select a folder where you store graphics you want to work with and click the Add button.
Click the Shortcuts button (or choose View⇒Shortcuts) to display the Picture Shortcuts task pane. To remove a shortcut from the task pane, right-click it and choose Remove Shortcut.
Displaying the graphic file you want to work with
After you’ve created shortcuts to the folder where you keep graphic files, you can display a graphic file by following these steps:
1. Click the Shortcuts button, if necessary, to display the Picture Shortcuts task pane.
2. Click a shortcut to a folder.
Graphic files in the folder appear in the middle window (refer to Figure 3-11).
3. Scroll to or choose a different view to pinpoint the file.
Office Picture Manager offers three views: Thumbnail, Filmstrip, and Single Picture. Click a View button to change views (refer to Figure 3-11).
Editing a picture
With the graphic you want to edit on display, you’re ready to start editing. Office Picture Manager offers two ways to get down to business:
Click the Edit Pictures button to display the Edit Pictures task pane. It lists the names of editing tools. Click the link that represents the kind of editing you want to do. For example, to adjust a graphic’s brightness and contrast, click the Brightness and Contrast link.
Open the Picture menu and choose a task — Brightness and Contrast, Color, Crop, Rotate and Flip, Red Eye Removal, Resize, or Compress Pictures. For example, choose Brightness and Contrast to adjust the graphics brightness and contrast.
To let Office Picture Manager try its hand at improving your graphic, click the AutoCorrect button (or choose Picture⇒AutoCorrect).
Click the Save button (or press Ctrl+S) to save your graphic when you have finished editing it. For that matter, choose File⇒Save As before you start editing and save the file under a new name so that you have the original in reserve.

Adjusting the brightness and contrast
Select a graphic and choose Picture⇒Brightness and Contrast or click the Brightness and Contrast hyperlink in the Edit Pictures task pane to adjust a graphic’s tonal intensity. You see a Brightness, Contrast, and Midtone slider on the Brightness and Contrast task pane. Without going into too much detail, here is what these three slider settings do:
Brightness: Adjusts the inherent brightness value in each pixel. Increasing the brightness makes the image lighter; decreasing it makes the image darker.
Contrast: Increasing the contrast, in the words of a laundry detergent manufacturer, “makes your whites whiter and your darks darker,” whereas decreasing the contrast making the tones more similar.
Midtone: Redefines the midtones, or tonal values between light and shadow, of an image. Dragging the slider to the right brightens the image.
The heck with it — you can just click the Auto Brightness button and let Office Picture Manager adjust the brightness and contrast for you.
Balancing the colors
Select a graphic and choose Picture⇒Color or click the Color hyperlink in the Edit Pictures task pane to fine-tune a graphic’s colors.
You can have Office Picture Manager do the fine-tuning for you. Click the Enhance Color button and then click a part of the graphic that is supposed to be white. If you don’t like the results, try balancing the colors in the graphic yourself by dragging these three sliders:
Amount: Increasing this value magnifies the hue and saturation settings; decreasing this value minimizes them.
Hue: Increasing this value further distinguishes the colors from one another; decreasing this value makes the colors blend.
Saturation: Increasing it makes colors more luminous; decreasing this value makes colors grayer.
Cropping a graphic
Select a graphic and choose Picture⇒Crop or click the Crop hyperlink in the Edit Pictures task pane to cut off parts of a graphic. As shown in Figure 3-12, Office Picture Manager shows precisely how much of the graphic you will crop when you click the OK button. The Crop task pane is especially useful if you want your graphic to be a certain size. Under “Picture Dimensions,” you can see exactly how many pixels high and wide your graphic is. By dragging the selected part of the graphic — the part that isn’t grayed out — you can be very precise about what part of the graphic remains after you crop.
The Crop task pane offers two ways to crop a graphic:
Crop at will: In the Aspect Ratio drop-down list, choose None and then drag a corner or side cropping handle.
Maintain symmetry when you crop: Choose an option from the Aspect Ratio drop-down list and select the Landscape or Portrait option button before you drag a corner or side cropping handle. Aspect ratio proportionally describes the relationship between a graphic’s width and height. For example, at the 4 x 6 aspect ratio, the graphic in Portrait mode is a third taller than it is wide ( ƒ 4/6); in Landscape mode, the graphic is a third wider than it is high. Choose an aspect ratio setting when you want your graphic to have symmetry.
|
Figure 3-12: Cropping part of a picture. |
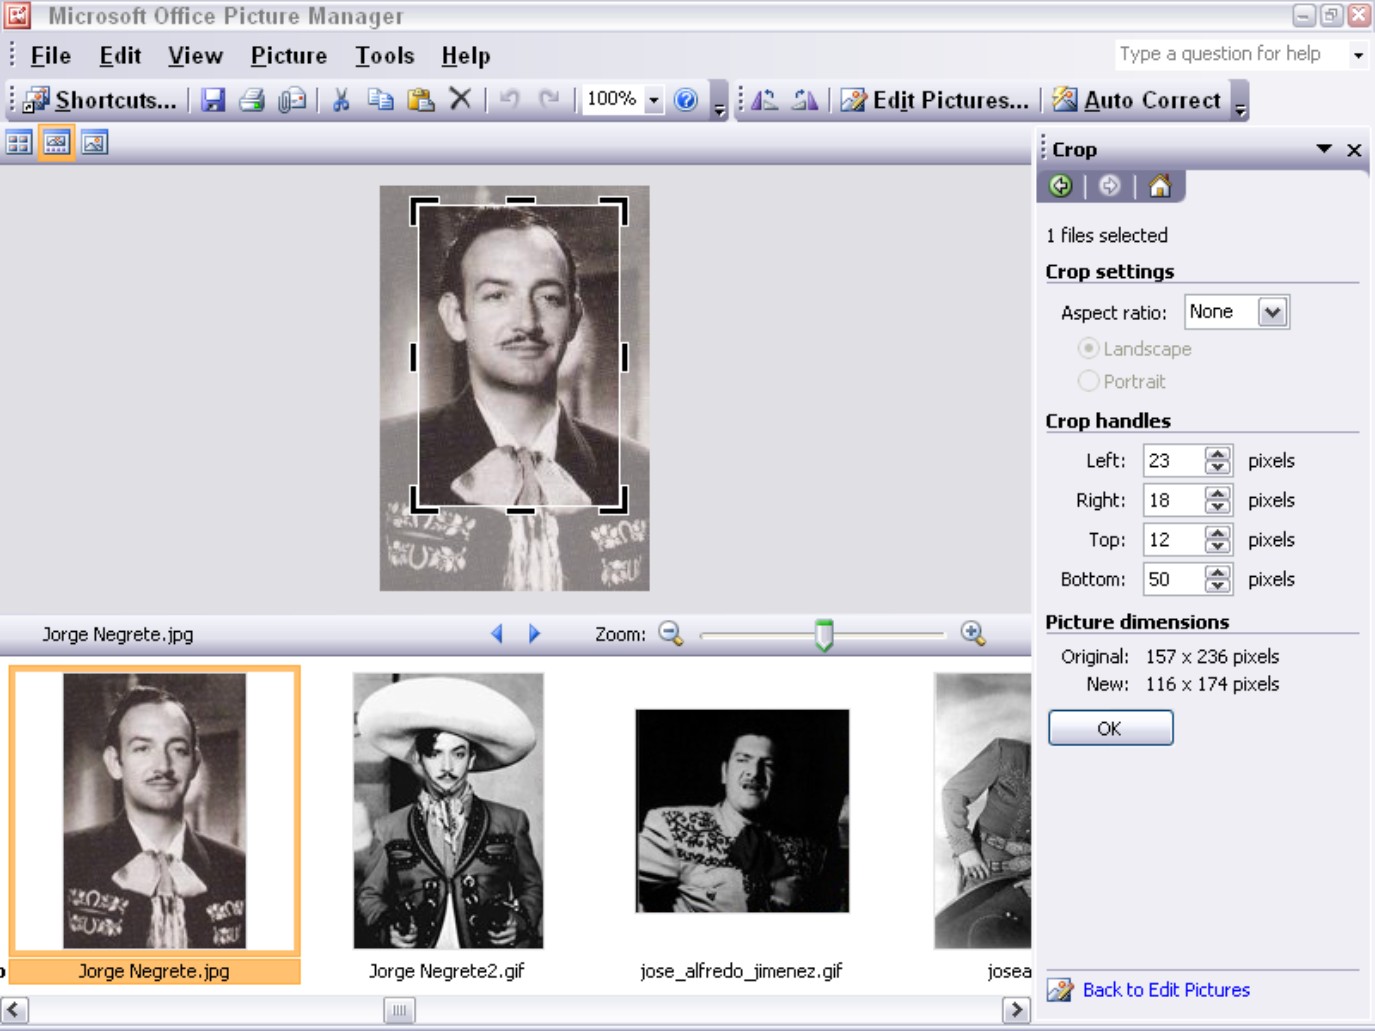
|
Cropping a graphic doesn’t reduce its file size. To reduce a graphic’s file size after you’ve cropped it, compress the graphic. See “Compressing a graphic,” later in this chapter.
Rotating and flipping graphics
Select a graphic and choose Picture⇒Rotate and Flip or click the Rotate and Flip hyperlink in the Edit Pictures task pane to rotate or flip graphics. The Rotate commands turn the graphic on its side; the Flip commands provide mirror images of the original graphic. You can rotate a graphic by degrees by entering a value in the By Degree text box.
The Formatting toolbar also offers Rotate buttons for rotating graphics.
Removing the “red eyes” from a graphic
Sometimes the subject of a photo appears to have red eyes, not because the subject didn’t get enough sleep, but because the camera flash made the subject’s irises turn red. Follow these steps to remove red eye from a digital flash photograph:
1. Choose Picture ⇒Red Eye Removal or click the Red Eye Removal hyperlink in the Edit Pictures task pane.
2. Drag the Zoom slider to the right so that you get a good look at the red eyes in the photo.
3. Click each red eye to select it.
4. Click the OK button.
You can click the Reset Selected Eyes button to start all over, if you need to do that.
Resizing a graphic
To change the size of a graphic, select it and choose Picture⇒Resize or click the Resize hyperlink in the Edit Pictures task pane. You land in the Resize task pane. It offers three ways to change the size of a graphic:
Predefined Width x Height: Select this option button, and on the drop-down list, choose the setting that best describes why you want to change the graphic’s size. For example, if you intend to post the graphic on a Web page, choose Web - Large or Web - Small.
Custom Width x Height: Select this option button and enter pixel measurements for the width and height of the graphic. Be careful with this option, because the graphic doesn’t maintain its original proportions unless you calculate the proportions yourself, and when a resized graphic loses its original proportions, it can be skewered or blurred.
Percentage of Original Width x Height: Select this option button and enter the percentage by which you want to enlarge or shrink the graphic.
The bottom of the task pane tells you how many pixels wide and high your graphic was to start with and how wide and high it is after resizing.
Compressing a graphic
Near the beginning of this chapter, “Compression” explains what compressing a graphic entails. Compress a graphic to reduce its file size. Compressing a graphic file reduces its points per inch (ppi) setting. Some graphic types, however, can’t be compressed.
To compress a graphic, select it and choose Picture⇒Compress Pictures or click the Compress Pictures hyperlink in the Edit Pictures task pane. You see the Compress Pictures task pane. The bottom of the task pane tells you how much the graphic will shrink in size after you compress it. Choose a Compress For option button and click OK.