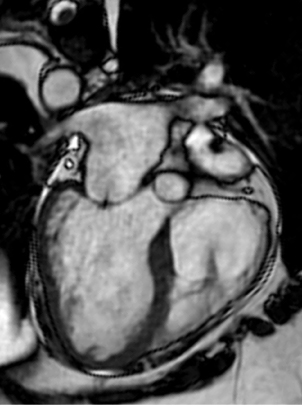
FIGURE 2.1 A magnetic resonance imaging study of a heart with hypertrophic cardiomyopathy.
Courtesy of Hussein Rayatzadeh, M.D.
CHAPTER 2
REEXAMINING THE PHYSICAL EXAM
Then he felt her pulse. There was a strong stroke and a weak one, like a sound and its echo. That was supposed to betoken the end.
—D.H. LAWRENCE (1885–1930), Sons and Lovers
Our senses as diagnostic aids have been almost completely replaced by laboratory instruments and the consequences may sometimes be disastrous.
—LOUIS K. DIAMOND, M.D. (1902–1999)
Dr. Louis Diamond, a clinical giant and a pioneer in the field of pediatric hematology, was entirely on target with his warning about the attrition of physical diagnostic skills over the past decades. Clinicians have come to overrely on “definitive” imaging studies for diagnoses. Multiple studies, including computed tomography (CT) scans, magnetic resonance imaging (MRI), and ultrasonography (Figure 2.1), reveal information beyond the sensitivity of human observers and may confirm and quantify findings. Such studies are invaluable triumphs of modern biotechnology.
FIGURE 2.1 A magnetic resonance imaging study of a heart with hypertrophic cardiomyopathy.
Courtesy of Hussein Rayatzadeh, M.D.
Conversely, to the degree that imaging studies dull perceptive skills, clinicians and students need to be very cautious. A careful physical exam remains a mainstay of clinical diagnosis and management. Cross-checking every aspect of the exam by some imaging or other test is both costly and infeasible. In addition, some studies, such as x-rays and computerized tomographic (CT) scans, may subject patients to unnecessary radiation exposure. Other tests, such as tissue biopsies, carry obvious risks. Furthermore, imaging studies have important diagnostic limitations with respect to sensitivity and specificity. Adding to their expense and risk, the more tests you order, the more you are likely to generate false positives or otherwise misleading findings. On the other hand, failure to recognize the limited sensitivity of a test may result in missed diagnoses.
The physical exam is therefore not only vital but should be repeated as often as needed. For example, the presence of a new murmur after a myocardial infarction may herald a potentially catastrophic condition, such as a ventricular septal defect, acute mitral regurgitation from papillary muscle rupture, or left ventricular free wall rupture. But above all, the “laying on of hands” in a thoughtful and compassionate way is an essential part of the unique connection between clinician and patient. As Sir William Osler advised:
Remember … that every patient upon whom you wait will examine you critically and form an estimate of you by the way in which you conduct yourself at the bedside. Skill and nicety in manipulation, in the simple act of feeling the pulse or in the performance of any minor operation will do more towards establishing confidence in you, than a string of Diplomas, or the reputation of extensive hospital experience.
A major theme is that examining a patient is a form of focused questioning or hypothesis testing, a special type of active, iterative, and interrogatory process shaped by the patient’s presenting complaint and history. This notion of a dynamic rather than a passive exam is critically important because it underscores the necessity to “look, listen, and feel for findings,” not just at them. Many important findings do not jump out at you; you have to hunt for them. Although some findings are obvious (e.g., marked scleral icterus, severe clubbing of the fingers and toes), most are not. For example, you will almost certainly never notice Cheyne–Stokes breathing (in heart failure or stroke) or pulsus paradoxus (in pericardial tamponade or severe obstructive lung disease) unless you look for them, as illustrated further below. In doing so, you are testing, asking directing questions and sometimes posing actual hypotheses, referred to more informally as hunches. (“I am testing the hypothesis that this patient has physical findings consistent with hyperthyroidism.”)
The physical exam is often taught with an emphasis on “observational findings” from regional components [head, eyes, ears, nose, and throat, neck, thoracic (chest, heart), abdominal, etc.]. In addition, students should conceptualize the exam not only in terms of these component (regional) parts, but of more systemic (integrated) features and be guided by active questioning and hypothesis testing, not just passive observation. For example, in examining the thyroid gland area, the key parameters (by inspection and palpation at baseline and during swallowing) are its estimated size, consistency, tenderness, and presence of nodularity/masses. The most basic (ground level) questions might be: Does the patient have a normal-feeling gland or enlarged thyroid (goiter), the latter most consistent with hyperthyroidism? Is there evidence of nodularity (single or multiple) or other masses? Is the thyroid area tender, consistent with thyroiditis? The more advanced the examiner, the more refined the questions, hypotheses, and exam techniques will be. (See Chapter 11 and the “nautilus shell” learning approach.)
From a systemic point of view, informed by the patient’s history, you may also be testing hypotheses that require complex integration and coordination of multiple components of the exam. For example, if your guess (hypothesis) is that your patient has hyperthyroidism, you will be addressing a number of specific questions: Is there resting tachycardia or a fast irregular rhythm, suggesting atrial fibrillation? Is there a fine resting tremor of the hands? Noticeable sweatiness? Is there lid-lag or a characteristic stare? Is there frank proptosis (exophthalmos), specifically suggesting Graves’ disease as the etiology of the hyperthyroidism? Is there a thyroid bruit? Muscle weakness consistent with myopathy? A nonpitting type of indurated, pretibial edema (confusingly called pretibial myxedema)? Cardiovascular findings consistent with high-output heart failure? Integration of findings also helps increase certainty about disease status. For example, a borderline prominent thyroid gland in the presence of a constellation of several other findings typical of hyperthyroidism increases the probability that an apparently enlarged gland is abnormally hyperactive.
The concept of the physical exam as an integrated dynamic set of observations, directed questions, and hypothesis testing can help trainees think creatively and physiologically. Consider the cardiac exam. Traditionally, the centerpiece, literally and figuratively, is auscultation of the heart. However, by the time that experienced cardiologists apply their stethoscopes to the chest, they may have “upregulated” their sensory apparatus by looking for and finding other clues. For example, low-amplitude carotid pulses with delayed upstrokes strongly suggest advanced aortic stenosis. Hearing bilateral bruits over the carotids raises the differential diagnosis of local stenosis vs. a transmitted murmur. Testing to see if the point of maximal impulse is sustained further supports a pressure load. In the absence of hypertension (the most common cause of a pressure load on the left ventricle), the probability of critical aortic stenosis is raised even further in the presence of these findings, well in advance of auscultation. With advanced aortic insufficiency (regurgitation), cardiac auscultation may also be “anticlimactic” since you will probably make or suspect a diagnosis based on systolic hypertension with a widened pulse pressure and bounding pulses.
A second major theme of this chapter is that the physical examination can be viewed as a coordinated series of lab tests, each component of which has its own limitations in sensitivity, specificity, and predictive values. Failure to appreciate the elements of a physical exam as the equivalent of a set of lab tests may lead to diagnostic errors, including both oversights (false negatives) and overcalls (false positives). For example, according to McGee’s textbook (see the Bibliography), the absence of a goiter by palpation or inspection has a sensitivity (versus ultrasound measures or surgical weight as the “gold standards”) of only 5 to 57% and a specificity of only 0 to 26%. In contrast, the presence of a goiter by palpation has a higher reported sensitivity (between 43 and 82%) and specificity between 88 and 100%. These figures are of note for at least two reasons: (1) they indicate the large disparity from one study to another in assessing medical diagnostics, and (2) they suggest that clinicians are much more likely to underestimate than to overestimate the presence of an enlarged thyroid.
Recognizing and quantifying the imprecision of a physical finding does not detract at all from the scientific nature of the exam; rather, it puts the exam on a firmer scientific basis so that the positive and negative findings can be assessed more objectively and quantitatively. Also, studies that analyze the exam critically may motivate innovative diagnostic modalities or maneuvers that enhance the accuracy of the physical exam. The ability of students to correlate their physical findings with objective imaging studies (ultrasound exams, cardiac catheterizations, MRI and CT scans, or direct tissue studies from biopsies or the operating room) provides an invaluable way of honing examination skills.
A number of superb texts detail the uses and limitations of the physical exam; some are cited in the Bibliography, including the JAMA evidence-based clinical diagnosis text, The Rational Clinical Examination, edited by Dr. David Simel and Dr. Drummond Rennie and Dr. Steven McGee’s book, Evidence-Based Physical Diagnosis. The purpose here is to emphasize essential aspects of the exam that are often performed incompletely or described incorrectly in oral and written presentations.
Worth reemphasizing is the importance of examining patients with direct visualization and palpation, not through the gown, which can mask findings (e.g., skin lesions), decrease tactile sensitivity, and lead to false-positive findings (e.g., spurious “rales”).
The summary of the physical exam must always begin with a brief sentence or two describing the general appearance of the patient. This first element in the physical examination places the entire case in context. Here are some examples:
Mr. Jones is a young adult man in no apparent distress, asking when he can be discharged.
Ms. Smith is a middle-aged woman complaining of severe chest pain and sweating profusely.
Ms. Roberts is a very pale elderly woman intubated and sedated, making intermittent groaning sounds.
The general appearance of the patient is a key aspect of the physical examination and should always be described in written and oral presentations, no matter how abbreviated. This description will guide the pace of the remainder of the evaluation (e.g., if the patient has unexplainable mental status changes and slurred speech or is in extreme pain). This assessment is one of the facets that distinguish students from residents from seasoned attendings: The ability to sense how sick your patient may be is not only the initial part but also one of the most valuable aspects of the physical exam.
Perhaps the most important short-changed features of an exam are appropriately termed the vital signs. However, despite their centrality in the exam, even the definition of what constitutes the vital signs is subject to describer variability and some controversy. Universally, clinicians include a minimum of four measurements in the vital signs: body temperature, heart rate, respiration, and blood pressure. The patient’s perception of pain is sometimes included. Additionally, the authors concur with those who add height (may be self-reported by the patient) and weight (should always be measured), and, if indicated, noninvasive oxygen blood content (pulse oximetry). The latter is usually obtained at the bedside by a probe placed on the earlobe or finger and expressed as SpO2. This is not SaO2, or true arterial saturation, which is not available unless you have access to blood from an indwelling arterial catheter in an intensive care unit (ICU).
What is rarely, if ever, discussed on rounds is how devices such as oximetry probes are actually designed to work. Although most physicians are not engineers, a general knowledge of the equipment we use is interesting and helpful in understanding the artifacts and limitations of these devices.
FIGURE 2.2 A pulse oximeter.
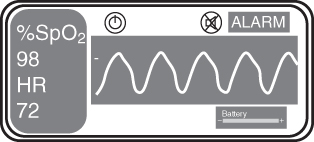
Comment: Carbon monoxide (CO) poisoning can cause a myriad of clinical symptoms, ranging from mild nausea to severe central nervous system (CNS) toxicity and even death. Although hyperbaric oxygen therapy is sometimes used in cases of acute poisoning, symptoms due to chronic exposure to relatively low levels of carbon monoxide—as in the case of this patient—usually resolve after removal from the exposure. Pulse oximetry was normal and remained normal during admission. A CO oximeter is needed to determine carboxyhemoglobin levels. A standard pulse oximeter will not detect CO poisoning because the carboxyhemoglobin will be misdetected as normal hemoglobin.
Every admission exam should enumerate vital sign measures and specify which ones are not available. And although you may not be the one taking the initial vital signs (usually performed at first in the emergency department, or by another member of the health care team in the inpatient or outpatient setting), make every effort to confirm them yourself. For example, it may be literally life-saving if you notice a 30-mmHg drop in systolic blood pressure compared to a reading recorded as normal 1 hour prior.
You should train yourself to avoid the following lapses, both minor and major:
Note that SpO2 is measured as a percentage (%).
Aside from not assigning proper units to the vital signs, a much more serious source of error is in actually mismeasuring or representing them incompletely. Considering that the vital signs are the most accessible and objective of physical findings, this common flaw is surprising and calls into question apparently less objective and more subtle measurements that follow. Being more precise and scientific in how you report and expect the vital signs to be reported will raise the bar on your other clinical communications. Rigor breeds rigor.
For heart rate, it is appropriate to add a tag line indicating the cadence of the heartbeat: whether it is regular, grossly irregular, or intermittently irregular. Stating “normal sinus rhythm” or “regular sinus rhythm” in the physical is not appropriate, however, since sinus rhythm is a finding based on an electrocardiogram (ECG), not on a physical exam. For example, the heart rate could be 75 beats per minute and regular with atrial flutter and 4 : 1 atrioventricular (AV) conduction rather than with sinus rhythm. [A very canny observer in the latter case may note flutter waves in the jugular venous pressure (JVP) displacements in the neck.] Furthermore, it is impossible from the physical exam alone to detect the presence of an ectopic atrial rhythm at a physiologic rate.
In describing the cardiac rhythm, we discourage use of the widely used term irregularly irregular because it has come to connote specifically atrial fibrillation. Thus, if you say that the pulse is irregularly irregular, you will imply to most observers a diagnosis of atrial fibrillation. However, on exam at four common distinct rhythms—sinus rhythm with frequent atrial or ventricular premature beats, wandering atrial pacemaker/multifocal atrial tachycardia, atrial flutter with variable AV conduction, and atrial fibrillation—all feel “irregularly irregular.” The two former rhythms are not indications of anticoagulation, whereas atrial fibrillation usually is. Other rhythms may cause considerable variability in heart rate as well. Finally, respiratory sinus arrhythmia—the phasic increase and decrease in heart rate due to alterations in vagal tone as a result of respiration—may cause the pulse to be variable over a period of seconds (Chapter 9).
Thus, these terminological suggestions are not meant as fussy distinctions without differences. Also, the use of “irregularly irregular” implies the presence of a companion set of rhythms that are “regularly irregular.” But the latter term would be considered baffling by most of your colleagues and is not used clinically. (Some advocate using this term for AV Wenckebach with its periodic cycles—we would advise reporting that the pulse was variable in a possibly periodic way.)
From an interpretive point of view, failure to appreciate the importance of a resting tachycardia can also lead to missed or belated diagnoses. The usual resting heart rate (“normal sinus rhythm” by ECG) is given as 60 to 100 bpm. However, sustained resting rates above 90 per minute in adults are actually fast and may be a clue to an important diagnosis, such as pulmonary embolism, heart failure, hyperthyroidism, infection, drug effects, anxiety, pain, or hypovolemia leading to shock. [Failure of the pulse to slow and blood pressure to “dip” during periods of non-REM (rapid eye movement) sleeping time is also abnormal. However, chronobiologic dynamics are rarely cited clinically.]
Like heart rate, system arterial blood pressure (BP) is a dynamic variable. This is evident when watching the monitor of a patient in the ICU who has a cannulized artery (“art line,” usually in a radial artery), and seeing the pressure variation from beat to beat. These values will be recorded in the chart (often called the flow sheet, with other parameters recorded), and the change in these values is often of paramount importance. For example, when a patient with urosepsis is admitted to the intensive care unit because of hypotension, knowing his blood pressure precisely on admission (e.g., 75/40 mmHg) and seeing the response to vasopressors is critical information. When reporting these vital signs, one might describe the BP as a range over time:
By contrast, on the wards, blood pressure (although still constantly in flux) is recorded—with a manual or automated BP cuff—only at a specified interval (e.g., every 8 hours, or every shift change). For example, one might report:
Finally, it is always recommended to repeat the blood pressure reading yourself with a manual cuff, especially if the values seem amiss. In addition, vital signs are dynamic—you may find that a patient may not be hypertensive and tachycardic when you repeat the vitals, which were taken initially after the patient rushed to an outpatient clinic visit from the parking lot, half a mile away. Repeating the initial BP and heart rate often yields values closer to “baseline.” Vital signs in the emergency department may change strikingly after admission and even during the initial evaluation process. For outpatient follow-up, serial BP measurements, if accurate, can be invaluable to check for “white coat” effects and to avoid overmedication. The accuracy of these measurements can be validated by having the patient bring his or her monitor to the office and simultaneously checking the two measurements. (How do you validate the accuracy of the sphygmomanometers that you rely on?)
The description above presents a kind of “first-order” description of the vital signs. Sometimes, these most fundamental of measurements, which seem very straightforward, contain hidden information that can be extracted by more probing analysis. A few examples are given below.
A subtle but important finding in heart failure, usually severe, is alternation of the amplitude of the systolic/diastolic blood pressures on a beat-to-beat basis (ABABAB …), usually accompanied by sinus tachycardia. This phenomenon, perhaps alluded to in the opening quote by novelist D.H. Lawrence, is called pulsus alternans (Figure 2.3). It has been related to abnormal calcium handling by dysfunctional myocardial cells, but the precise mechanism remains unknown. This finding is difficult to detect by a manual exam, although the savvy examiner may be able to detect alternating changes in the pulse amplitude at the bedside. If your patient is in the ICU or coronary care unit (CCU) with an intraarterial line, you may be able to see alternans on the monitor and record it. But you will notice pulsus alternans only by looking for it. What are the estimated sensitivity and specificity of this sign for the diagnosis of heart failure? The answer is that there is no glib answer. The answers will depend importantly on the severity of the heart failure syndrome and how it is measured (by exam or arterial line). The sign appears to be highly specific but not very sensitive, and its sensitivity goes up as the degree of heart failure worsens. Perhaps you can design a study in the CCU to investigate this question further in patients with arterial lines. While on the subject of pulsus alternans (and connecting with learning techniques in Chapter 11), do you know the meaning and mechanisms of signs with similar names but very different implications, including pulsus paradoxus, electrical alternans, and pulse deficit?
FIGURE 2.3 Pulsus alternans in a patient with heart failure.
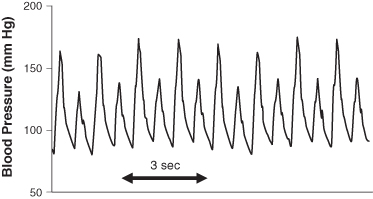
Beyond its association with heart failure, pulsus alternans is important because it exemplifies two general principles of the physical exam:
Respiration is probably the single least accurately recorded of the vital signs on the wards and in the clinics. Indeed, in most patients it is unlikely that it is even measured. The patient is quickly inspected and a default “normative” value of 12 to 20 breaths/min is recorded, or perhaps more than 20 if they look more tachypneic. If you want to generate some controversy and discussion, poll your colleagues, students, senior M.D.’s, and nurses on what they consider the normal resting breathing rate.
What is your resting breathing rate? How do you measure it, and does the act of observing yourself change it? Have a colleague measure your breathing rate simultaneously and see if it agrees with your self-measurement. A rate of 20 per minute is sometimes reported, as a kind of default setting, to indicate a normal respiratory rate. Actually, this tempo at rest usually represents tachypnea.
A few comments about commonly confused nomenclature: Dyspnea is the subjective sensation of being short of breath, or having difficulty breathing. This term applies to a symptom, not a sign. Tachypnea, or rapid breathing rate, is a sign that may be present with or without dyspnea. Thus, a patient may have an abnormally rapid breathing rate at rest and not complain of dyspnea. Conversely, a patient with a respiratory rate in the normal range may complain of considerable shortness of breath. Attendings should be aware of this common misperception and try to correct the terminology when noted.
In order of least acceptable to better, here is how breathing should not be counted:
The first two mistakes do not merit further comment. The third seems reasonable. However, watching a patient with your wristwatch or looking at the clock on the wall is awkward and may make you or the patient self-conscious. Further, depending on the degree of abdominal or chest breathing, it may be difficult to tell what is actually a breath, and then you have to start a recount. Also, respiration has a more voluntary component than the other vital signs: we may change the pattern of breathing or rate, or even hold our breath, when we feel we are being observed.
A useful clinical trick is to combine the respiratory rate calculation with the examination of the neck. Begin by politely ask the patient not to talk. After auscultating over the carotids and the thyroid for bruits, simply listen over the trachea. Inspiration and expiration cycles are usually quite clear. If you listen for 20 seconds and multiply by 3, a reasonably good average breathing rate is obtained. (Some clinicians favor counting respirations as unobtrusively as possible in concert with measuring the pulse rate.)
Another source of error is to miss central (Cheyne–Stokes breathing) or obstructive sleep apnea at the bedside (Figure 2.4). The reason is that with these common breathing abnormalities the rate changes dramatically over 30 seconds to 1 minute from relatively fast to zero if there is a frank apnea. Most clinical observers are understandably loath to record the breathing rate as zero, so if they are measuring respiration with periodic breathing they will wait until the patient has started breathing again, which will lead to an overestimate of the breathing rate. (One clue to this is seeing a recorded rate of 30 to 40 in a patient who is not in respiratory distress.) In a patient with periodic breathing, you should not record an average rate but, instead, note that respirations reveal periodic breathing, and, if you can, give a time to the duration of the apparent apneic phases (e.g., 15 seconds).
FIGURE 2.4 Periodic (Cheyne–Stokes) breathing. What is the respiratory rate? The answer is that the conventional notation of the number of breaths per minute is not meaningful here. Instead are the patient’s breathing cycles between slower and shallower breaths, culminating in an apneic period, and then faster and deeper breaths. This condition is most common in heart failure but may also be seen in other settings, including stroke and aging. A distinct but similar pattern of variable breathing occurs with obstructive sleep apnea.
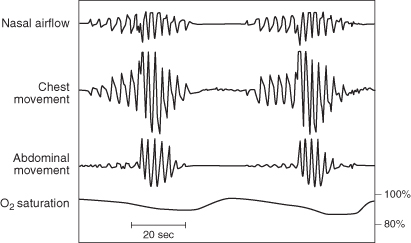
As you get more sophisticated, you will be able to detect pure obstructive apneas—with increased respiratory effort but no airflow—from pure central apneas where respiratory effort ceases periodically. However, keep in mind that many patients have mixed (complex) apneas that combine both mechanisms. Simply recognizing period-type breathing at the bedside will make you appear to be an Oslerian wizard. Be on the lookout for Cheyne–Stokes breathing in a patient with severe heart failure.
For intubated patients in intensive care units, mention should be made of the mode of ventilation, the respiratory rate (displayed on the ventilator), whether the patient is “overbreathing” the rate set by the ventilator, and other programmable features (e.g., positive end-expiratory pressure). Students should make more use of this visual display of data, which can help make their exams more objective and help take advantage of information not readily obtained by the traditional physical exam.
Any clinically important difference between a current vital sign and a baseline value, if available, must be flagged and noted in your presentation and write-up; for example, Mr. Paulsen’s weight is 83 kg compared with 72 kg reported three weeks ago. This statement motivates key follow-up questions: Is the increase real, in which case almost certainly due to marked fluid accumulation? Or, is it spurious, due to one or both values being erroneous, or inconsistent due to clothing?
Science is said to aspire to be more quantitative, not less. However, the connection of science with strict quantification is valid only if the measures have some meaningful, consistent, and reproducible interpretation. For many clinical aspects of the physical exam, we have come to use relatively meaningless or at best confusing semiquantitative measures.
A good example is answering the question: How much pedal edema does my patient have? Pedal edema is an important finding in multiple pathological conditions, including heart failure, renal failure, hepatic failure, primary venous insufficiency, and venous or lymphatic disease due to thrombosis or tumor. However, some degree of pedal edema can be a false positive due to physiological or clinically inconsequential venous insufficiency (e.g., mild lower extremity swelling after a prolonged period of standing).
The common practice of scoring edema on a scale of 0 to 5+ is essentially meaningless if there is no consensus on what this index means to you compared to your colleagues. What if your 5+ and my 4+ are identical and our 1+ scores are different? How do you circumvent the problem of scoring the amount of pedal edema in a simple, reproducible, yet meaningful way, a subject that is almost never taught in physical diagnosis courses? A useful solution to this problem is to qualitatively rate pedal edema as trace, mild, moderate, and marked, and then actually measure an area at a given level relative to the ankles and record the circumference of this pedal region in centimeters. In this way, the next observer who comes to the bedside can replicate your measurements, + or − the inherent error in the measure. You can accommodate this standard error by approximating and writing “∼cm.” Perhaps you can think of an alternative way to add rigor to this everyday measurement. You can start by doing a simple study of observer variability in rating of pedal edema on the wards.
Clinicians too often toss around phrases like “I heard a grade II systolic/diastolic murmur” without any additional information. Such a statement is not very helpful or informative. What can you say that will be meaningful? You should give not only the intensity of murmurs but also state the patient’s position (supine, left lateral decubitus, sitting, squatting, etc.), the quality (soft, harsh, blowing, etc.), and the specified anatomical location (e.g., left parasternal area or apex); a change with position (e.g., aortic insufficiency murmurs are often heard best and louder when the patient leans forward, and a murmur of hypertrophic obstructive cardiomyopathy may increase with a Valsalva maneuver); and finally, the temporal nature of the murmur (early, mid, or late systolic, holosystolic, diastolic, etc.). Savvy listeners may comment on the “dynamics” of the murmur, such as crescendo–decrescendo, or late-peaking.
In this instance, it is perfectly appropriate, and perhaps even preferable, to rate the intensity of the murmur in one of three categories: soft, moderate, or loud. A reasonable statement would be:
A cardiologist listening to this report would be grateful for a rigorous description of a probable mitral regurgitant murmur. However, she or he will keep in mind the possibility that it could also be the description of an aortic stenosis murmur with the high-frequency components being transmitted preferentially to the apex, a finding referred to as the Gallavardin phenomenon.
The murmur of aortic stenosis may change in quality and become musical in its propagation to the cardiac apex.
—JEAN PIERRE GALLAVARDIN (1875–1957)
The Gallavardin sign is interesting from a more general physical diagnosis point of view in that it illustrates a phenomenon that simultaneously reduces the sensitivity of the exam for one diagnosis (possibly missing aortic stenosis) and decreasing the specificity for another (false-positive sign of mitral regurgitation).
Another example of a useful statement could be:
This finding would be classic for aortic regurgitation.
Use of the official American Heart Association grading system of 1–6/6 is useful only if you know what the numbers actually mean. Since most observers in training do not, calling a murmur 4/6 when it is actually 2/6 is misleading. Of note, young or less experienced examiners may not hear or barely hear a murmur and thereby undercall it, while that same murmur will be clearly audible to a more experienced auscultator.
For those who are interested, the official rating system of heart murmurs appears in Table 2.1. Important to note, but not well appreciated, is the fact that the same grading system is used for systolic, diastolic, and continuous murmurs. However, it is becoming increasingly common to grade diastolic murmurs based on a 4-point scale, given that they are rarely above 3/6 in intensity.
TABLE 2.1 Gradations of Cardiac Murmurs
Source: American Heart Association.
| Grade | Description |
| 1 | Very faint, heard only after listener has “tuned in”; may not be heard in all positions |
| 2 | Quiet, but heard immediately after placing the stethoscope on the chest |
| 3 | Moderately loud |
| 4 | Loud, with palpable thrill (i.e., a tremor or buzzy vibration felt on palpation) |
| 5 | Very loud, with thrill; may be heard when stethoscope is partly off the chest |
| 6 | Very loud, with thrill; may be heard with stethoscope entirely off the chest |
Caution: If someone says that he or she is hearing a 4/4–6 diastolic murmur, there is a good chance that this statement is in error—perhaps it is a systolic murmur, perhaps it is an artifact, or perhaps it is a loud diastolic murmur that is overrated as to intensity.
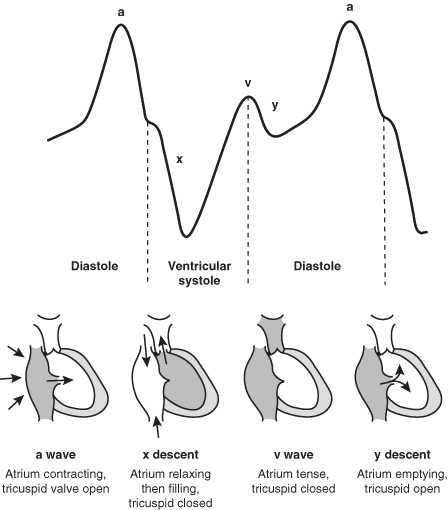
Central venous pressure (CVP) (Figure 2.5) is yet another example where pseudoquantitation is more the rule than the exception. CVP is a key indicator of cardiopulmonary physiology and pathophysiology as well as of overall volume status. Attempts to measure CVP at the bedside of the mean CVP are perhaps the least reliable numbers generated in a routine exam. Indeed, when applied to CVP, the term measures is a misnomer, as these numbers are at best estimates. “Evidence-based” studies of CVP, nicely summarized by Dr. Deborah J. Cook and Dr. David J. Simel in their 1996 JAMA article, confirmed poor sensitivities and specificities for this vital part of the exam when compared with actual hemodynamic measurements.
FIGURE 2.5 Sequential phases of central venous pressure. Two major positive waves (a and v) are present with two negative deflections (x and y) related to atrial and ventricular hemodynamics. These waves and descents are very challenging, even for experts, to decipher at the bedside. They are best analyzed as printouts (requiring an indwelling catheter in the right atrium), with a concomitant ECG recording.
From Longmore M, Wilkinson I, Torok E (eds.). The Oxford Handbook of Clinical Medicine, 5th Ed. Oxford, UK: Oxford University Press, 2001, p. 79. Reproduced with permission.
At least five factors are responsible for this confusion and for substantial errors that may affect patient management:
Finally, it should be mentioned that the neck vein examination is extremely challenging, even to seasoned practitioners. In your early stages of training, simply being able to assess whether the CVP is normal, high, or low is an accomplishment.
FIGURE 2.6 Right ventricular pressure tracing in constrictive pericarditis with the square root sign.
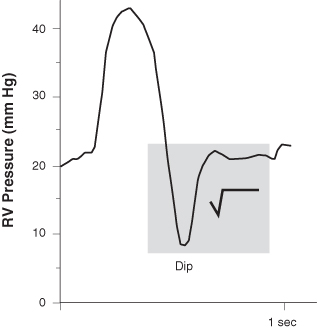
Comment: The correct and lifesaving diagnosis here was reached only by readdressing a history that had been propagated via chart lore and possibly cut-and-paste write-ups. The re-look was prompted by a physical exam by an unbiased new team member that revealed an outlier finding (Chapter 10): prominent jugular venous distention. The often-subtle but critical finding subverted the long-held diagnosis of alcoholic cirrhosis (or would have required two diseases, e.g., cardiomyopathy and cirrhosis) and led, finally, to the correct diagnosis of constrictive pericarditis.
When you make an assessment on exam, such as CVP amplitude or hepatic enlargement, how confident can you be that the finding or the estimate of its magnitude is reasonably valid? You can employ at least three complementary approaches to increase your level of certainty:
The easiest way to increase your level of certainty is simply to go back to see if the findings are reproducible. Reproducibility is a central aspect of the scientific method. The physical exam is a series of complex, interwoven mini-tests and hypothesis-testing exercises. Can you replicate your own findings? In the case of measurements such as CVP, checking them in different positions is very helpful. The meniscus of visible venous waves should decrease as the patient sits more upright. A second strategy, when available, is to use relatively independent (multimodal) techniques to confirm a finding. A good example is in the estimation of hepatic size. There are at least three methods: percussion, palpation, and the “scratch test.” It is very reassuring if the estimated boundaries of the liver are comparable using all three. A third approach is to ask for a second opinion from a colleague blinded to your call.
Keep in mind, however, that some findings are notoriously unstable and evanescent, such as pericardial friction rubs, which may come and go and are often position dependent. Not hearing a rub at one time and hearing it later, or vice versa, does not disprove its existence. Having an independent observer confirm a finding that may be transient is very helpful.
One of the themes of this book on the interstitial curriculum is the paucity of attention paid to addressing uncertainty in all aspects of medicine, well beyond the notions of sensitivity, specificity, and predictive values of a given physical finding or lab test. On the one hand, we would like to purge uncertainty from our judgments to make them as scientific and error-proof as possible. Yet, as we have seen, the science itself is based, from the micro to the macro levels, on varied sources of uncertainty. In some respects, medicine is definable as the science of uncertainty as applied to health and disease.
The collision of fact with physical finding can be unsettling, as, for example, when you state that there was no “organomegaly,” but the abdominal ultrasound reveals hepatosplenomegaly. Students should be led away from making statements such as “no murmurs were heard” or “the thyroid was normal” to making more scientifically accurate ones, such as “I did not hear any murmurs” and “To my exam, the thyroid was not enlarged and without nodules.” Similarly, a more rigorous statement is always that “no organomegaly was appreciated or detected by palpation.” Such statements accommodate the limitations of the particular examiner and of the physical examination in general.
The performance and presentation of the physical exam by students and house staff pose major challenges for attendings. These are analogous to those discussed at the end of Chapter 1 regarding the history. A major preoccupation is assessing the validity and reliability of the findings and deciding which ones need the most careful rechecking and vetting. It is important to encourage the students’ and residents’ examination skills and commitment to their findings, as it is increasingly common to place more emphasis and complete reliance on noninvasive imaging studies (e.g., CT scans, transthoracic echocardiograms), with the pernicious side effect of deemphasizing the importance of the exam. Bedside rounds can be an excellent opportunity for reevaluation with concomitant evidence-based teaching.
Note
*Failure of the CVP to fall upon inspiration is an indicator of reduced right heart compliance and is seen in three major contexts of severe diastolic dysfunction: restrictive cardiomyopathies such as cardiac amyloidosis or sarcoidosis, constrictive pericarditis, and right ventricular infarction. The morphology of the waves (A, V, and the X and Y descents) is complex and very difficult to assess at the bedside, even for experts, without a waveform recording. Sustained elevation of the CVP with upper abdominal pressure, and failure to fall after pressure is released, are markers of reduced right heart compliance.