Chapter Three
The Right Price
No price is too low for a bear or too high for a bull.
Unknown
Here we turn to the counter balance of volume which is price, and forgive me for a moment if we return to Jesse Livermore and one of his many quotes which I mentioned at the start of this book:
“there is nothing new in Wall Street. There can't be because speculation is as old as the hills. Whatever happens in the stock market today has happened before and will happen again”
To use and paraphrase this famous quote, I would say there is nothing new in trading. As I said in chapter one, Volume Price Analysis has been around for over 100 years. The same is true when we consider the analysis of price, and the only representation of price which truly changed how traders studied and analysed charts was in the introduction of candlestick charts in the early 1990's.
Fads come and go in trading. Something that was in 'vogue' a few years ago, is no longer considered valid, and some 'new' approach is then promoted. One approach which is being marketed heavily at the moment is 'price action trading' or PAT. This is as it sounds. Trading using an analysis of price, with no (or very few) indicators, which I find strange. And my reasons are as follows.
Imagine suggesting to Jesse Livermore, Charles Dow, Richard Wyckoff, and Richard Ney, that we had devised a new and exciting way to analyse the markets. The ticker tape print out would now ONLY show the price, but NO volume. I'm sure Jesse and the others would have been struck dumb at such a suggestion. But don't worry. In this book I explain price action trading, which is then validated with volume. So you get two approaches for the price of one.
However, I digress. Living close to London as I did at the time, and just a stone's throw away from The President, was the old LIFFE building, the London International Financial Futures and Options Exchange, now no more. As a frequent visitor to this part of London, I would often drive past this exchange, and at any time during the day, would see the traders in their different brightly coloured jackets, dashing out to grab coffees and sandwiches before rushing back to the floor of the exchange. Without exception these were generally young men, loud and brash, and in fact on the corner of Walbrook and Cannon Street there now stands a bronze statue of a floor trader, mobile phone in hand. These were the days of fast cars, and aggressive trading, and it was ironic this was the world where I started my own trading career, with FTSE 100 futures orders filled on the floor of the exchange.
This was the world of adrenaline pumped traders, yelling and screaming using unintelligible hand signals, buying and selling in a frenetic atmosphere of noise and sweat. It was positively primordial where the overriding emotion emanating from the floor was fear, and obvious to anyone who cared to view it from the public gallery.
However, the advent of electronic trading changed all of this, and the LIFFE exchange was one of many casualties. All the traders left trading and moved away from the pit, and onto electronic platforms. The irony is that most of these traders, and I've spoken to many over the years, failed to make the transition from pit trading to electronic trading, for one very simple reason.
A pit trader could sense not only the fear and greed, but also judge the flow of the market from the buying and selling in the pit. In other words, to a pit trader, this was volume or order flow. This is what a pit trader saw and sensed every day - the flow of money, the weight of market sentiment, and the trading opportunities that followed as a result. In other words, they could 'see' the volume, they could see when the big buyers were coming into the market and ride on their coat tails. This is the equivalent of volume on the screen.
However, without being able to see, judge, and feel the flow in the pit, most of these traders failed to make a successful transition to screen trading. Some succeeded, but most were never able to make the move from an environment where price action was supported by something tangible. Whether they would call it activity, order flow, sentiment, or just the 'smell of the market' this is what brought the price action to life for them, and why they struggled to succeed with the advent of the electronic era.
Pit trading still continues today, and if you do get the chance to view it in action, I would urge you to do so. Once you have seen it for real, you will understand why volume is so powerful in supporting price, and why I believe the exponents of PAT are simply promulgating something different for the sake of it.
Whilst it is undoubtedly true to say price action encapsulates all the news, views and decisions from traders and investors around the world, and that with detailed analysis we can arrive at a conclusion of future market direction, without volume we have no way of validating that analysis of price. Volume gives us our bearings, it allows us to triangulate the price action and to check the validity of our analysis. This is what the pit traders of old were doing – they would see a price move, validate it by considering the order flow in the pit, and act accordingly. For us, it is the same. We simply use an electronic version of order flow which is the volume on our screens.
But, let me give you another example.
Returning to our auction again, but this time there is no physical sale room. Instead we are joining an online auction, and perhaps now you can begin to imagine the problems that the ex pit traders encountered. We have moved from the physical sale room, where we can see all the buyers, the number of people in the room, the phone bids and the speed of the bidding. In a physical sale room we also get a sense of where the price starts to pause. We see bidders become fearful as the price approaches their limit and they hesitate with the next bid, just fractionally, but enough to tell you they are near their limit. This is what the pit traders missed.
In an online auction we are logged in and waiting for the auction to start. An item we want to buy appears and we start bidding. We have no idea how many other bidders are there, we have no idea if we are playing on a level playing field. All we see is the price being quoted. The auctioneer, for all we know, could be taking bids 'off the wall' (fake bids in other words) which happens more often than many people think. The reason is that all good auctioneers like to encourage auction fever – it’s good for business, so they use every trick in the book.
Meanwhile back to our online auction. We continue bidding and eventually win the item.
But, have we got our item at a good price? And, in this scenario we are only referring to price and not value, which is a very different concept. Besides, I hope by now, you are beginning to get the picture. In the online auction all we see is price.
Therefore, in a real online ‘auction’ of trading, do we really want to base our trading decisions solely on price? Furthermore, the great iconic traders of the past would have given us their answer, and it would have been a very emphatic NO.
Once again I accept it is an imperfect example, but one which I hope makes the point.
To me, a price chart with no volume is only part of the story. Price does encapsulate market sentiment at a given and precise moment in time, but with so much market manipulation prevalent in so many markets, why ignore such a valuable tool which is generally provided free.
Whilst price is a leading indicator, in itself, it only reveals what has gone before, from which we then interpret what is likely to happen next. Whilst we may be correct in our analysis, it is volume which can complete the picture.
In a manipulated market, volume reveals the truth behind the price action. In a pure market, volume reveals the truth behind market sentiment and order flow.
So, let's take a closer look at price, and in particular the effect that changes in technology have had on the four principle elements of a price bar, the open, the high, the low and the close. And the most significant change in the last few years has been the move to electronic trading, which has had the most profound effect on two elements of the four, namely the opening and closing prices.
Scroll back to the days of Ney and earlier, and the markets in those days only traded during a physical session. The market would open when the exchange opened, and close when the exchange closed at a prescribed time. Trading was executed on the floor of the exchange, and everyone knew when the market was about to open or close. This gave the opening and closing prices great significance, particularly on the open and close of the day. The opening price would be eagerly awaited by traders and investors and, as the closing bell approached, frenetic trading activity would be taking place as traders closed out their end of day positions. This is now generally referred to as regular trading hours (RTH), and is the time the exchange is physically open. Whilst this principle still applies to stock markets around the world, with the NYSE trading from 9.30am to 4.00pm, and the LSE open from 8.00 am until 4.30 pm, what has revolutionised the trading world is the advent of electronic trading.
The platform that really changed the game was Globex, introduced by the CME in 1992, since when virtually every futures contract can now be traded 24 hours a day. Whilst the cash markets, such as stocks, are restricted to the physical time set by the exchange, what has changed, certainly with regard to this market, has been the introduction of electronic index futures, which now trade around the clock. What this means, in effect, is that the opening and closing prices of the cash market are now far less important than they once were.
The reason is simply the introduction of Globex, as electronic trading has become the standard for index futures, which are derivatives of the cash market indices. The ES E-mini (S&P 500) was the first to be introduced in 1997, followed shortly after by the NQ E-mini (NASDAQ 100) in 1999, and the YM E-mini (Dow Jones 30) in 2002. With these index futures now trading overnight through the Far East and Asian session, the open of the cash index is no longer a surprise with the futures signalling overnight market sentiment well in advance. By contrast, in the days before the advent of electronic trading, a gapped open, up or down, would have given traders a very strong signal of market intent. Whereas today, the open for the major indices is no longer a great surprise as it is forecast by the overnight futures markets.
Whilst it is certainly true to say that individual stocks may well react for a variety of reasons to sentiment in the broad index, generally all boats tend to rise on a rising tide, and therefore likely to follow suit. The open and the close for individual stocks is still significant, but the point is that the index which reflects market sentiment will be broadly known in advance, making the open less relevant than it once was.
The same could be said of the closing price. When the physical exchange closes, stocks are closed for the day in the cash markets, but electronic trading continues on the index future and moves on into the Far East session and beyond.
This facet of electronic trading also applies to all commodities, which are now traded virtually 24 hours a day on the Globex platform, and both currency futures and currency spot markets also trade 24 hours a day.
The electronic nature of trading is reflected in the price chart. Twenty years ago, gap up or gap down price action would have been the norm, with the open of a subsequent bar closing well above or below the close of the previous bar. These were often excellent signals of a break out in the instrument, particularly where this was confirmed with volume. Such price action is now rare, and generally restricted to the equity markets, which then catch up when the physical exchange opens the next day. Virtually every other market is now electronic such as the spot forex market, and as we have just seen, indices catch up with the overnight futures as do commodities and other futures contracts.
The open of one bar will generally be at exactly the same price as the close of the previous bar, which reveals little. This is one of the many effects that electronic trading is now having on price action on the charts, and is likely to continue to have in the future. Electronic trading is here to stay, and the significance of these elements of price action in various markets will change as a result.
If the market is running 24 hours a day, then the open of one bar will simply follow the close of the previous bar, until the market closes for the weekend. From a price action trading perspective, this gives us little in the way of any valid 'sentiment' signals, which makes volume even more relevant in today's electronic world, in my humble opinion at any rate.
However, let's take a look at an individual bar in more detail, and the four elements which create it, namely the open, the high, the low and the close, and the importance of these from a Volume Price Analysis perspective. At this point I just want to confirm the only price bars I use in the remainder of this book, and in my own trading are candlesticks. This is what Albert taught all those years ago, and it is how I learnt.
I have tried bar charts and thought I could dispense with candles. However, I have returned to candles and do not plan to use any other system, for the foreseeable future. I do understand that some traders prefer to use bars, line charts, Heikin Ashi, and many other. However, my apprenticeship in Volume Price Analysis was with candlesticks and I believe its true power is revealed when using this approach. I hope, by the end of this book you too will agree.
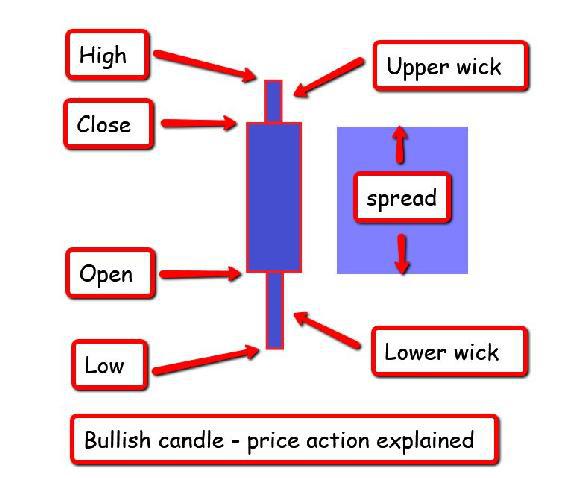
Therefore, I want to start by dissecting a typical candle and explain how much we can learn from it. In any candle, there are seven key elements. The open, high, low and close, the upper and lower wicks and the spread as shown in Fig 3.10. Whilst each of these plays a part in defining the price action within the time frame under consideration, it is the wicks and the spread which are the most revealing in terms of market sentiment, when validated with volume.
Fig 3.10
A Typical Candle
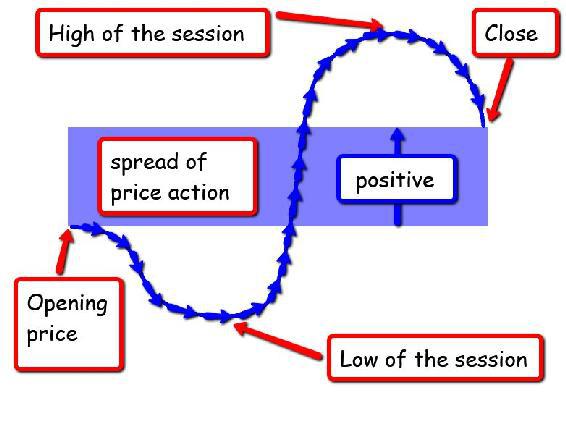
Perhaps the simplest way to visualise the price action contained within a candle, and is applicable regardless of timeframe (from a tick chart to a monthly chart), is to display the price action, as a sine wave, with the market oscillating back and forth, as buyers and sellers battle for supremacy.
The image in Fig 3.11 is a visual representation of this price action and in this case it is the buyers who are triumphant. However, the price action could have taken a different journey in creating this candle. It is the completed candle which is important.
Fig 3.11
Price Action As A Sine Wave
Let's start with the spread which reveals the sentiment for that session.
A wide spread between the open and the close indicates strong market sentiment, either bullish or bearish, depending on whether the closing price finished above the opening price or below it.
A narrow spread between the open and the close indicates sentiment which is weak. There is no strong view one way or the other. The wicks to the top and bottom are indicative of change. A change in sentiment during the session. After all, if the sentiment had remained firm throughout, then we would have no wicks at all. This is the equivalent of our online auction, or physical auction, where the price opens at one level, and closes at a higher level once sold. The price action would simply create a solid candle with no wick to the top or the bottom, and in the context of trading, suggesting strong and continued sentiment in the direction of the candle.
This is the power of the wicks and why, when used in combination with the spread, reveal so much about true market sentiment. It forms the basis of price action trading, which is perfectly valid in it's own right.
However, why stop at this point and refuse to validate the price action with volume? This is something I simply cannot understand and perhaps any PAT traders reading this book can convince me otherwise. Just drop me an email as I am always happy to learn.
So, as you can see, the length and context of the wick, whether to the upside or the downside is paramount in Volume Price Analysis, and the easiest way to explain this is to consider some further visualisation examples, which will help to make the point.
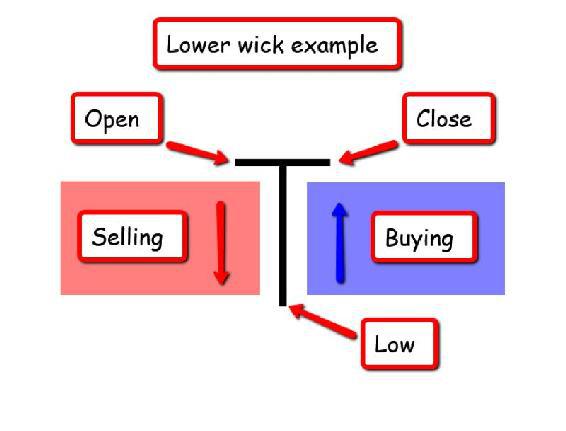
Let’s take two examples and the first is in Fig 13.12. Here we have a wick where the price has opened, the market has moved lower, and then recovered to close back at the open price. In the second example in Fig 13.13 we have a wick where the price has opened, the market has moved higher and then moved lower to close back at the open.
Let's analyse what's happening here with the price action and market sentiment. In both cases we can be certain that this is the profile of the price action, since the closing price has returned to the original opening price. So there is no guesswork. It is true that within the price action, there may have been ups and downs, pull backs and reversals, but at some point in the session, the price action hit a low, or a high and then returned to the original starting point.
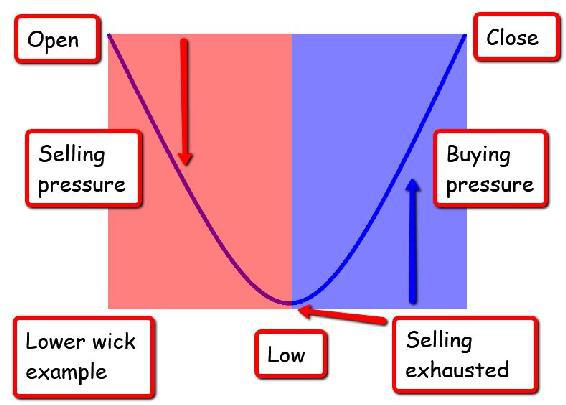
Lower Wick Example
Fig 3.12
Lower Wick Example
Taking the lower wick example first, the price bar opened and almost immediately sellers were in the market forcing the price lower, and overwhelming the buyers. Perhaps within the move lower, there were pauses and brief attempts to rally, which would have been seen in faster time frames, and a key part of trading. However, in this session, as far as we are concerned in this example, the sellers remained in control throughout the first part of the candle’s creation.
At some point during the course of the session, the buyers started to come back into the market, wrestling control from the sellers as the market price had now become an attractive buying proposition. Gradually near the bottom of the price bar, the sellers finally give up, having been overwhelmed by the buyers who slowly take control. Now it's the turn of the sellers to be under pressure, as more and more buyers flood into the market, overwhelming the sellers and taking the price higher, to finally close at the opening price.
But, what does this price action reveal? And the answer is two very important things.
First, in this session, whatever the time frame may have been, there has been a complete reversal in market sentiment. Why? Because the selling pressure that was in evidence during the first part of the candle’s creation, has been completely overwhelmed and absorbed in the second half.
Second, the sentiment on the close of the bar is bullish – it has to be, since we know the price action closed at the open, so at the instant of closure, the price must have been rising, supported by all the buying pressure underneath.
Does this mean this is signalling a reversal in any trend? The short answer is no, and you will discover why once we start looking at volume, which will then give us the complete picture. At the moment we are simply considering price action which is only half the picture, but the point I want to make is that the wick on a candle is EXTREMELY
important, and a vital part of Volume Price Analysis, as is the spread. In this case the spread was zero, which is JUST as significant as any large spread of the candle.
I hope the above example has helped to explain what is happening 'inside' the candle with the associated price action. This is a very simple example, with the price action split symmetrically into a 50/50 window. Nevertheless, the principle holds good. The price action may have been split into a 25/75 or even a 15/85, but the point is this – the sellers were overwhelmed by the buyers during the course of the session the candle is representing, which could be from minutes to days or weeks.
This brings me to another area of volume analysis which we are also going to consider later in the book. I've already mentioned Volume Price Analysis or VPA several times so far, which is the relationship between volume and price over the entire life of the candle, but what happens within the life of the candle for example. Where is the buying and selling actually taking place, and this is called Volume At Price, or VAP for short.
Whilst VPA focuses on the 'linear relationship' between volume and price once the candle has closed, VAP focuses on the volume profile during the creation of the price bar. In other words, 'where' has the volume been concentrated within the associated price action. This introduces the concept of time to the relationship.
We could say that VPA is our big picture of the volume price relationship on the outside of the candle, whilst VAP gives us the detail of the volume profile, 'inside' the candle. This helps to give us an additional perspective on our 'outside' view – two views of the same thing, but from different perspectives, with one validating the other. A further triangulation of the volume and price relationship.
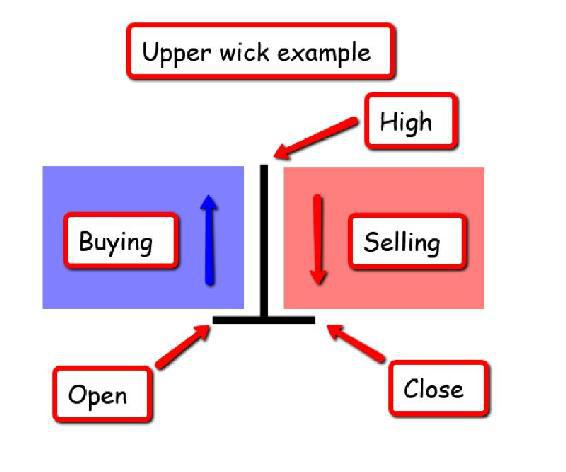
Now let's look at our other example, which was the upper wick.
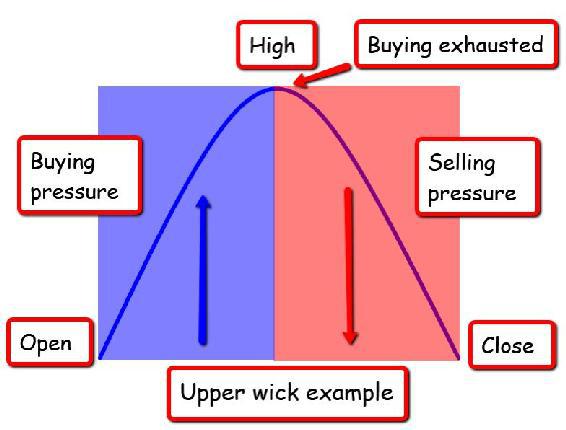
Upper Wick Example
Fig 3.13
Upper Wick Example
In this example the market opened with the buyers immediately taking control, forcing the price higher and overcoming the sellers, who are compelled to admit defeat under the buying pressure. However, as the session develops the price action reaches a point at which the buyers are beginning to struggle, the market is becoming resistant to higher prices and gradually the sellers begin to regain control.
Finally, at the high of the session, the buyers run out of steam and as the sellers come into the market, the buyers close out their profits. This selling pressure then forces prices lower, as waves of sellers arrive.
The candle closes back at the open price and the session closes. Once again, there are two key points with this price behaviour which are fundamental.
First, we have a complete reversal in market sentiment, this time from bullish to bearish. Second, the sentiment at the close is bearish, as the open and closing price are the same.
Again, this is a stylised view of the price behaviour. Nevertheless, this is what has happened over the session of the candle, and it makes no difference as to what time frame we are considering.
This could be a candle on a tick chart, a 5 minute chart, a daily chart or a weekly chart, and this is where the concept of time comes into play. This type of price action, accompanied with the correct volume profiles, is going to have a significantly greater effect when seen on a daily or weekly chart, than when seen on a 1 minute or 5 minute chart.
This is something we will cover in more detail in the next few chapters.
But, what does this price action look like on a price chart in candle form?
Lower Wick Example
Fig 3.14
Candle From Lower Wick Example
Although the resulting candle doesn’t look very exciting it actually represents one of the most powerful price actions you will find on any chart, particularly when volume analysis is added to it. Price action and volume then tell us where the market is likely to go next.
And here is another, equally powerful candle.
Upper Wick Example
Once again, this is an extremely important price pattern, which we will return to time and time again throughout the book.
Fig 3.15
Candle Resulting From Upper Wick Example
And this is where, for price action trading, the book might stop. After all, we can now visualise the buying and the selling simply from the price action of the wick on the candle. But what of course this does NOT
reveal, is the strength of this price action, and perhaps even more importantly, whether this price action is valid. Is the price action genuine, or is it false, and if it is genuine, what is the strength of any consequent move likely to be? This is why I feel price action trading only tells half the story. It is volume which completes the picture. And in the next chapter we start to consider volume from first principles.