Chapter Twelve
Volume And Price – The Next Generation
My biggest winnings were not in dollars but in the intangibles: I had been right, I had looked ahead and followed a clear cut plan.
Jesse Livermore (1877-1940)
I began this book by stating there is nothing new in trading, and indeed this is certainly true in terms of volume. Its foundations were laid by the iconic traders of the last century, and since then, little has changed. The methodology remains as valid today, as it was then. The only changes have been in technology and markets. Other than that, we use the same principles as they used, all those years ago.
However, that said, as a devotee of volume, I am constantly looking for developments in this analytical approach to the market, which has formed the cornerstone of my own trading career. I would be foolish to ignore them. After all, candlesticks were virtually unheard of in Western trading before the 1990’s - now they are the ‘de facto’ standard for technical traders.
Therefore in this final chapter, I would like to introduce you to some of the latest developments in volume and price analysis, which are both new and innovative. I have not used these myself, so cannot comment on their validity, but feel it is important to present them here, and as this book is updated in future versions, I can then add further chapters as these techniques develop and perhaps incorporate them into my own trading.
Equivolume Charts
The volume price approach termed ‘equivolume’ was developed by Richard Arms and first published in his book, Volume Cycles In The Stock Market, written in 1994. The concept is one in which volume is considered to be more important than time, and as such the X axis of the chart is replaced with volume, whilst the Y axis remains as before with price. The principle idea is that in adopting this approach in presenting the price and volume relationship on the chart, this emphasizes the relationship, with volume moving to the chart itself, where it joins price, rather than as an isolated indicator at the bottom of the chart. As a result, and with the change in the X axis from time, to volume, the ‘time’ element is removed and the focus is then solely on the volume price relationship.
This relationship is then presented in the form of ‘boxes’. The vertical element of the box, in other words the height, is simply the high and low of the session in terms of price. The horizontal element is volume, which of course varies, as to whether this is ultra high, high, medium or low, which in turn means the width of each box varies. On our chart we no longer have candles, but a series of boxes, both narrow and fat, tall and short which represent the direct relationship between volume and price in a very visual way, but with the time element removed. The time element is still there, but on a separate axis below, otherwise it would be impossible to know where we are on the chart.
As Arms himself said:
‘if the market wore a wristwatch, it would be divided into shares, not hours’
and indeed in some ways this sums up the concept of trading on tick based charts which I mentioned in an earlier chapter. After all, time is a man made concept, and something the markets can and do ignore. The beauty of trading on a tick chart is that it is the market dictating the ‘speed’ of the market. In other words, on a tick chart, we are trading in harmony with the market. When we move to a time based chart, it is we who are dictating to the market our chosen timeframe, a subtle but important difference. On a tick chart we trade at the speed of the market - on a time based chart we don’t.
This same philosophy can be applied to equivolume, which attempts to remove the rather ‘false’ aspect of time from the analysis, to create a purer and more meaningful relationship between the two elements of volume and price.
Let’s take a look at how these boxes are created and what they actually tell us about the volume price relationship. Below is a schematic in Fig 12.10
Fig 12.10
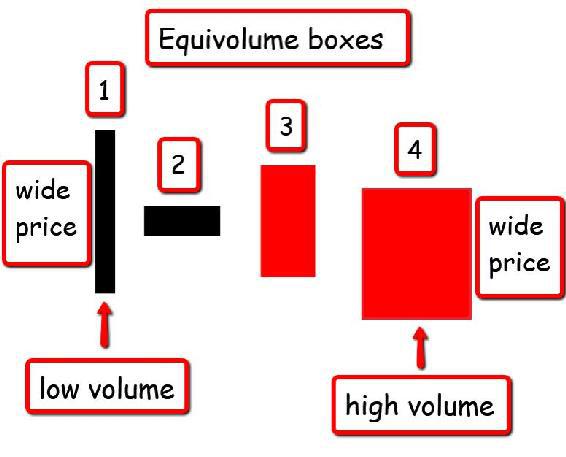
Equivolume Boxes
Remember, the X axis for each box is volume and the Y axis is price, so if we look at box 1, here we have a narrow but tall box. In other words, the volume has been low, but the price action has been wide, so this might be equivalent to a wide spread up candle on low volume, so an anomaly.
Next to this in box 2, we have the opposite, where we have a small change in price, and remember we are talking here about the high and the low, and not the open and the close, coupled with a large amount of volume. This too might be equivalent to an anomaly where we have above average or high volume and a narrow price spread.
Box 3, might be considered representative of a ‘normal’ volume and price relationship, with good volume supporting a solid price change. Finally in box 4, we have extremes of both volume and price. The box is wide, so above average volume and the price is wide as well, so clearly effort and result are in agreement here, as they are in box 3.
The color of the boxes is dictated by the close. When the close is above the previous close, the box is painted black, and when the close is below the previous close, it is painted red.
In order to maintain aspect ratios and to keep the charts meaningful, the volume is normalized by dividing the actual volume for the period by the total of all the volume displayed on the chart. Whilst time has been removed from the boxes themselves, it still appears, to help keep the chart in context for the trading session.
Whilst it is difficult to imagine trading using these boxes and moving away from candlesticks, many of the techniques I have explained in this book will still apply, as they are equally valid. The focus using this approach is on the box, its shape and location within any trend. Breakouts from congestion are just as important for equivolume trading as with more conventional VPA, and here we might expect to see what is often referred to as a “power box”, which is high volume and wide price. In VPA terms, above average volume and a wide spread candle on the breakout from congestion. The principles are much the same, it’s the display which is very different.
At this point let me add my own personal thoughts here.
Whilst I like the concept of showing the price and volume together on one ‘box’ which instantly reveals whether we have a high/low combination, anomalies, or an average/average combination which may be normal, the issue I have is the removal of time. After all, as Wyckoff himself stated, it is the cause and effect which holds the key to the development of the trend. In other words, time is the third element of the volume and price relationship. Remove time, and the approach becomes two dimensional, and not three dimensional, and as I hope I have made clear throughout the book, the longer a market is in a consolidation phase, the greater will be the consequent trend once the market breaks out. Consolidation phases are where trends are born or pause before moving on, and if you remove the time element, then to me, this removes one of the pillars of Volume Price Analysis which is the judgment of the power of any subsequent trend.
This is just my own personal view, and I would encourage you to explore the idea of equivolume further for yourself. The other issue is that candlestick analysis no longer plays a part, but help is at hand here, with candle volume charts.
Candle Volume Charts
Candle volume charts are exactly as they sound, and are a hybrid version of equivolume and traditional candlestick charts. In other words, the ‘box’ of equivolume is then laid over a candlestick with the traditional open, high, low and close, to create a unique chart. This charts displays candles of varying width and height due to the volume aspect, but with the upper and lower wicks added. A combination of both approaches which is shown in the schematic below in Fig 12.11
Fig 12.11
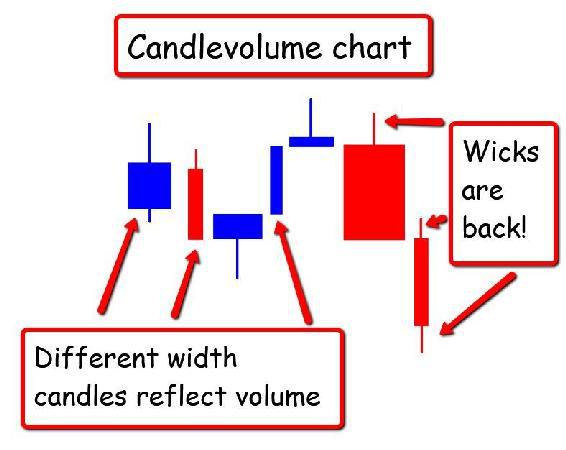
Candlevolume Chart
A little more recognizable perhaps. On these charts the candles are now all different widths to reflect the volume on each candle, with the price action represented vertically as usual, but with the open, high low and close displayed. On this chart we see our traditional wicks to the top and bottom of each candle. This is not an approach I have studied personally in any great detail, but it may have some advantages, and at least overcomes what I consider to be one of the big drawbacks with equivolume, namely the lack of time, which I believe is fundamental to any VPA approach. However, I always keep an open mind, and if any readers of this book have used candlevolume and have found this system helpful, please do drop me a line and send me your thoughts and comments. You can never stop learning in trading.
Delta Volume
Finally just to round of this chapter on the ‘future’ for Volume Price Analysis, there are two further approaches to analyzing volume which are gaining some traction, and these are delta volume and cumulative delta volume.
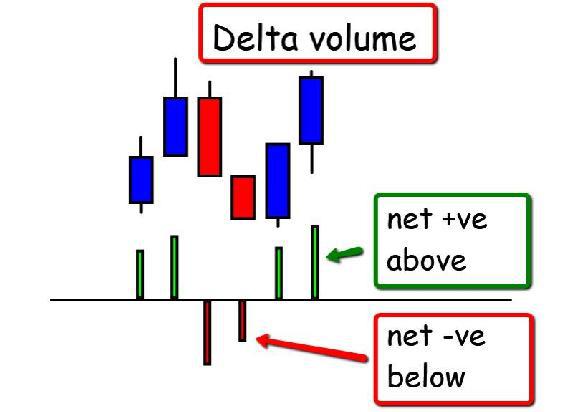
In simple terms delta volume refers to the difference in volumes between those contracts that trade at the ‘ask’ and those that trade at the ‘bid’. In other words, orders that are sell orders and those that are buy orders, with the net difference between the two then displayed as ‘delta’. For example, if the software calculates on one bar there have been 500 contracts sold at the bid and only 200 contracts bought at the ask, this would represent a net difference of 300 contracts sold. Any indicator measuring delta volume would display this as a negative volume bar of -300 and generally these appear as shown in the schematic below in Fig 12.12
Fig 12.12
Delta Volume
From this schematic the delta volume gives an indication of the net difference between the buying and the selling as the market moves higher and lower. In other words, yet another way of interpreting the volume and price relationship. This approach is ideally suited to those markets where there is an open exchange, such as for futures and equities.
Cumulative Delta Volume
Finally cumulative delta volume collects all the delta data and adds each subsequent bar to that of the previous bar - summing the totals in other words, and then presents this as a series of bars, to provide a perspective on the daily or intra day price action. In other words, it attempts to give a perspective on the strength of the buying or selling associated with the price action.
Delta and cumulative delta are relatively new in the world of Volume Price Analysis and as such, neither is generally available free as a standard indicator. This may change in the future, and as we move forward over the next few years, I believe delta and its derivatives may be increasingly adopted for certain markets. One market that springs to mind in particular is for E mini traders in indices, where it all started for me.
I have now reached the end of the book. It is a book I have wanted to write for many years, and finally found the time to do just that. I have tried to explain everything as carefully as I can, with what I hope are some clear examples, and now it is for you to practice reading the charts and applying these techniques for yourself.
I hope I have managed to convince you of the power of volume and price, and the potential success that awaits if you are prepared to adopt this methodology. It does require a little time to master but, in my opinion, is worth the effort. However, I would urge you again, not to spend thousands of dollars on software which suggest VPA can be done for you. It won't. VPA is a technique that takes time, effort and patience, but once you have grasped the basic concepts then the rest falls into place very quickly.
Volume and price together are the only indicators that truly reveal market sentiment and the activity of the insiders. Without it you are trading blind. With it, everything is revealed. There is no hiding place with VPA.
Finally, I would, of course, like to thank you for purchasing this book and investing your time in reading it, and if you do have any comments, questions or suggestions I would be delighted to hear from you. You can contact me on my personal email at
anna@annacoulling.com
and you will receive a reply. This book is based on my own personal trading experience, and from what I found has worked for me over the years.
If you have enjoyed the book, naturally I would be grateful if you could spread the word, to help other traders who may still be struggling to understand how and why the markets behave in the way they do. I would really appreciate a review on Amazon, which will help others to find this book more easily. So thank you in advance.
This is the foundation book for volume price analysis, and since writing it I have published several others which take these principles and apply them to annotated worked examples, for stocks, forex and also cryptocurrencies. All of these books will help to reinforce these concepts with detailed examples in all time frames. These are as follows:
And of course these are also available in paperback.
Once again, thank you so much, and may I wish you every success in your own trading and investing journey.
Warmest regards, and many thanks again
Anna
PS - please do follow my market analysis on my personal site and check for the latest book, or join me on Twitter or Facebook. In addition I also run regular webinars where I explain the concepts and methodologies in more detail in live markets. I look forward to seeing you there, and thank you once again.