
Probability is just one way to look at statistical patterns. Using other techniques, such as determining median, mode, range, and standard deviation, also can provide equally useful information.
If a group containing an odd number of terms is arranged in numerical order, the median is the middle value.
If a group containing an even number of terms is arranged in numerical order, the median is the average, or arithmetic mean, of the two middle numbers.
Example:
What is the median of 4, 5, 100, 1, and 6?
Solution:
First, arrange the numbers in numerical order: 1, 4, 5, 6, and 100. The middle number (the median) is 5.
Example:
What is the median value of 2, 7, 8, 16, 12, and 37?
Solution:
If a set has an even number of terms, then the median is the average (arithmetic mean) of the two middle terms after the terms are arranged in numerical order. Arrange the values in numerical order: 2, 7, 8, 12, 16, 37. The two middle numbers are 8 and 12. The median is the average of 8 and 12, that is, 10.
The median can be quite different from the mean (average). For instance, in the first
set of numbers above, {1, 4, 5, 6, 100}, the median is 5, but the average is
The mode is the number that appears most frequently in a set. For example, in the set {1, 2, 2, 2, 3, 4, 4, 5, 6}, the mode is 2.
It is possible for a set to have more than one mode. For example, in the set {35, 42, 35, 57, 57, 19}, the two modes are 35 and 57. When more than one mode exists, do not calculate the mean of these numbers but rather report each as a separate value.
The range is the positive difference between the largest term in the set and the smallest term. For example, in the set {2, 4, 10, 20, 26}, the range is 26 − 2 = 24.
Standard deviation measures the dispersion of a set of numbers around the mean. If
you let σ be the standard deviation of the N values x1, x2, … xN and let µ be the average, or arithmetic mean, of the N values x1, x2, … xN, that is,

then the formula looks like this:

It can be intimidating, so it helps to break up the process into the following steps:
Fortunately, you will only very rarely be required to apply this formula and only on the most difficult questions. When standard deviation is tested, all you will generally need to understand is the basic concept: Standard deviation represents how close or far the terms in a set or list are from the average. Thus, standard deviation is a measure of how widely dispersed the terms of a list are, or how widely dispersed the members of a set are.
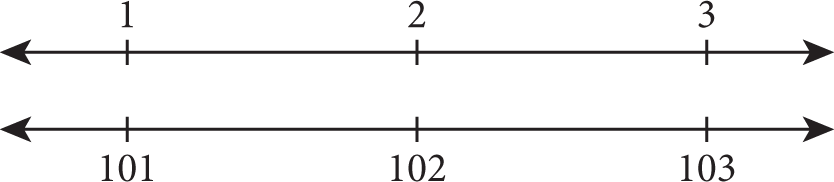
Thus, {1, 2, 3} and {101, 102, 103} have the same standard deviation since they both have one term on the mean and two terms exactly one unit away from the mean. Quickly sketching number lines can confirm this:
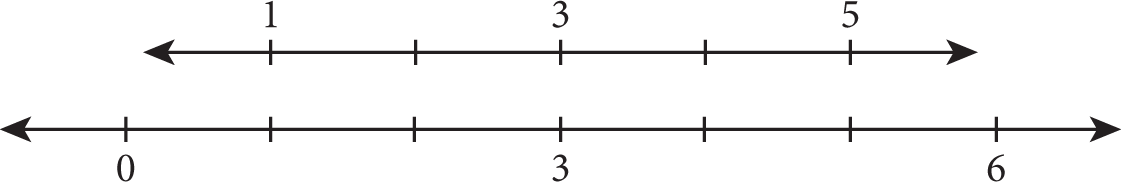
The set {1, 3, 5} will have a smaller standard deviation than {0, 3, 6}. Both sets have a mean of 3, but the first has terms 2, 0, and 2 units from the average, while the second has terms 3, 0, and 3 units from the average. Again, you can confirm this by quickly sketching number lines:
You could also calculate the standard deviation for the sets {1, 3, 5} and {0, 3, 6} to confirm:
| {1, 3, 5} | {0, 3, 6} |
| mean = 3 | mean = 3 |
 |
 |
Since 6 is larger than
 the standard deviation of the second, more widely spaced set of numbers is larger
than that of the first set.
the standard deviation of the second, more widely spaced set of numbers is larger
than that of the first set.
Below are the key concepts to remember about median, mode, range, and standard deviation.