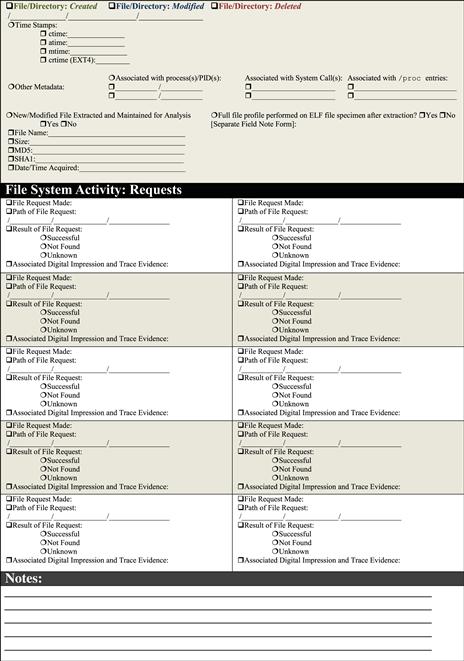
• Correlate the information gathered through the interception of system calls with artifacts discovered in file system activity.
• Correlate file system activity with process activity and digital trace evidence such as dropped executables, libraries, hidden files, and anomalous text or binary files.
 Monitor common locations where malware manifests to blend into the system, such as /tmp, as it may reveal anomalous items.
In addition to such traditional malware file artifacts, consider functional context, including processes running from suspicious locations in the file system, such as newly created directories, or anomalous directories.
• Correlate file system activity with /proc activity.
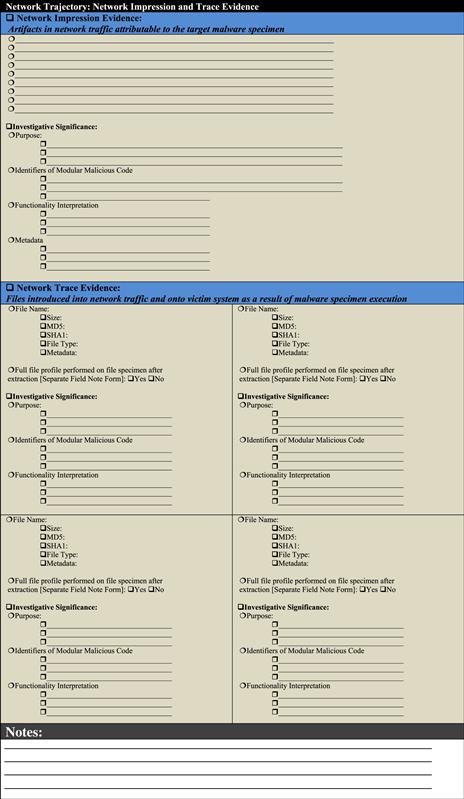
• Relational analysis, including correlation of network impression and trace evidence with execution trajectory on the file system, such as modification of the hosts file.
 As mentioned earlier in the chapter, files accessed by running processes can be identified using the lsof utility, which is native to Linux systems.
• Use lsof with no command switches to list all files opened on the victim system.
• Collect information related specifically to a suspect process by using the –p switch and supplying the assigned PID.
Similarly, leverage GUI-based tools such as GLSOF and Mortadelo to gain a clear and holistic perspective on file activity and corroborate findings.
Automated Malware Analysis Frameworks
☑ A helpful solution for efficiently triaging and processing malicious code specimens in an effort to gain quick intelligence about the specimens is automating the behavioral analysis process.
Over the last few years, a number of researchers have developed automated malware analysis frameworks, which combine and automate a myriad of processes and tools to collectively monitor and report on the runtime behavior of a target malicious code specimen. These analysis frameworks provide an effective and efficient means of processing a suspect program to quickly gain actionable intelligence about the specimen. While many of these tools are developed for installation on Linux platforms, at the time of this writing there are no automated malware analysis frameworks that process ELF files. However, these solutions may be useful during the file profiling process (Chapter 5) when seeking to triage suspected files prior to knowing the respective file type, target operating system, nature, and purpose of the specimen. These tools are discussed in further detail in the Tool Box appendix at the end of this chapter. 
 Online Resources
Online Malware Analysis Sandboxes
A helpful analytical option to either quickly obtain a behavioral analysis overview of suspect program, or to use as a correlative investigative tool, is to submit a malware specimen to an online malware analysis sandbox. While at the time of this writing there are no online malware analysis sandboxes that process Linux ELF files, these services can nonetheless be useful as a pre-analysis triage platform to identify file types and files of interest.
These services (which at the time of this writing are free of charge) are distinct from vendor-specific malware specimen submission Web sites, or online virus scanners such as VirusTotal (https://www.virustotal.com/en/), Jotti Online Malware Scanner (http://virusscan.jotti.org/en), and VirScan (www.virscan.org), as discussed in Chapter 5.
• Online malware scanners execute and process the malware in an emulated Internet, or “sandboxed” network, and generally provide the submitting party a comprehensive report detailing the system and network activity captured in the sandboxed system and network.
• Submission of any specimen containing personal, sensitive, proprietary, or otherwise confidential information, may violate a victim company’s corporate policies or otherwise offend the ownership, privacy, or other corporate or individual rights associated with that information. Seek the appropriate legal guidance in this regard before releasing any such specimen for third-party examination.
• Similarly, remember that by submitting a file to a third party Web site, you are no longer in control of that file or the data associated with that file. Savvy attackers often conduct extensive open source research and search engine queries to determine whether their malware has been detected. The results relating to a file submitted to an online malware analysis service are publicly available and easily discoverable—many portals even have a search function. Thus, as a result of submitting a suspect file, the attacker may discover that his malware and nefarious actions have been discovered, resulting in the destruction of evidence, and potentially damaging your investigation.
• A table with a comparative listing of currently available online malware analysis sandboxes and their respective features is provided in the Tool Box Appendix at the end of this chapter.
Embedded Artifact Extraction Revisited
☑ After successfully executing a malicious code specimen (and extracting it from obfuscation code, if present), re-examine the specimen for embedded artifacts and conduct deeper static analysis of the specimen.
Re-profile the executable file using the tools, techniques, and protocol described in Chapter 5.
• Pay particular attention to strings, symbolic information, and file metadata that may reveal clues relating to the purpose and capabilities of the program.
• Disassemble the target executable in an effort to determine the function and inter-relationships of embedded artifacts, and in turn, how the totality of these relationships shape the functionality of the specimen, including:
Relational context of system calls
Anticipated digital impression and trace evidence on a target system
 Analysis Tip
Investigative Parallels
The digital investigator could think of dynamic analysis to some degree as surveillance of a suspect. During the course of surveillance, the investigator seeks to learn: “what does the suspect do, where does he go, who does he talk to,” etc. This initial evidence collection helps provide a basic overview of the suspect’s activity, but often, additional investigation is required. A detailed interrogation (in the parallel of malware forensics, disassembly) of the suspect (code) can help identify the remaining items of potential interest.
Examining the Suspect Program in a Disassembler
During the course of dynamic analysis of a malicious code specimen, active system monitoring will likely yield certain clues into the functionality of a malicious code specimen. In particular, system calls made by the specimen during execution trajectory provide substantial insight into the manner in which the specimen operates and the digital impression and trace evidence that will be left on the affected system.
• Examine the specimen in IDA Pro, a powerful disassembler and debugger offered by Hex-rays.com.87 A disassembler allows the digital investigator to explore the assembly language of a target binary file, or the instructions that will be executed by the processor of the host system. While the focus in this section will be the use of IDA Pro, other disassemblers (and debuggers), such as objdump,88 Dissy,89 ldasm,90 and lida91 are discussed in the Tool Box appendix at the end of this chapter and on the companion Web site.
• IDA Pro is feature rich, multi-processor capable, and programmable, and has long been considered the de facto disassembler for malicious code analysis and research. Although it is beyond the scope of this book to go into great detail about all of the capabilities IDA Pro has to offer, a great reference guide is The IDA Pro Book, by Chris Eagle.92
By spying on the system calls made by a suspect program during dynamic analysis, a helpful list of functions can be identified for exploration within IDA Pro. The following examples demonstrate leveraging the intelligence gathered during system call monitoring and using IDA Pro to parse a suspect malware specimen. In particular, IDA Pro can be used to identify: (1) triggering events; (2) relational context of system calls; and (3) anticipated network trajectory, digital impression, and trace evidence.
Triggering Events
• Triggering events are environmental or functional context variables that cause a malicious specimen to perform a certain function. In Figure 6.52, IDA Pro was used to locate the triggering sequence that the Wirenet Trojan uses to invoke its keylogger functionality. The Trojan makes a call for XInputExtension, looking for connected input devices, such as a keyboard, mouse, etc. The available devices are identified with a call to XListInputdevices; specific devices that are triggers to initiate the keylogging sequence are revealed:“AT” and “System Keyboard” (Figure 6.52).

Relational Context of System Calls
• In addition to identifying triggering events, IDA Pro can be used to identify the inextricability of certain system calls, further revealing how a malware specimen accomplishes its infection life cycle and intended purpose.
• Looking further into the code of a target specimen from Figure 6.52, the malware also takes screen captures of the victim system in an effort to surreptitiously collect sensitive information—such as account usernames and passwords—by using a series of inter-related function calls to acquire the victim system screen parameters, capture the image, and then save it. As shown in Figure 6.53, the CaptureScreen command initiates the IsX11LibAPILoaded function.
• Deeper examination of the function trajectory with IDA Pro reveals that the specimen identifies the size of the victim system screen (XGetGeometry) (Figure 6.54), acquires the screen capture (XGetImage), and saves the image (SaveXImagetoBitmap).

FIGURE 6.53 Examining relational context between functions with IDA Pro; the CaptureScreen command initiates the IsX11LibAPILoaded function

Anticipated Network Trajectory, Digital Impression, and Trace Evidence
• In addition to determining the manner in which a malware specimen performs a nefarious function, IDA Pro should be used in an effort to identify digital trace evidence potentially introduced onto a victim system.
• In particular, using IDA Pro, locate functions and references to files a malware specimen tries to download, access, and/or execute. For example, in Figure 6.55, the malware specimen invokes a bind shell (/bin/sh and /bash/sh) on the victim system to provide the attacker a foothold for stealth access.
• Similarly, assembly instructions may reveal areas of the victim system that will be scoured by the malware during the course of execution—this is often seen in specimens that steal credentials, files, and other items for exfiltration. For example, in Figure 6.56, the assembly reveals that the malware will access the victim system Mozilla Thunderbird and Firefox profiles in search of credentials.


Investigative Consideration
• Such access leaves digital impression (and in some instances, digital trace) evidence that serves as useful temporal and relational contextual guidance for the digital investigator. These identified areas on the victim lab system should be examined to confirm functionality and corroborate other evidence in your investigation (i.e., during live response interviews in the field you learn from a victim that his e-mail credentials were compromised).
• Intelligence gathered through this process should be correlated with live response and postmortem forensic findings in an effort to identify remediation considerations.
Interacting with and Manipulating the Malware Specimen: Exploring and Verifying Functionality and Purpose
☑ After identifying the manner and means in which a target malware specimen functions, manipulate the specimen or the lab environment in an effort to interact with the specimen and verify its functionality.
Unlike other phases of analysis that involve monitoring, data analysis, and extraction to understand the functionality of a target malware specimen, this phase of analysis focuses on thinking like the attacker. In particular, the focal point is how is the malware specimen used and how its functionality is invoked.
• To accomplish this task, the digital investigator can manipulate a target malware specimen in the following ways:
Prompting Trigger Events
Recall from earlier in the chapter that execution trajectory is the behavior and interaction of the malicious code specimen with the victim system and external network resources—from the point of execution through the life cycle of the infection. As a part of the trajectory, trigger events are those events that invoke behavior or functionality from a specimen.
• Trigger events may be caused by victim behavior on the infected system (such as typing on the keyboard—invoking a keylogging feature), or though the introduction of digital trace evidence from a remote resource (such as the download of additional malicious files that provide instructions to the specimen).
• Armed with information gathered through dynamic and static analysis, the digital investigator can engineer the laboratory environment in an effort to replicate the particular triggering events used by a target specimen. Although triggering events are specific relative to a target specimen, some examples include:
Opening and using a particular targeted client application
Checking for the existence of specific files on the victim system
Replicating victim interaction with the system such as opening browser windows
Typing information into a Web form
Set up additional network resources sought by the specimen
• To emulate a malware specimen’s interaction with the target URLs, one approach would be to copy the content of the target Web sites using utilities like HTTrack93 or wget94 and host the content on a Web server in your malicious code laboratory—in essence, allowing the specimen to interact with the Web site offline and locally.95
• An alternative approach is to resolve the predefined domains and URLs to a Web server running in the laboratory network. Although the content of the Web sites will not be similar, at minimum, the URLs will resolve, which may be enough to trigger a response from the specimen.
Investigative Consideration
• Triggering events that relate to specific files on the victim system emphasize the need for a holistic investigative approach. In particular, where possible, the digital investigator should examine the physical memory and hard drives of the victim system to corroborate trigger events and recover relevant associated artifacts.
Client Applications
Certain types of malware are controlled by the attacker with a client application or command and control interface. Thus, to fully replicate the functionality and use of these specimens, the digital investigator will need to use these control mechanisms, just as an attacker would.
• Unfortunately, as these are typically “underground” applications, they may not be easy to acquire. Furthermore, even when client applications are available for download from underground forums, they are often modified by attackers to have additional backdoors and malicious features in an effort to infect the system of the individual who downloaded the program. Use extreme caution when conducting this kind of research.
• If a “clean” and “reliable” version of client software can be obtained through a malicious code research Web site,96 install it for use on a separate laboratory system in an effort to replicate the remote attacker.
• Once the client application has been configured for adaptation in the laboratory environment, execute the malware specimen in the victim laboratory system in an effort to trigger the specimen to connect to the remote client.
Investigative Considerations
• Exploiting and Verifying Attack Functionality. Explore the nature and capabilities of the program by delving deeper and assuming control over the victim system through the malicious code specimen. Further, in gaining control over the victim system, execute available commands and features from the “attacker” system in an effort to evaluate the attack capabilities of the specimen and client. As shown in Figure 6.57, an infected guest system is controlled by a laboratory “attacker” IRC command and control structure, and instructed to launch a denial of service attack against a virtual victim system; the resulting attack manifests in network visualization capture by EtherApe.
• Assessing Additional Functionality and Scope of Threat. In addition to executing attacks on a virtual victim system to verify a malicious program’s functionality, explore other commands and the effect on the victim system to assess the threat of the program.
• For example, objectives in exploring the remote administration, or Trojan capability of a program, may include:
Ability to conduct countersurveillance on the system;
Navigate the hard drive and attached storage of the infected system to discover items of interest;
Download additional exploits and tools to the system; and
Exfiltrate data from the compromised system.
• To verify these capabilities, adjust the laboratory environment with the resources the malware needs to ensure that execution trajectory and full functionality can be accomplished; in this way the attacker technique can be accurately simulated. In Figure 6.58, a Web server was established in the laboratory so that the “download” feature of the target specimen could be leveraged to download additional malware (ior) to continue the infection life cycle of the malware.


Event Reconstruction and Artifact Review: Post-Run Data Analysis
☑ After analyzing a suspect malware specimen, and gaining a clearer sense of the program’s functionality and shortcomings, reconstruct the totality of the forensic artifacts relating to the malicious code specimen. Examine network and system impression evidence to determine the impact the specimen made on the system as a result of being executed and utilized.
Correlate related artifacts and try to reconstruct how the specimen interacted with the host system and network. In particular, examine digital impression and trace evidence collected through both passive and active monitoring tools during the course of execution trajectory, including:
 Example Event Reconstruction Case Scenario
To gain a clearer understanding of the Event Reconstruction process, an example case scenario will be used for demonstrative purposes. In particular, the investigative steps and artifacts examined will be through the lens of analyzing the impact that a Trojan specimen made on an infected victim system. The basic facts of the scenario include the following:
• During dynamic and static analysis of the target specimen, you determined it to be “bot” malicious code—blended threat malware that causes the infected system to join a larger “army” of infected systems, or a “botnet,” to be leveraged by the attacker—known as a “bot herder” or “bot master.” Your analysis reveals that the malware tries to connect to remote resources for the botnet command and control (C2) structure.
• You learn that the execution trajectory on the victim system created a new process and left artifacts in /proc. Further, the specimen required substantial environment adjustment and emulation in order complete trajectory and its infection life cycle.
• To conduct your analysis, the sample Trojan specimen was executed on an emulated victim laboratory system (Ubuntu Linux 12.10 VMWare guest), and a server system (Ubuntu 12.10 VMware guest) was established to facilitate environment emulation and trajectory chaining.
• Using the facts of this example case scenario as the basis, the totality of the forensic artifacts relating to the malicious code specimen can be reconstructed following the guidelines in this section.
Passive Monitoring Artifacts
After executing and interacting with a malicious code specimen on an infected victim system, assess the impact that the specimen made on the system. In particular, compare the post-execution system state to the state of the system prior to launching the program—or the “pristine” system state.
• Recall that the first step prior to executing a malicious code specimen is to establish a baseline system environment by taking a snapshot of the system state using a host integrity or installation monitoring program.
• Once the dynamic analysis of the malware specimen is completed, examine the post-runtime system state by comparing it against the pre-run snapshot taken with a host integrity or installation monitoring tool.
• For example, after running the Trojan specimen presented in the example case scenario and comparing system snapshots, the file system integrity monitor, tripwire, captured the creation of directories, executable files, and /proc entries on the victim system (Figure 6.59).
• Correlate host integrity or installation monitoring results with other digital impression and trace evidence collection methods. For instance, referenced earlier in the Execution Artifact Capture: Digital Impression And Trace Evidence section, SystemTap collects granular details regarding a malware specimen’s behavior and the associated digital impression evidence left on the file system of the affected system.
• A review of the SystemTap log resulting from the execution of the Trojan specimen (Figure 6.60) details execution trajectory resulting in a newly created malicious process, sysfile, revealing access to the /etc/hosts file and engagement of the multicast DNS service for name resolution (mDNS).


Active Monitoring Artifacts
For holistic context, compare data collected through active monitoring with passive monitoring data.
• Track process creation, file system, and /proc changes
• Confirm digital impression and trace evidence on the affected system
• Identify any inconsistencies or anomalies between the datasets
Figures 6.61 and 6.62 reveal the file system activity of a malicious process spawned by the Trojan specimen—as captured by GLSOF and Mortadelo.


Analyzing Captured Network Traffic
As a general principle, there are five objectives in examining the post-run network data to reconstruct the specimen behavior and attack events:
• Get an overview of the captured network traffic contents to identify relevant or anomalous activity and where to probe deeper.
• Replay and trace relevant or unusual traffic events.
• Gain insight into network trajectory and associated network impression and trace evidence.
• Conduct a granular inspection of specific packets and traffic sequences if necessary.
• Search the network traffic for particular trends or entities if needed.
There are a number of network analysis and packet decoding tools for Linux that enable the digital investigator to accomplish these tasks. Some of the more commonly used tools for this analysis include :
• Wireshark (discussed earlier in this chapter)
• RUMINT97 (a network forensic visualization tool)
• Chaosreader98 (a network forensic analysis tool)
• Xplico99 (a network forensic analysis tool)
• Network Miner100 (a network forensic analysis tool)
The digital investigator can obtain an overview of the collected traffic using a variety of tools.
• Command-line utilities like capinfos,101 tcptrace,102 and tcpdstat103 provide statistical information about the packet capture. Similarly, Wireshark offers a variety of options to graphically display the overview of network flow, such as graph analysis, seen in Figure 6.63.
• Further, to gain an overview of network trajectory in relation to the totality of system events and resulting digital impression evidence, use a network forensic visualization solution such as RUMINT.104
RUMINT provides the digital investigator with the ability to view network traffic through a myriad of different visualization schemas, which can be used in tandem, providing alternative context (Figure 6.64). This is particularly useful when a series of environment adjustments are made on the victim system.
In Figure 6.65 the Byte Frequency view provides the digital investigator with a high-level view of protocol activity and data transmission—helpful for identifying data network traffic patterns.


Trace and compare network trajectory evidence with resulting digital impression and trace evidence on the victim system. This is particularly important when analyzing modular malicious code that retrieves additional files from remote resources.
• After gaining an overview of the traffic, probe deeper and extract the traffic relevant to the specimen and replay the traffic sessions if needed. Wireshark can be used to accomplish this, as can tcptrace and tcpflow.
• For the replay of network traffic, a particularly helpful utility is Chaosreader, a free, open source Perl tool that can trace TCP and UDP sessions as well as fetch application data from network packet capture files.
• Chaosreader can also be run in “standalone mode” wherein it invokes tcpdump or snoop (if they are installed on the host system) to create the log files and then processes them.
• To process packet capture files through Chaosreader, the tool must be invoked and pointed at the target file, as shown in Figure 6.66. Chaosreader reads the file contents and reassembles the packets, creating individual session files.
• While parsing the data, Chaosreader displays a log of the session’s files, including session number, applicable network nodes and ports, and the network service applicable to the session.
• After parsing the data, Chaosreader generates an HTML index file that links to all of the session details, including real-time replay programs for telnet, rlogin, IRC, X11, and VNC sessions. Similarly, traffic session streams are traced and made into HTML reports for deeper inspection. Further, particularized reports are generated, pertaining to image files captured in the traffic and HTTP GET/POST contents (Figure 6.67).


In addition to retracing traffic for a particular traffic session, conduct a granular inspection of specific packets and traffic sequences, if needed. Wireshark provides the digital investigator with a myriad of filters and parsing options allowing for the intuitive manipulation of packet data.
• Parse the contents of packet payloads of interest to get a more particularized understanding of the traffic being transmitted by the infected system.
• Search the network traffic for particular trends or entities. For instance, if you know the name of a particular trace evidence artifact, use ngrep,105 a tool that allows the investigator to parse pcap files for specific extended regular or hexadecimal expressions to match against data payloads of packets.
• As shown in Figure 6.68, point ngrep to a traffic capture file and search for a string of interest. In doing so, if the string is present in the network capture, ngrep identifies the term as a match, and displays the output relevant to the term.
• String searches of network traffic captures can be conducted with Wireshark using the “Find Packet” function, which parses the packet capture loaded by Wireshark for the supplied term (Figure 6.69).


 Other Tools to Consider
Packet Capture Analysis
• Tcpxtract: Written by Nick Harbour, tcpxtract is a tool for extracting files from network traffic based on file signatures. (http://tcpxtract.sourceforge.net/).
• Driftnet: Written by Chris Lightfoot, Driftnet is a utility for listening to network traffic and extracting images from TCP streams (http://freshmeat.net/projects/driftnet/; http://www.ex-parrot.com/∼chris/driftnet/).
• Ntop: A network traffic probe that shows network usage. Using a Web browser, the user can examine a variety of helpful graphs and charts generated by the utility to explore and interpret collected data (www.ntop.org).
• Tcpflow: Developed by Jeremy Elson, tcpflow is a utility that captures and reconstructs data streams. (https://github.com/simsong/tcpflow).
• Tcpslice: A program for extracting or “gluing” together portions of packet-trace files generated using tcpdump (ftp://ftp.ee.lbl.gov/tcpslice.tar.gz).
• Tcpreplay: A suite of tools to edit and replay captured network traffic (http://sourceforge.net/projects/tcpreplay/).
• Iptraf: A console-based network statistics utility for Linux, iptraf can gather a variety of figures such as TCP connection packet and byte counts, interface statistics and activity indicators, TCP/UDP traffic breakdowns, and LAN station packet and byte counts (http://iptraf.seul.org/).
Further tool discussion and comparison can be found in the Tool Box section at the end of this chapter and on the companion Web site, www.malwarefieldguide.com/LinuxChapter6.html.
Analyzing System Calls
Another post-execution event reconstruction task is collective review of the system calls made by a suspect program, and how the calls relate to the other artifacts discovered during the course of analysis or during event reconstruction. Tools such as SystemTap provide for a means of gathering and analyzing system calls through the lens of different capture summaries, which is a great overview for indentifying the ratio and types of calls made by a malware specimen during runtime.
• To determine the total number of system calls made by running processes (during a set time period) as a means of comparing active and suspicious processes, the following scripts can be used:
| Script | Function | Source |
| profile.stp | Identifies processes running in user space and the number of system calls made by the respective processes. By default the script captures calls for 10 seconds, but the timer probe in the script can be modified to a desired duration (Figure 6.70). | http://www.ibm.com/developerworks/linux/library/l-systemtap/ |
| syscalls_by_pid.stp | System-wide count of system calls by PID. This script watches all system calls made on the system; on exit the script prints a list revealing the number of system calls executed by each PID ordered from the greatest to least number. | http://sourceware.org/systemtap/examples/process/syscalls_by_pid.stp |
| syscalls_by_proc.stp | System-wide count of system calls by process/executable. This script watches all system calls made on the system; on exit the script prints a list revealing the number of system calls executed by each process/executable, ordered from the greatest to least number. | http://sourceware.org/systemtap/examples/process/syscalls_by_proc.stp |
| syscalltimes | This combination shell/SystemTap script is used to measure system call counts and times. The script can be calibrated to filter by PIDs, process names, and users. | http://sourceware.org/systemtap/examples/process/syscalltimes |
| topsys.stp | Lists the top 20 system calls used (and how many times the respective calls were used) by the system per 5 second interval. | http://sourceware.org/systemtap/SystemTap_Beginners_Guide/topsyssect.html#topsys |
| functioncallcount.stp | Reveals the names of the functions called and how many times each respective call was made during the sample time (in alphabetical order) | https://access.redhat.com/site/documentation/en-US/Red_Hat_Enterprise_Linux/6/html/SystemTap_Beginners_Guide/mainsect-profiling.html |
• Upon identifying the number of system calls being made by a target malware process, layer your analysis with additional scripts that reveal and summarize the system calls being made by the specific process, such as the <process name>_profile.stp script,106 as demonstrated in Figure 6.71. For this particular script, the process name of the malware specimen, sysfile, was added, and the probe timer was modified to 20 seconds (default time is 10 seconds).

Analyzing NIDS alerts
Another post-execution event reconstruction task is review of any NIDS alerts that may have been triggered as a result of the activity emanating to or from your infected victim lab system.
• In particular, assess whether the system and network activity attributable or emanating from the victim system manifested as an identifiable NIDS rule violation.
• If alerts manifest, this means that the activity identified by Snort was flagged as anomalous by the Snort preprocessors, or matched an established rule specific to certain anomalous or nefarious predefined signatures.
• In reviewing of the contents in the Snort alerts (by default located in /var/log/snort)107 examine the nature of the network traffic that emanated from the infected system while prompting trigger events—and exploiting and verifying malware attack functionality—against the virtual victim system.
Physical Memory Artifacts
Physical memory can contain a wide variety of digital impression and trace evidence, including malicious executables, associated system-related data structures, and remnants of malicious events. Within the scope of event reconstruction, the goals of memory analysis are as follows:
• Harvest available metadata including process details, network connections, and other information associated with the malware specimen, for analysis and comparison with other digital impression and trace evidence identified on the infected victim laboratory system.
• Perform keyword searches for any specific, known details relating to the malware specimen that was examined.
• Look for common indicators of malicious code including memory injection and hooking; (see Figure 6.72, depicting Jynx rootkit specimen impression and trace evidence identified in SecondLook).108
• For each process of interest, recover the executable code from memory for further analysis.
• For each process of interest, extract associated data from memory, including related encryption keys and captured data such as usernames and passwords.
• Extract contextual details such as URLs pertaining to the installation and activities associated with malicious code.
• Perform temporal and relational analysis of information extracted from memory, including a time line of events and a process tree diagram.

FIGURE 6.72 SecondLook discovering trace and impression evidence associated with the Jynx rootkit captured in physical memory
Other Considerations
Port and Vulnerability Scanning the Compromised Host: “Virtual Penetration Testing”
In addition to exploring the functionality of a malicious code specimen to assess the threat the program poses to the victim system, there are additional steps the digital investigator can take to explore the impact resulting to the system as of result executing the specimen.
• First, a port scan can be conducted (from a different system) against the infected system to identify open/listening ports, using a utility such as nmap.109 To gain any insight in this regard, it is important to know the open/listening ports on the baseline instance of the system, making it easier to decipher which ports were potentially opened as a result of launching the suspect program.
• Similarly, vulnerabilities created on the system by the malware can potentially be identified by probing the system with vulnerability assessment tools such as OpenVAS110 or Nessus.111
• The digital investigator would typically not want to conduct a port or vulnerability scan of the infected host during the course of monitoring the system because the scans will manifest artifacts in the network traffic and NIDS alert logs, in turn, tainting the results of the monitoring. In particular the scans would make any network activity resulting from the specimen indecipherable or blended with the scan traffic.
Scanning for Rootkits
Another step that the digital investigator can take to assess an infected victim lab system during post-run analysis is to search for rootkit artifacts.
• This can be conducted by scanning the system with rootkit artifact detection tools. Some of the more popular utilities for Linux in this regard include chkrootkit,112 rootkit hunter (rkhunter),113 unhide,114 and the Rootcheck project.115
• Similar to the consequences of conducting port and vulnerability scans while monitoring the infected system, using rootkit scanning utilities during the course of behavioral analysis of a specimen may manifest as false positive artifacts in the host integrity system monitoring logs.
Digital Virology: Advanced Profiling Through Malware Taxonomy and Phylogeny
☑ After gaining a clearer picture about the nature, purpose, and capabilities of a malicious code specimen through dynamic and static analysis, catalog and classify the specimen with the aim of identifying phylogenetic relationships to other specimens.
Creating and maintaining a malware repository of cataloged and classified specimens is a valuable and recommend feature in the digital investigator’s malware laboratory. Carefully classified malware in the repository provides a powerful resource for comparing and correlating new specimens.
A repository of cataloged and classified specimens supports several benefits in a digital investigators malware laboratory:
• Formalize the information that is captured and reported for each specimen of malware, increasing the consistency of analysis and reporting.
• Knowledge reuse when analysis has already been performed that can be applied to a new specimen, saving time and effort on malware analysis, particularly when encryption and other challenging features are involved.
• Exchange details about malware with other digital investigators in a format that is intelligible and immediately useful for their analysis.
• Reveal trends in malware infections that may be useful for protecting against future attacks.
• Find relationships between related malware that may provide insight into their origin, composition, and development. Such linkage may also reveal that a single group of attackers is responsible for multiple incidents.
Malware Taxonomy or cataloging and classifying a malware specimen means correlating the information gathered about the specimen through file profiling, and behavioral and static analysis, and in turn, identifying the nature, purpose, and capabilities of a specimen—enabling the digital investigator to group the specimen into a category of like specimens. Malware Taxonomy borrows from traditional biological Taxonomy, or the science of classifying organisms.
• In some instances, going beyond classification and endeavoring to identify the evolution, similarity in features and structure of a particular malware specimen—or relationships to other specimens—is needed. For example, during the course of an investigation you may learn that a victim has been under attack over the course of several months, and the attacker’s malware has become more sophisticated as a result of countermeasures attempted by the victim. Examining phylogenetic relationships between all of the specimens may identify important interrelationships and indicia of evolution in the malware.
• In biology, phylogenetics is the study of evolutionary relation among various groups of organisms.116 Applied to malware, phylogeny is an estimation of the evolutionary relationships between a set of malware specimens.117 There have been a number of studies on malware phylogeny modeling, as detailed in the table below.
| Researcher(s) | Research | Model |
| Hayes, Walenstein, & Lakhotia | Evaluation of Malware Phylogeny Modeling Systems Using Automated Variant Generation118 | Automated variant generation |
| Cesare & Xiang | Classification of Malware Using Structured Control Flow119 | Structured control flow |
| Wagener, State, & Dulaunoy | Malware Behaviour Analysis120 | Behavioral analysis |
| Carrera & Erdélyi | Digital Genome Mapping-Advanced Binary Malware Analysis121 | Graph similarity/clustering |
| Rieck, Holz, Willems, Dussel, & Laskov | Learning and Classification of Malware Behavior122 | Machine learning techniques |
| Ye, Chen, Li, & Jiang | Automatic Malware Classification using Cluster Ensemble123 | Hybrid Hierarchical Clustering (HHC) |
| Walenstein, Venable, Hayes, Thompson, & Lahkhotia | Exploiting Similarity Between Variants to Defeat Malware124 | “Vilo” method |
| Karim, Walenstein, & Lakhotia | Malware Phylogeny using Maximal ΠPatterns125 | ΠPatterns in string contents |
| Gupta, Kuppili, Akella, & Barford | An Empirical Study of Malware Evolution126 | Text mining and pruning |
| Babić, Reynaud, & Song | Malware Analysis with Tree Automata Inference127 | Tree automata inference from dataflow dependency data among syscalls |
| Bailey, Overheide, Anderson, Mao, Jahanian, & Nazario | Automated Classification and Analysis of Internet Malware128 | Behavior-based fingerprint extraction and fingerprint clustering algorithm |
| Yavvari, Tokhtabayev, Rangwala, & Stavrou | Malware Characterization Using Behavioral Components129 | Behavioral mapping |
| Goldberg, Goldberg, Phillips, & Sorkin | Constructing Computer Virus Phylogenies130 | Phylogenetic Directed Acyclic Graph (phyloDAG) |
| Bayer, Comparetti, Hlauschek, Kruegel, & Kirda | Scalable, Behavior-based Malware Clustering131 | Execution traces/program behavior/clustering |
| Khoo & Lio | Unity in Diversity: Phylogenetic-inspired Techniques for Reverse Engineering and Detection of Malware Families132 | Execution capture analysis of instructions executed, memory modifications, and register modifications |
| Dumitras & Neamtiu | Experimental Challenge in Cyber Security: a Story of Provenance and Lineage for Malware133 | Machine learning and time series analysis for reconstructing malware lineage and provenance |
| Li, Lu, Gao, & Reiter | On Challenges in Evaluating Malware Clustering134 | Clustering (using plagiarism detection algorithm) |
| Jacob, Debar, & Filol | Behavioral Detection of Malware: from a Survey Towards an Established Taxonomy135 | Behavioral detection |
118Journal in Computer Virology, 2009, volume 5, no. 4, pp. 335–343.
1198th Australasian Symposium on Parallel and Distributed Computing (AusPDC 2010), 2010.
120Journal in Computer Virology, vol. 4, no. 4, pp. 279–287.
121Proceedings of the 14th Virus Bulletin Conference 2004, pp. 187–197.
122Detection of Intrusions and Malware, and Vulnerability Assessment Lecture Notes in Computer Science, 2008, vol. 5137/2008, pp. 108–125.
123Proceedings of the 16th ACM SIGKDD international conference on Knowledge discovery and data mining.
124Proceedings of BlackHat DC 2007, http://www.blackhat.com/presentations/bh-dc-07/Walenstein/Presentation/bh-dc-07-Walenstein.pdf; http://www.cacs.louisiana.edu/labs/SRL/publications/2007-blackhat-walenstein-venable-hayes-thompson-lakhotia.pdf.
125Proceedings of EICAR 2005 Conference, http://www.cacs.louisiana.edu/~arun/papers/phylogeny-eicar2005.pdf.
126Proceedings of the First international conference on COMmunication Systems And NETworks, 2009.
127http://www.cs.berkeley.edu/∼dawnsong/papers/2011%20cav11malware.pdf.
128http://www.eecs.umich.edu/techreports/cse/2007/CSE-TR-530-07.pdf.
129http://cs.gmu.edu/∼astavrou/research/Behavioral_Map.pdf.
130Journal of Algorithms, 26(1), pp. 188–208. ISSN 0196-6774.
131http://www.cs.ucsb.edu/∼chris/research/doc/ndss09_cluster.pdf.
132http://www.cl.cam.ac.uk/∼wmk26/phylogenetics/malware_phylogenetics.pdf.
133http://www.cs.ucr.edu/∼neamtiu/pubs/dumitras_neamtiu_cset11.pdf.
134http://www.cs.unc.edu/∼pengli/paper/li10raid.pdf.
135http://www.researchgate.net/publication/220673370_Behavioral_detection_of_malware_from_a_survey_towards_an_established_taxonomy/file/9fcfd5087b15824269.pdf.
On a practical level there are many investigative steps that can be taken to comparatively analyze the contents and functionality of malicious code specimens. These steps include:
• Context triggered piecewise hashing (CTPH);
• Identifying textual and binary indicators of likeness;
• Comparing function flowgraphs;
Context Triggered Piecewise Hasing (CTPH)
Recall from Chapter 5 that CTPH computes a series of randomly sized checksums for a file, allowing file association between files that are similar in content, but not identical.
• In the context of malware taxonomy and phylogeny, ssdeep, a file hashing tool that utilizes CTPH, can be used to query suspicious file specimens in an effort to identify homologous files.136
• One scanning option, as demonstrated in Figure 6.73, is to use the recursive (-r), bare (-b), and “pretty matching mode” (-p) switches against a directory of Chapro malicious Apache module specimens137; the output cleanly displaying matches between files.

Textual and Binary Indicators of Likeness
Another method the digital investigator can use to conduct taxonomic and phylogenetic analysis of malware specimens is through identifying similar embedded artifacts—textual or binary information—in files. A tool that can be used to assist in this endeavor is YARA.138
YARA is a flexible malware identification and classification tool developed by Victor Manuel Álvarez of Hispasec Systems. Using YARA, the digital investigator can create rules that describe target malware families based upon textual or binary information contained within specimens in those families.139
• YARA can be invoked from the command line as a standalone executable or the functionality can be integrated into the digital investigator’s own python scripts through the yara-python extension.140
• The YARA rule syntax consists of the following components:
Rule identifier: The rule “name” that typically describes what the rule relates to. The rule identifier is case sensitive and can contain any alphanumeric character (including the underscore character) but cannot start with a digit; the identifier cannot exceed 128 characters.141
String definition: Although not required for a rule, the string definition is the section of the rule in which unique textual or hexadecimal entities particular to a specimen are defined. The string definition acts as a Boolean variable for the rule condition.142
Condition: The rule condition is the logic of the rule; if files queried with the rule meet the variables in the condition, the files will be identified as matches.
• Rules can be written in a text editor of choice and saved as “.yara” files.
• YARA rules can range from simple to very complex; it is highly recommended that the digital investigator familiarize himself with the YARA User’s Manual (currently version 1.6) to gain a full understanding of YARA’s functionality and limitations.143
• In Figure 6.74, a rule was created in an effort to identify and classify specimens of the recent malicious Apache module, “Chapro.”144 The binary contained unique strings revealing artifacts of functionality that could be used to generate an effective YARA rule.
• After creating the rule and saving it as “chapro.yara,” a directory of numerous malware specimens was queried with YARA, applying the rule. The results of the query are shown in Figure 6.75; eight different specimens were identified and classified.


Function Flowgraphs
 Other Tools to Consider
Textual and Binary Indicators of Likeness
Malware Attribute Enumeration and Characterization (MAEC)
MAEC is a standardized language for encoding and communicating high-fidelity information about malware based upon attributes such as behaviors, artifacts, and attack patterns (http://maec.mitre.org/).
Using ssdeep and YARA, malicious code specimens can be triaged, classified, and cataloged based upon file content. Deeper comparison and exploration of similar malware specimens can be accomplished by conducting a diff (short for difference) of the specimens.
By diffing files, the digital investigator can identify common features and functions between specimens, and conversely (and perhaps more importantly) identify distinctions. In particular, through this process, evolutionary factors such feature accretion145—or added features and capabilities in malware—can be identified and considered toward establishing phylogenetic relationships. Using BinDiff,146 an IDA Pro plugin, the digital investigator can diff two target executable file specimens.
• One of the most powerful features of BinDiff is the Graph GUI, which displays side-by-side comparative flowgraphs of target code contents.
• BinDiff assigns a signature for each function in a target executable based upon the number of codeblocks, number of edges between codeblocks, and number of calls to subfunctions.147
• Once the signatures are generated for the two target executables, matches are created through a myriad of Function Matching and Basicblock Matching algorithms.148
• BinDiff renders Similarity and Confidence values for each matched function (shown in Figure 6.76) as well as for the whole ELF executable file.149

Pre-processing
• Prior to invoking BinDiff, load the respective target executable specimens into IDA Pro. Save the IDA Database file (.idb) files associated with the target ELF executables.
• In IDA Pro, open the IDA Database file for the first target executable specimen.
• Using Figure 6.77 as a visual reference, BinDiff can be invoked through the following steps:
1. Go to the Edit option in the IDA toolbar.
3. Select the “Zynamics Bindiff” plugin.
4. By virtue of selecting the BinDiff plugin, the Diff Menu box will appear. Click on the “Diff Database” box in the menu; this will open the file manager window.
5. Select a second IDA Database file for comparison.
• Upon loading the second target IDA Database file, four additional tabs are presented in IDA: Matched Functions, Statistics, Primary Unmatched, and Secondary Unmatched.

Displaying Flowgraphs in the BinDiff Graph GUI
• Upon identifying a function of interest, right-click on the function and select “Visual Flowgraphs,” as shown in Figure 6.78; this invokes the BinDiff Graph GUI.

The BinDiff Graph GUI displays the function flowgraphs for the respective target executable files in an intuitive dual-paned interface, enabling the digital investigator to navigate the target flowgraphs contemporaneously, as shown in Figure 6.79.
• Using the mouse wheel, the flowgraphs can be zoomed in or out.
• By “zooming out,” a high-level visualization of the function flows is displayed, useful for visually comparing the likenesses or contrasts in data. Similarly, a flowgraph overview “map” for the respective target executables is provided.
• By “zooming in,” the disassembled code is displayed in detail.
• The graphical manifestation of the flowgraph can be viewed in three distinct layouts to provide slightly different context of the graphs: Hierarchic, Orthogonal, and Circular.

Process Memory Trajectory Analysis
As discussed in Chapter 5, malware “in the wild” can present itself as armored or obfuscated, primarily to circumvent network security protection mechanisms like anti-virus software and intrusion detection systems. Even if a specimen could be linked to a certain family of malware based upon its content and similar functions, obfuscation code such as packing may limit the digital investigator’s ability to extract any meaningful data without first deobfuscating the file.
• A technique that allows the digital investigator to compare the contents and trajectory of deobfuscated malicious code in memory during runtime is process memory trajectory analysis—or the acquisition and comparison of the process memory space associated with target malware specimens while executed and resident in memory. This technique is most effective when the respective specimens manifest as distinct new processes rather than injection into pre-existing processes.
• After executing the target specimen, locate the newly spawned process in a process analysis tool; once identified by process name and PID, acquire the memory associated with the process using a process memory dumping tool.
• For example, in Figure 6.80, using pcat,150 the target process is selected, dumped, and saved to disk.
• Conduct the same process memory collection method for each specimen of interest; determine the file size and hash values associated with the process memory dump files. As shown in Figure 6.81, two processes dumped with pcat have distinct MD5 hash values.
• Query the respective process memory files with ssdeep in an effort to determine similarity.151
As shown in Figure 6.82, applying ssdeep with the recursive (-r), bare (-b), and “pretty matching mode” (-p) options against the target speci
Other Tools to Consider
Process Memory Acquisition
There are a number of tools that can be used to acquire the memory of a running process:
• memfetch: Written by Michal Zalewski, memfetch dumps process memory mappings into separate files for analysis (http://freecode.com/projects/memfetch).
• gcore: A traditional means of acquiring the memory contents of a running process is to dump a core image of the process with gcore, a native utility to most Linux and UNIX distributions.
• Shortstop: A tool that dumps process memory and associated metadata (https://code.google.com/p/shortstop/).
• Process Dumper (pd_v1.1_lx): Developed by Tobias Klein, Process Dumper is freeware but closed source and used in tandem with the analysis tool, Memory Parser (a GUI tool for examining process memory captures; http://www.trapkit.de/research/forensic/pd/index.html and http://www.trapkit.de/research/forensic/mmp/index.html).
• memgrep: A tool to search, replace or dump contents of memory from running processes and core files (http://freecode.com/projects/memgrep).
Further tool discussion and comparison can be found in the Tool Box section at the end of this chapter and the companion Web site, www.malwarefieldguide.com/LinuxChapter6.html.
men files (in this example, Gummo backdoor specimens) prior to execution, the files were scored as 96 (out of 100) in similarity.
Conversely, in querying the respective process memory files associated with the target malware specimens, the files were scored 100 in similarity, revealing that the specimens are the same once executed.


Visualization
As discussed in Chapter 5, visualization of binary file contents provide the digital investigator with a quick reference about the data distribution in a file. In addition to identifying obfuscation, comparing data patterns of multiple suspect files can also be used as a method of identifying potential like files based upon visualization of data distribution.
• Target malware executable files can be viewed through a variety of visualization schemas using BinVis.152 Although BinVis was designed to parse both Windows Portable Executable (PE) files and ELF files, currently BinVis does not natively install and run in Linux; WINE153 must be installed on the Linux analysis system.
• To select an executable file for analysis, use the BinVis toolbar, and select “File” ![]() “Open.”
“Open.”
• Once the executable is loaded into BinVis, choose a data visualization schema in which to view the file using the “View” toolbar option.
• BinVis has seven different data visualization schemas in addition to a hexadecimal viewer and a strings viewer.
Byte Plot: Maps each byte in the file to a pixel in the display window.
RGB Plot: Similar to Byte Plot but uses red, green, and blue pixels (3 bytes per pixel).
Bit Plot: Maps each bit in the file to a pixel in the display window.
Attractor Plot: Visual plot display based upon chaos theory.
Dot Plot: Displays detected sequences of repeated bytes contained within a file.
Byte Presence: A condensed version of Byte Plot causing data patterns to be more pronounced.
ByteCloud: Visual cloud of bytes generate from file contents.
• A powerful feature of BinVis is coordinated windows—or the interplay between the various data display windows; clicking on a target data region in one viewing pane causes the data in the other open viewing panes to adjust and transition to the same region.
• Another novel aspect of BinVis is the navigator feature. Based upon a “VCR motif” this interface allows the digital investigator to navigate forward or backward through the visualized data.
• In the example displayed in Figure 6.83, three malicious code specimens were examined—two of which were Boxerkit154 and one an SSHDoor specimen.155 Visualizing the executables through the BinVis Byte Plot view, the two similar specimens are quickly discernible from the third, dissimilar specimen.

Behavioral Profiling and Classification
In addition to comparing the visualized runtime trajectory of target executables, the runtime behavioral profile of executables can also be used as a method of identifying similar specimens. At the time of this writing no frameworks exist for the runtime behavioral profile of ELF files. However, this process can be used as a valuable triage, clustering, and classification method for unknown Windows PE malware specimens.
• Malware behavioral profiles can be classified with Malheur,156 a framework for automatic analysis of malware behavior. Malheur is a command-line tool that can be compiled on Linux, Macintosh OS X, and OpenBSD platforms using the standard compilation procedure for GNU software.157
• Malheur processes datasets—reports of malware behavior recorded and compiled from the ThreatTrack Security ThreatAnalyzer (formerly CWSandbox/GFI SandBox)158 malware analysis sandbox and into Malware Instruction Set (MIST) format.159 MIST format is not intended for human readability, but rather, it is a generalization of observed malware behavior specialized for machine learning and data mining.
• Datasets can be submitted into Malheur as a directory or a compressed archive (tar.gz, .zip, .pax, .cpio) containing the textual reports for analysis.
Custom datasets can be created by the digital investigator by converting reports from ThreatTrack Security ThreatAnalyzer/ CWSandbox using the cws2mist.py and mist2malheur.py Python scripts associated with the project.160
A repository of datasets is maintained by the University of Mannheim, Laboratory for Dependable Distributed Systems on their Mwanalysis Web site.161
• Malheur conducts four basic types of analysis:
Extraction of prototypes: Identifies and extracts a subset of prototypes, or reports that are typical for a group of homogenous behavior and represent the totality of the larger reports corpus.162
Clustering of behavior: Identifies groups (clusters) of reports containing similar behavior, allowing for the discovery of unique classes of malware.163
Classification of behavior: Previously processed report clusters can be further analyzed through classification, or assigning unknown behavior to known groups of malware. Through this method, Malheur can identify and categorize unique malware variants.164
Incremental analysis: Malheur can be calibrated to process (cluster and classify) reports in “chunks,” reducing system resource requirements. This mode of analysis is particularly beneficial for long-term implementation of Malheur, such as automated application of Malheur against regular malware feeds from honeypot sensors.165
• A dataset can be input into Malheur and processed using the following steps:
2. Use the –o (output) switch and identify the name of the analysis output file (for example, in Figure 6.84, the output file is named out.txt);
3. Select the action to be conducted. An action is the type of analysis applied to the target dataset. Actions include:
| Action | Result |
| distance | Computes a distance matrix of the dataset |
| prototype | Determines a set of prototypes representing the target dataset |
| cluster | Clusters the dataset |
| classify | Classifies a dataset |
| increment | Performs incremental analysis of dataset reports |
| protodist | Computes a distance matrix for prototypes |
4. Incrementally apply analytical actions. For instance, clustering of a dataset must be conducted prior to classification. Similarly, when clustering, Malheur automatically extracts prototypes prior to conducting cluster analysis, as shown in Figure 6.84.
5. Generated analytical results are saved as text files in the Malheur home directory, which by default is ∼/.malheur (located in the user’s home directory).
6. The textual results can be visualized with custom Python scripts (dynamic_threadgraph.png.py; dynamic_treemap.png.py; static_threadgraph.png.py; and static_treemap.png.py), which were developed for Malheur and associated research projects.166

Conclusion
• Carefully consider and plan the malware laboratory environment to ensure success during the various phases of analysis. Establish a flexible, adjustable, and revertible environment to capture the totality of a target specimen’s execution trajectory and infection life cycle.
• To gain a holistic understanding of a target malware specimen, dynamic and static analysis techniques are often used inextricably. Deobfuscation, extracting embedded artifacts, identifying trigger events, and understanding of execution and network trajectory may require repeated and alternating uses of dynamic and static techniques. Maintain detailed documentation of the steps taken during the course of analysis. Refer to the Field Notes at the end of this chapter for documentation guidance.
• During the course of dynamic analysis, use passive and active monitoring tools and other techniques to collect digital impression and trace evidence. Such evidence, when collectively examined along with results of dynamic and static analysis, will elucidate the nature, purpose, and functionality of a suspect program.
• Catalog and classify malicious code specimens in the repository to compare, correlate, and identify relationships between malware. Phylogenetic relationships between specimens may provide insight into their origin, composition, and development. Correlative analysis of archived specimens may also reveal trends in malware infections that may be useful for protecting against future attacks.
 Pitfalls to Avoid
Failure to Establish an Environment Baseline Prior to Examining a Malware Specimen
 Analysis of a post-runtime system state without comparison to a system baseline makes identifying system changes challenging.
☑ Before beginning an examination of the malicious code specimen, establish a baseline environment by taking a “snapshot” of the system that will be used as the “victim” host on which the malicious code specimen will be executed.
☑ Implement a utility that allows comparison of the state of the system after the code is executed to the pristine or original snapshot of the system state. In this way, changes made to the baseline (original) system state can be quickly and accurately identified.
Incomplete Evidence Reconstruction
Limited or incomplete evidence reconstruction prevents a holistic understanding of the nature, purpose, and capabilities of a malicious code specimen. Further, without fully reconstructing the artifacts and events associated with the dynamic analysis of a malicious code specimen, the digital investigator will have limited insight into impact the specimen makes on a victim system.
☑ Fully examine and correlate data collected through active and passive monitoring techniques to gain a complete understanding about the malicious code specimen’s capabilities and its affect on a victim system.
☑ Take detailed notes, not only for specific monitoring processes and results, but for the totality of the evidence and how each evidentiary item interrelates (or does not relate). Consult the Field Notes located in the appendices in this chapter for additional guidance and a structured note taking format.
Incorrect Execution of a Malware Specimen
Ineffectively executing a target malware specimen can adversely impact all dynamic analysis investigative findings.
☑ Execution of a target specimen is often contingent upon file profile. Unlike Executable and Linkable Format (ELF) files that can be invoked through other tools, such as installation monitors or system call monitors, malicious document files such as PDFs and MS Office files typically require the digital investigator to manually open and execute a target file by double-clicking on it. While at the time of this writing there are no known malicious document files targeting Linux systems, threat trends reveal that as the Linux market share burgeons, attackers are increasingly developing sophisticated malware—including specimens that target desktop Linux users. Thus, malicious document files targeting Linux are likely on the threat horizon.
☑ Similarly, some malware specimens require user interaction, such as mouse clicks through dialog boxes to fully execute. A common example of this is rogue (fake) anti-virus or scareware. Thus, statically executing such a specimen through an installation monitor will not fully capture the specimen’s execution trajectory, behavior, and functionality.
Solely Relying upon Automated Frameworks or Online Sandbox Analysis of a Malware Specimen
Although automated malware analysis frameworks can provide insight into the nature of identified malicious code (at the time of this writing there are no frameworks that process ELF files), they should not be solely relied upon to reveal the purpose and functionality of a suspect program. Conversely, the fact that automated analysis of a malware specimen does not reveal indicia of infection does not mean that it is innocuous.
☑ Online malware sandbox analysis of a target or “similar” malware specimen can be helpful guidance, but it should not be considered dispositive in all circumstances.
☑ Third-party analysis of a similar malware specimen by a reliable source can be an incredibly valuable resource—and may even provide predictors of what will be discovered in your particular specimen.
☑ While this correlative information should be considered in the totality of your investigation it should not replace thorough independent analysis.
Submitting Sensitive Files to Online Analysis Sandboxes
Do not submit a malware specimen that is the crux of a sensitive investigation (i.e., circumstances in which disclosure of an investigation could cause irreparable harm to a case) to online analysis sandboxes in an effort not to alert the attacker.
☑ By submitting a malware specimen to a third-party Web site, you are no longer in control of that specimen or the data associated with that specimen. Savvy attackers often conduct extensive open source research and search engine queries to determine whether their malware has been detected.
☑ The results relating to a submitted specimen to an online malware analysis service are publicly available and easily discoverable—many portals even have a search function. Thus, as a result of submitting a target malware specimen, the attacker may discover that his malware and nefarious actions have been discovered—resulting in the destruction of evidence, and potentially damaging your investigation.
Failure to Adjust the Laboratory Environment to Ensure Full Execution Trajectory
The behavior and interaction of the malicious code specimen with the victim system and external network resources will likely not be revealed if the digital investigator does not adjust the laboratory environment based upon the specimen’s trajectory requirements.
☑ Through adjusting the malware lab environment and providing the resources that the specimen needs, the digital investigator can conduct trajectory reconstruction and re-enact the manner and path the specimen takes to successfully complete the life cycle of infection.
☑ Perpetuating the infection life cycle and adjusting the laboratory environment to fulfill trajectory is a process known as trajectory chaining; be certain to document each step of the trajectory and the associated chaining steps.
☑ To facilitate trajectory chaining, accommodate the sequential requests made by the suspect program
Failure to Examine Evidence Dynamics During and After the Execution of Malware Specimen
Do not make investigative conclusions without considering the totality of evidence dynamics.
☑ One of the primary goals of forensic analysis is to reconstruct the events surrounding a crime. Three common analysis techniques that are used in crime reconstruction are temporal, functional, and relational analysis.
☑ The most commonly known form of temporal analysis is the time line.
☑ The goal of functional analysis is to understand what actions were possible within the environment of the malware incident, and how the malware actually behaves within the environment (as opposed to what it was capable of doing).
☑ Relational analysis involves studying how components of malware interact, and how various systems involved in a malware incident relate to each other.
☑ Insight into the evidence dynamics created by a target malware specimen can be acquired during active monitoring as well as post-run evidence reconstruction—such as the examination of passive monitoring data and collected digital impression and trace evidence.
Failure to Examine the Embedded Artifacts of a Target Malware Specimen After it is Executed and Extracted from Obfuscation Code
Critical clues embedded in a target malware specimen can be missed if the specimen is not deeply examined after it is executed (and potentially extracted from obfuscation code). Failure to gather this information can adversely affect investigative findings and how to proceed with the larger investigation.
☑ After removing a malware specimen from its obfuscation code, harvest valuable information from the contents of the file, which would potentially provide valuable insight into the nature and purpose of the malware—such as strings, symbols, file metadata, file dependencies, ELF structure, and contents.
☑ To gather additional meaningful clues that will assist in the continued analysis of a malicious code specimen, consider conducting a full file profile (including digital virology processes) of the deobfuscated specimen.


Automated malware analysis frameworks are a helpful solution for efficiently triaging and processing malicious code specimens in an effort to gain quick intelligence about the specimens by automating the behavioral analysis process. Over the last few years, a number of researchers have developed automated malware analysis frameworks, which combine and automate a myriad of processes and tools to collectively monitor and report on the runtime behavior of a target malicious code specimen. While many of these tools are developed for installation on Linux platforms, at the time of this writing there are no automated malware analysis frameworks that process ELF files. However, these solutions may be useful during the file profiling process when seeking to triage suspected files prior to knowing the respective file type, target operating system, nature, and purpose of the specimen.


Online malware sandboxes are a helpful analytical option to either quickly obtain a behavioral analysis overview of suspect program, or to use as a correlative investigative tool. These services (which at the time of this writing are free of charge) are distinct from vendor-specific malware specimen submission Web sites, or online virus scanners (such as VirusTotal, Jotti Online Malware Scanner, and VirScan, as discussed in Chapter 5). Unlike online malware scanners, online malware sandboxes execute and process the malware in an emulated Internet, or “sandboxed” network, and generally provide the submitting party a comprehensive report detailing the system and network activity captured in the sandboxed system and network. While at the time of this writing there are no online malware analysis sandboxes that process Linux ELF files, these services can nonetheless be useful as a pre-analysis triage platform to identify file types and files of interest.
As we discussed in Chapter 5 with the submission of samples to virus scanning Web sites, submission of any specimen containing personal, sensitive, proprietary, or otherwise confidential information, may violate a victim company’s corporate policies or otherwise offend the ownership, privacy, or other corporate or individual rights associated with that information. Seek the appropriate legal guidance in this regard before releasing any such specimen for third-party examination. Similarly, remember that by submitting a file to a third party Web site, you are no longer in control of that file or the data associated with that file. Savvy attackers often conduct extensive open source research and search engine queries to determine if their malware has been detected. The results relating to a file submitted to an online malware analysis service are publicly available and easily discoverable—many portals even have a search function. Thus, as a result of submitting a suspect file, the attacker may discover that his malware and nefarious actions have been discovered, resulting in the destruction of evidence, and potentially damaging your investigation.


Selected Readings
Books
1. Eagle C. The IDA Pro Book: The Unofficial Guide to the World’s Most Popular Disassembler. San Francisco: No Starch Press.; 2008.
2. Jones K, Bejtlich R, Rose C. Real Digital Forensics: Computer Security and Incident Response. Boston: Addison-Wesley Professional.; 2005.
3. Ligh M. Malware Analyst’s Cookbook and DVD: Tools and Techniques for Fighting Malicious Code. New York: Wiley; 2010.
4. Malin C, Casey E, Aquilina J. Malware Forensics: Investigating and Analyzing Malicious Code. Syngress: Waltham, MA; 2008.
5. Skoudis E, Zelster L. Malware: Fighting Malicious Code. Upper Saddle River, NJ: Prentice Hall; 2003.
6. Szor P. The Art of Computer Virus Research and Defense. Mountain View, CA: Symantec Press; 2005.
Papers
1. Bayer, U., Kirda, E., & Kruegel, C. (2010). Improving the Efficiency of Dynamic Malware Analysis, Proceedings of the 2010 ACM Symposium on Applied Computing (SAC ‘10).
2. Beuacamps, P., Gnaedig, I., & Marion, J. (2010). Behavior Abstraction in Malware Analysis, Proceedings of the First International Conference on Runtime Verification (RV ‘10).
3. Bilar, D. (2008). Statistical Structures: Fingerprinting Malware for Classification and Analysis, Proceedings of Black Hat USA 2008.
4. Brand, M. (2007). Forensics Analysis Avoidance Techniques of Malware, Proceedings of the 2007 SeCau Security Congress.
5. Hu, X., Chiueh, T., & Shin, K. (2009). Large-Scale Malware Indexing Using Function-Call Graphs, Proceedings of the 16th ACM Conference on Computer and Communication Security (CCS ‘09).
6. Islam, R., et al. (2010). Classification of Malware Based on String and Function Feature Selection, Proceedings of the Second Cybercrime and Trustworthy Computing Workshop.
7. Kang, M., Poosankam, P., & Yin, H. (2007). Renovo: A Hidden Code Extractor for Packed Executables, WORM ‘07, Proceedings of the 2007 ACM workshop on Recurring Malcode.
8. Kinable, J. & Kostakis, O. (2011). Malware Classification Based on Call Graph Clustering, Journal in Computer Virology, Volume 7, Issue 4, pp 233-245.
9. Leder, F., Steinbock, B., & Martini, P. (2009). Classification and Detection of Metamorphic Malware using Value Set Analysis, Proceedings of the Fourth International Conference on Malicious and Unwanted Software (Malware 2009).
10. Park, Y. (2010). Fast Malware Classification by Automated Behavioral Graph Matching, Proceedings of the Sixth Annual Workshop on Cyber Security and Information Intelligence Research (CSIIRW ‘10).
11. Royal, P., et al. (2006). PolyUnpack: Automating the Hidden-Code Extraction of Unpack-Executing Malware, Proceedings of the 22nd Annual Computer Security Applications Conference (ACSAC ‘06).
12. Sathyanarayan, V., Kohli, P., & Bruhadeshwar, B. (2008). Signature Generation and Detection of Malware Families, Proceedings of the 13th Australasian Conference on Information Security and Privacy, (ACISP ‘08).
13. Yegneswaran, V., et al. (2008). Eureka: A Framework for Enabling Static Analysis on Malware, Technical Report Number SRI-CSL-08-01, SRI Project 17382.
14. Zhao, H., et al. (2010). Malicious Executable Classification Based on Behavioral Factor Analysis, 2010 International Conference on e-Education, e-Business, e-Management and e-Learning.
1For more information about VMware, go to http://www.vmware.com/.
2For more information about VirtualBox, go to http://www.virtualbox.org/.
3For more information, go to http://www.f-secure.com/v-descs/torn.shtml.
4For more information about Open Source Tripwire, go to http://sourceforge.net/projects/tripwire/.
5For more information about AIDE, go to http://aide.sourceforge.net/.
6For more information about SAMHAIN, go to http://www.la-samhna.de/samhain/.
7For more information about OSSEC, go to http://www.ossec.net/.
8http://www.malwarefieldguide.com/LinuxChapter6.html.
9For more information about InstallWatch, go to http://asic-linux.com.mx/~izto/checkinstall/installwatch.html.
10For more information about ps (which is native on Linux systems and a part of the procps tool suite), go to http://procps.sourceforge.net/.
11For more information about pstree (which is native on most Linux systems and a part of the PSmisc suite), go to http://psmisc.sourceforge.net/.
12For more information about top (which is native on Linux systems and a part of the procps tool suite), go to http://procps.sourceforge.net/.
13For more information about Linux Process Explorer, go to http://sourceforge.net/projects/procexp/.
14For more information about lsof, go to ftp://lsof.itap.purdue.edu/pub/tools/unix/lsof/; latest FAQ: ftp://lsof.itap.purdue.edu/pub/tools/unix/lsof/FAQ; latest man page: ftp://lsof.itap.purdue.edu/pub/tools/unix/lsof/lsof_man.
15For more information about the watch command, go to http://linux.die.net/man/1/watch.
16For more information about fuser (which is native to many Linux systems and a part of the PSmisc suite), go to http://psmisc.sourceforge.net/.
17For more information about inotify, go to https://www.kernel.org/pub/linux/kernel/people/rml/inotify/.
18For more information about FAM, go to http://oss.sgi.com/projects/fam/.
19For more information about Gamin, go to https://people.gnome.org/~veillard/gamin/.
20For more information about GLSOF, go to http://glsof.sourceforge.net/.
21For more information about Mortadelo, go to http://gitorious.org/mortadelo and http://people.gnome.org/~federico/news-2007-06.html#mortadelo.
22For more information about GLSOF FileMonitor, go to http://glsof.sourceforge.net/filemonitor/. The command to invoke FileMonitor as instructed on the tool’s Web site is: $> java -Djava.security.policy=path/security-client.txt -jar path/filemonitor.jar. Installation of default-jre allows for the basic invocation described in the chapter body.
23For more information about GLSOF Queries, go to http://glsof.sourceforge.net/queries/.
24For more information about tcpdump, go to http://www.tcpdump.org/.
25For more information about tcpdump, go to www.tcpdump.org/tcpdump_man.html.
26For more information about Wireshark, go to http://www.wireshark.org/.
27For more information about EtherApe, go to http://etherape.sourceforge.net/.
28For more information about jpcap, go to http://jpcap.sourceforge.net/.
29For more information about Net Activity Viewer, go to http://netactview.sourceforge.net.
30For more information about KConnections, go to http://kde-apps.org/content/show.php/KConnections?content=71204.
31For more information about TCPView, go to http://technet.microsoft.com/en-us/sysinternals/bb897437.aspx.
32strace is native to Linux systems but the project is maintained on SourceForge. For more information, go to http://sourceforge.net/projects/strace/.
33For more information about Systemtap, go to http://sourceware.org/systemtap/ and http://sourceware.org/systemtap/wiki.
34ltrace is native to Linux systems but the project is maintained on Freecode. For more information, go to http://freecode.com/projects/ltrace.
35For more information about Mortadelo, go to http://gitorious.org/mortadelo/pages/Home and https://people.gnome.org/~federico/news-2007-06.html#mortadelo.
36For more information about Snort, go to http://www.snort.org/.
37For more information about Snort, go to, http://manual.snort.org/.
38For more information, see, http://www.snort.org/docs/.
39http://www.elsevier.com/books/snort-intrusion-detection-and-prevention-toolkit/caswell/978-1-59749-099-3.
40For more information, go to http://www.snort.org/snort-rules#registered.
41For more information, go to http://www.snort.org/snort-rules#community.
42For more information about SystemTap, go to http://sourceware.org/systemtap/.
43For information on how SystemTap scripts work, go to http://sourceware.org/systemtap/SystemTap_Beginners_Guide/scripts.html.; for a listing of useful scriptsgo to http://sourceware.org/systemtap/SystemTap_Beginners_Guide/useful-systemtap-scripts.html.
44For more information about inotify, go to https://www.kernel.org/pub/linux/kernel/people/rml/inotify/.
45For more information about FAM, go to http://oss.sgi.com/projects/fam/.
46For more information about Gamin, go to https://people.gnome.org/~veillard/gamin/.
47http://www.vmware.com/pdf/ws80-getting-started.pdf, p. 54.
48On Linux systems, the default system path for the .vmem file of a respective suspended virtual machine is /home/<user>/vmware/<guest VM name>/<vm name-uuid>.vmem.
49For more information about SecondLook, go to http://secondlookforensics.com/.
50For more information about Volatility go to, https://www.volatilesystems.com/default/volatility and http://code.google.com/p/volatility/.
51On Linux systems, the default system path for the .vmem file of a respective snaphot is /home/<user>/vmware/<guest VM name>/<snapshot_name_and_number>.vmem.
For further information about snapshots, go to http://pubs.vmware.com/vsphere-50/index.jsp?topic=%2Fcom.vmware.vsphere.vm_admin.doc_50%2FGUID-38F4D574-ADE7-4B80-AEAB-7EC502A379F4.html.
52For more information on how VMware ESX creates and uses .vmss files, go to http://pubs.vmware.com/esx254/admin/wwhelp/wwhimpl/common/html/wwhelp.htm?context=admin&file=esx25admin_running.5.14.html.
53For information on how Volatility can be used to analyze snapshot files, go to http://code.google.com/p/volatility/wiki/VMwareSnapshotFile.
54For more information about SecondLook, go to http://secondlookforensics.com/.
55For more information about Volatility go to, https://www.volatilesystems.com/default/volatility and http://code.google.com/p/volatility/.
56For more information about InstallWatch, go to http://asic-linux.com.mx/~izto/checkinstall/installwatch.html.
57For more information about LeopardFlower, go to http://leopardflower.sourceforge.net/.
58For more information about TuxGuardian, go to http://tuxguardian.sourceforge.net/.
59For more information about Program Guard (pgrd), go to http://pgrd.sourceforge.net/.
60For more information about BIND, go to http://www.isc.org/downloads/bind/.
61For more information about djbdns/tinydns, go to http://cr.yp.to/djbdns.html.
62For more information about MaraDNS, go to http://www.maradns.org/.
63For more information about Dnsmasq, go to http://www.thekelleys.org.uk/dnsmasq/doc.html.
64For more information about INetSim, go to http://www.inetsim.org/.
65For an example of a Trojan downloader that targeted Linux and other operating systems, see, http://www.zdnet.com/cross-platform-trojan-checks-your-os-attacks-windows-mac-linux-7000000656/.
66For more information about netcat, go to http://netcat.sourceforge.net/.
67For more information, go to http://joncraton.org/files/nc111nt.zip.
68For more information about the Wirenet Trojan, go to http://news.techworld.com/security/3378804/linux-users-targeted-by-password-stealing-wirenet-trojan/.
69For more information about Linux Process Explorer, go to http://sourceforge.net/projects/procexp/.
70For more information about pmap, go to procps.sourceforge.net/.
71For more information about gcore, go to http://manpages.ubuntu.com/manpages/lucid/man1/gcore.1.html.
72For more information about gdb, go to https://www.gnu.org/software/gdb/.
73For more information about objdump, go to http://www.gnu.org/software/binutils/.
74For more information about Process Dumper, go to http://www.trapkit.de/research/forensic/pd/.
75For more information about Memory Parser, go to http://www.trapkit.de/research/forensic/mmp/index.html.
76For more information about Net Activity Viewer, go to http://netactview.sourceforge.net/download.html.
77strace is native to Linux systems but the project is maintained on SourceForge. For more information, go to http://sourceforge.net/projects/strace/.
78For more information about SystemTap, go to http://sourceware.org/systemtap/.
79For more information about Mortadelo, go to http://people.gnome.org/~federico/news-2007-06.html#mortadelo.
80For more information about SystemTap, go to http://sourceware.org/systemtap/.
81SystemTap Beginners Guide, Edition 2.2 (available from http://sourceware.org/systemtap/SystemTap_Beginners_Guide/ and http://sourceware.org/systemtap/SystemTap_Beginners_Guide.pdf.
82SystemTap Beginners Guide, Edition 2.2, page 7.
83SystemTap Beginners Guide, Edition 2.2, page 11. For resources offering SystemTap scripts, go to http://sourceware.org/systemtap/wiki/ScriptsTools and http://sourceware.org/systemtap/examples/.
84For more information about FileMon, go to http://technet.microsoft.com/en-us/sysinternals/bb896642.aspx.
85For more information about ltrace, go to http://www.ltrace.org/.
86For more information about the GNU Project Debugger, go to http://www.gnu.org/software/gdb/.
87For more information about IDA Pro, go to http://www.hex-rays.com/idapro/. Although the tool sells for approximately $600, there is a freeware version (with slightly less functionality, features, and support) for non-commercial use available for download (http://www.hex-rays.com/idapro/idadownfreeware.htm).
88For more information about objdump, go to http://www.gnu.org/software/binutils/.
89For more information about Dissy, go to http://code.google.com/p/dissy/.
90For more information about ldasm, go to http://freecode.com/projects/ldasm.
91For more information about lida, go to http://lida.sourceforge.net/.
92http://www.amazon.com/IDA-Pro-Book-Unofficial-Disassembler/dp/1593271786.
93For more information about HTTrack, go to http://www.httrack.com/.
94For more information about wget, go to http://www.gnu.org/software/wget/.
95There are some legal and ethical considerations with this method. First, the content of the Web site may be copyright protected or otherwise categorized as intellectual property and fall within the proscriptions of certain international, federal, state, or local laws, making it a violation of civil or criminal law to copy it without permission. Similarly, as the tools used to acquire the contents of a Web site by recursively copying directories, HTML, images, and other files being hosted on the target Web site may be considered “hacking tools” in some jurisdictions. Similarly, the act of recursively copying the content of a site may also be considered an aggressive or hostile computing activity, potentially viewed as unethical or illegal in some jurisdictions. Consultation with appropriate legal counsel prior to implementing these tools and techniques is strongly advised and encouraged.
96Some of the more popular malicious code repository Web sites for digital investigators and researchers include Open Malware (http://oc.gtisc.gatech.edu:8080/), Malware.lu, and Contagio Malware Dump (http://contagiodump.blogspot.com/).
97For more information about RUMINT, go to http://rumint.org/.
98For more information about Chaosreader, go to http://chaosreader.sourceforge.net/.
99For more information about Xplico, go to http://www.xplico.org/.
100For more information about Network Miner, go to http://www.netresec.com/?page=Blog&month=2011-12&post=No-more-Wine-NetworkMiner-in-Linux-with-Mono.
101For more information about capinfos, go to, http://www.wireshark.org/docs/man-pages/capinfos.html.
102For more information about Tcptrace, go to, http://www.tcptrace.org/.
103For more information about tcpdstat, go to http://staff.washington.edu/dittrich/talks/core02/tools/tools.html; http://www.sonycsl.co.jp/~kjc/papers/freenix2000/node14.html.
104At the time of this writing RUMINT does not natively run on Linux; to install and run it on a Linux analysis system, WINE (http://www.winehq.org/) must be installed.
105For more information about ngrep, go to http://ngrep.sourceforge.net/.
106For more information about the script, go to http://www.ibm.com/developerworks/linux/library/l-systemtap/. In this article, the script is targeting the syslog, thus the example script name is “syslog_profile.stp.”
107http://manual.snort.org/node21.html.
108For more information about SecondLook, go to http://secondlookforensics.com/.
109For more information about nmap, go to http://nmap.org/.
110For more information about OpenVAS, go to http://www.openvas.org/.
111For more information about Nessus, go to http://www.tenable.com/products/nessus.
112For more information about chkrootkit, go to http://freecode.com/projects/chkrootkit.
113For more information about Rootkit Hunter (rkhunter), go to http://rkhunter.sourceforge.net/.
114For more information about unhide, go to http://sourceforge.net/projects/unhide/.
115For more information about the Rootcheck Project, go to http://rootcheck.sourceforge.net/.
116Edwards AWF, Cavalli-Sforza LL, Systematics Assoc. Publ. No. 6: Phenetic and Phylogenetic Classification. ed. Reconstruction of evolutionary trees. pp. 67–76.
117Hayes M, Walnstein A, Lakhotia A, Evaluation of malware phylogeny modelling systems using automated variant generation, Journal in Computer Virology , vol. 5, no. 4, pp. 335–343, 2009.
136For more information about ssdeep, go to http://ssdeep.sourceforge.net.
137For more information about Chapro malware, go to http://www.symantec.com/security_response/writeup.jsp?docid=2012-122012-3441-99http://contagiodump.blogspot.com/2012/12/dec-2012-linuxchapro-trojan-apache.html.
138For more information about YARA, go to http://code.google.com/p/yara-project/.
139YARA User’s Manual Version 1.6.
140YARA User’s Manual Version 1.6, page 22.
141YARA User’s Manual Version 1.6, pages 3–4.
142YARA User’s Manual Version 1.6, page 4.
143http://code.google.com/p/yara-project/downloads/detail?name=YARA%20User%27s%20Manual%201.6.pdf.
144For more information about Chapro malware, go to http://www.symantec.com/security_response/writeup.jsp?docid=2012-122012-3441-99; http://contagiodump.blogspot.com/2012/12/dec-2012-linuxchapro-trojan-apache.html.
145Hayes M, Walenstein A., Lakhotia A, Evaluation of Malware Phylogeny Modeling Systems Using Automated Variant Generation, Journal in Computer Virology, 2009, vol. 5, no. 4, pp. 335—343.
146For more information about BinDiff, go to http://www.zynamics.com/bindiff.html.
147Zynamics BinDiff 3.2 Manual, pages 6–7.
148For details on the BinDiff Matching Strategy and process refer to the BinDiff 3.2 Manual.
149Zynamics BinDiff 3.2 Manual, pages 11–12.
150For more information about pcat, go to http://www.porcupine.org/forensics/tct.html.
151For a detailed discussion of ssdeep, refer to Chapter 5.
152For more information about BinVis, go to http://code.google.com/p/binvis/. Currently BinVis does not natively install and run in Linux; WINE must be installed on the Linux analysis system.
153For more information about WINE, go to http://www.winehq.org/.
154For more information about Boxerkit, go to http://www.symantec.com/security_response/writeup.jsp?docid=2007-072612-1704-99&tabid=2.
155For More information about SSHDoor, go to http://www.symantec.com/security_response/writeup.jsp?docid=2013-012808-1032-99.
156For more information about Malheur, go to http://www.mlsec.org/malheur/; http://honeyblog.org/junkyard/paper/malheur-TR-2009.pdf (Automatic Analysis of Malware Behavior using Machine Learning, Rieck K, Trinius P, Willems C, & Holz T. Journal of Computer Security, 19(3), 2011.
157http://www.mlsec.org/malheur/install.html.
158http://www.threattracksecurity.com/resources/sandbox-malware-analysis.aspx.
159Trinius P, Willems C, Holz T, & Rieck K. (2009). A Malware Instruction Set for Behavioral-Based Analysis. Technical Report TR-2009-07, University of Mannheim (www.mlsec.org/malheur/docs/mist-tr.pdf).
160The python scripts can be found (cached) at http://webcache.googleusercontent.com/search?client=ubuntu&channel=fs&q=cache:kU3pcCzy-ZAJ:https://mwanalysis.org/inmas/maschinellesLernen/mist/%2Bcws2mist.py&oe=utf-8&hl=en&ct=clnk.
161http://pi1.informatik.uni-mannheim.de/malheur/.
162Automatic Analysis of Malware Behavior using Machine Learning, p. 8; Rieck, K. (2011). Malheur Version 0.5.0, User Manual, p. 2.
163Rieck, K. (2011). Malheur Version 0.5.0, User Manual, p. 2.
164Rieck, K. (2011). Malheur Version 0.5.0, User Manual, p. 2.
165Rieck, K. (2011). Malheur Version 0.5.0, User Manual, p. 2.
166The Python scripts can be found on http://mwanalysis.org/inmas/backend/visualisierung/.