I. HEATING CURVES
A. WHAT ARE THEY?
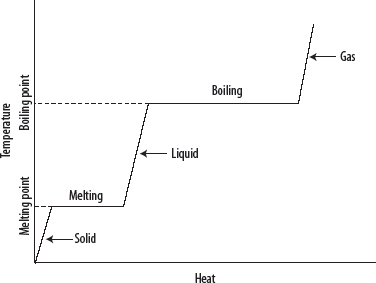
1. Heating curves are plots of temperature against time (at constant pressure) that result when heating a solid substance through its melting and boiling points until it becomes a heated gas.
B. INTERPRETING THE HEATING CURVE
1. Starting with a solid below its melting point, the following is observed.
i. The temperature of the solid increases at a constant rate until it begins to melt.
ii. When melting begins, the temperature is constant until the solid has all turned to liquid.
iii. The temperature of the liquid increases at a constant rate until it begins to boil.
iv. When boiling begins, the temperature is constant until the liquid has all turned to gas.
v. The temperature of the gas increases at a constant rate.
vi. In the regions where the temperature of the solid, liquid, or gas is being increased, the amount of energy being added can be calculated using q = m c ΔT, where m is mass, c is the specific heat capacity of the substance being heated, and ΔT is the temperature change.
a) Standard enthalpy of fusion. This is energy change when 1 mole of a substance is converted from a solid to a liquid. Where the solid is melting, the amount of energy being added can be calculated using q = (ΔHfusion)(moles).
b) Standard enthalpy of vaporization. This is energy change when 1 mole of a substance is converted from a liquid to a gas. Where the liquid is boiling, the amount of energy being added can be calculated using q = (ΔHvaporization)(moles).
c) These are endothermic processes because energy must be added.
vii. A plateau region represents a stage when two phases are in equilibrium with one another.

Here is a helpful way to understand the process: the energy being added is either being used to increase temperature OR is being used to effect a phase change—not both.
II. COOLING CURVES
A. WHAT ARE THEY?
1. Cooling curves are plots of temperature against time (at constant pressure) that result when cooling a gaseous substance through its condensation and freezing points until it becomes a cooled solid.
B. INTERPRETING THE COOLING CURVE
1. Starting with a gas above its boiling point, the following is observed (see the following diagram):
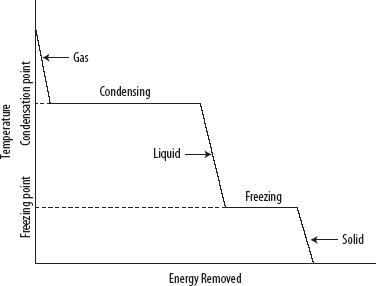
i. The temperature of the gas decreases at a constant rate until it begins to condense.
ii. When condensing begins, the temperature is constant until the gas has all turned to liquid.
iii. The temperature of the liquid decreases at a constant rate until it begins to freeze.
iv. When freezing begins, the temperature is constant until the liquid has all turned to solid.
v. The temperature of the solid decreases at a constant rate.
vi. In the regions where the temperature of the solid, liquid, or gas is being decreased, the amount of energy being removed can be calculated using q = m c ΔT, where m is mass, c is the specific heat capacity of the substance being heated, and ΔT is the temperature change.
a) Where the gas is condensing, the amount of energy being removed can be calculated using q = (ΔHvaporization)(moles).
b) Where the liquid is freezing, the amount of energy being removed can be calculated using q = (ΔHfusion)(moles).
c) These are exothermic processes because energy must be removed.
vii. A plateau region represents a stage when two phases are in equilibrium with one another.
viii. It is possible that some liquids may exhibit supercooling. This is where a liquid is cooled to a temperature below its melting point but remains a liquid. This is a meta-stable state from which solidification can be initiated by shaking or seeding.
Any exothermic process must be accompanied by an equivalent endothermic process, so if a substance is losing energy and cooling down, then that energy must be transferred to the surroundings, which will be gaining energy and heating up (and vice versa). This is an application of the law of conservation of energy and can be summarized as energy lost − energy gained.