Chapter 2
Atmosphere, Altitude, and Airspeed Measurement
PROPERTIES OF THE ATMOSPHERE
The aerodynamic forces and moments acting on an aircraft in flight are due, in great part, to the properties of the air mass in which the aircraft is flying. By volume the atmosphere is composed of approximately 78% nitrogen, 21% oxygen, and 1% other gases. The most important properties of air that affect aerodynamic behavior are its static pressure, temperature, density, and viscosity.
Static Pressure
The static pressure of the air,  , is simply the weight per unit area of the air above the level under consideration. For instance, the weight of a column of air with a cross‐sectional area of 1 ft2 and extending upward from sea level through the atmosphere is 2116 lb. The sea level static pressure is, therefore, 2116 psf (or 14.7 psi). Static pressure is reduced as altitude is increased because there is less air weight above. At 18,000 ft altitude the static pressure is about half that at sea level. Another commonly used measure of static pressure is inches of mercury. On a standard sea level day the air's static pressure will support a column of mercury (Hg) that is 29.92 in. high (Fig. 2.1). Weather reports use a third method of measuring static pressure called millibars, standard pressure here is 1,013.2 mb. In addition to these rather confusing systems, there are the metric measurements in use throughout most of the world. For the discussion of performance problems later in this textbook, we will primarily use the measurement of static pressure in inches of mercury.

Figure 2.1 Standard pressure.
U.S. Department of Transportation Federal Aviation Administration, Pilot's Handbook of Aeronautical Knowledge, 2008
In aerodynamics it is convenient to use pressure ratios, rather than actual pressures. Thus the units of measurement are canceled out:

where  is the sea level standard static pressure (2116 psf or 29.92 in. Hg). Thus, a pressure ratio of 0.5 means that the ambient pressure is one‐half of the standard sea level value. At 18,000 ft, on a standard day, the pressure ratio is 0.4992.
Temperature
The commonly used measures of temperature are the Fahrenheit,  , and Celsius,
  (formerly called centigrade) scales. Aviation weather reports for pilots, as well as performance calculation tables, will usually report the temperature in °C. Neither of these scales has absolute zero as a base, so neither can be used in calculations. Absolute temperature must be used instead. Absolute zero in the Fahrenheit system is −460° and in the Celsius system is −273°. To convert from the Fahrenheit system to the absolute system, called Rankine,
  , add 460 to the °F. To convert from the Celsius system to the absolute system, called Kelvin,
  , add 273 to the °C. The symbol for absolute temperature is
  and the symbol for sea level standard temperature is
  :
:
By using temperature ratios, instead of actual temperatures, the units cancel. The temperature ratio is the Greek letter theta,  :
:

At sea level, on a standard day,  . Temperature decreases with an increase in altitude until the tropopause is reached (36,089 ft on a standard day). It then remains constant until an altitude of about 82,023 ft. The temperature at the tropopause is −69.7°F and
  .
.
Density
Density is the most important property of air in the study of aerodynamics, and is directly impacted by pressure, temperature, and humidity changes. Since air can be compressed and expanded, the lower the pressure, the less dense the air; density is directly proportional to pressure. Increasing the temperature of the air (particles have greater kinetic energy) also decreases the density of the air, so in this case density and temperature have an inverse relationship. Less dense, thinner air has a lower air density and is said to be a higher density altitude (decreasing aircraft performance); more dense, thicker air is said to be a lower density altitude (greater aircraft performance).
Pressure decreases as you climb in altitude, and usually temperature decreases as well to a certain point. Two exceptions occur with temperature decrease with increasing altitude: one is an inversion layer, and the other is in the upper region of the atmosphere near the tropopause where the temperature remains constant and may even rise with increasing altitude periodically. The discussion above would indicate that greater altitude (less dense air) and colder temperature (more dense air) would result in a conflict in regards to density. But usually the effect of a decrease in pressure with altitude overcomes any improvement in performance the colder, dense air may have and a lower density altitude is the rule of thumb the higher in altitude an aircraft climbs.
The effect of moisture content on performance will be largely ignored in this textbook because most textbooks treat the effect of humidity as being negligible for practical purposes, but it is important to understand that water vapor is lighter than air, so moist air is lighter than dry air. As the amount of water vapor increases, the density of the air decreases, resulting in a higher density altitude (decrease in aircraft performance).
Density is the mass of the air per unit of volume. The symbol for density is  (rho):
Standard sea level density is  slugs/ft3. Density decreases with an increase in altitude. At 22,000 ft, the density is 0.001183 slugs/ft3 (about one‐half of sea level density).
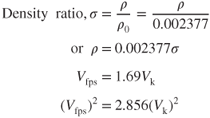
It is desirable in aerodynamics to use density ratios instead of the actual values of density. The symbol for density ratio is  (sigma):

The universal gas law shows that density is directly proportional to pressure and inversely proportional to absolute temperature:

Forming a ratio gives

 is the gas constant and cancels, so the density ratio, or sigma, is a function of pressure and temperature:

Viscosity
Viscosity can be simply defined as the internal friction of a fluid caused by molecular attraction that makes it resist its tendency to flow. The viscosity of the air is important when discussing airflow in the region very close to the surface of an aircraft. This region is called the boundary layer. We discuss viscosity in more detail when we take up the subject of boundary layer theory.
ICAO STANDARD ATMOSPHERE
To provide a basis for comparing aircraft performance in different parts of the world and under varying atmospheric conditions, the performance data must be reduced to a set of standard conditions. These are defined by the International Civil Aviation Organization (ICAO) and are compiled in a standard atmosphere table. An abbreviated table is shown here as Table 2.1. Columns in the table show standard day density, density ratio, pressure, pressure ratio, temperature, temperature ratio, and speed of sound at various altitudes.
Table 2.1 Standard Atmosphere Table
| Altitude (ft) | Density Ratio, σ |  |
Pressure Ratio, δ | Temperature (°F) | Temperature Ratio, θ | Speed of Sound (knots) | Kinematic Viscosity v (ft2/sec) |
| 0 | 1.0000 | 1.0000 | 1.0000 | 59.00 | 1.0000 | 661.7 | .000158 |
| 1,000 | 0.9711 | 0.9854 | 0.9644 | 55.43 | 0.9931 | 659.5 | .000161 |
| 2,000 | 0.9428 | 0.9710 | 0.9298 | 51.87 | 0.9862 | 657.2 | .000165 |
| 3,000 | 0.9151 | 0.9566 | 0.8962 | 48.30 | 0.9794 | 654.9 | .000169 |
| 4,000 | 0.8881 | 0.9424 | 0.8637 | 44.74 | 0.9725 | 652.6 | .000174 |
| 5,000 | 0.8617 | 0.9283 | 0.8320 | 41.17 | 0.9656 | 650.3 | .000178 |
| 6,000 | 0.8359 | 0.9143 | 0.8014 | 37.60 | 0.9587 | 647.9 | .000182 |
| 7,000 | 0.8106 | 0.9004 | 0.7716 | 34.04 | 0.9519 | 645.6 | .000187 |
| 8,000 | 0.7860 | 0.8866 | 0.7428 | 30.47 | 0.9450 | 643.3 | .000192 |
| 9,000 | 0.7620 | 0.8729 | 0.7148 | 26.90 | 0.9381 | 640.9 | .000197 |
| 10,000 | 0.7385 | 0.8593 | 0.6877 | 23.34 | 0.9312 | 638.6 | .000202 |
| 15,000 | 0.6292 | 0.7932 | 0.5643 | 5.51 | 0.8969 | 626.7 | .000229 |
| 20,000 | 0.5328 | 0.7299 | 0.4595 | −12.32 | 0.8625 | 614.6 | .000262 |
| 25,000 | 0.4481 | 0.6694 | 0.3711 | −30.15 | 0.8281 | 602.2 | .000302 |
| 30,000 | 0.3741 | 0.6117 | 0.2970 | −47.98 | 0.7937 | 589.5 | .000349 |
| 35,000 | 0.3099 | 0.5567 | 0.2353 | −65.82 | 0.7594 | 576.6 | .000405 |
| 36,089a | 0.2971 | 0.5450 | 0.2234 | −69.70 | 0.7519 | 573.8 | .000419 |
| 40,000 | 0.2462 | 0.4962 | 0.1851 | −69.70 | 0.7519 | 573.8 | .000506 |
| 45,000 | 0.1936 | 0.4400 | 0.1455 | −69.70 | 0.7519 | 573.8 | .000643 |
| 50,000 | 0.1522 | 0.3002 | 0.1145 | −69.70 | 0.7519 | 573.8 | .000818 |
a The tropopause.
ALTITUDE MEASUREMENT
When a pilot uses the term altitude, the reference is usually to altitude above sea level as read on the altimeter, but it is important that the distinction is made to understand what types of altitude exist. When meteorologists refer to the height of the cloud layer above an airfield they are usually referring to the altitude above the field elevation. When air traffic control refers to an altitude at FL180 and above, they are referring to pressure altitude. Understanding what “altitudes” are important at different periods of flight, and the effect of temperature, pressure, and moisture on those altitudes, is imperative for safe flight.
Indicated Altitude
Indicated altitude is the altitude that is read directly from the altimeter and is uncorrected for any errors. In the United States below FL180 the altimeter is set to the current altimeter setting of the field you are departing from or arriving to, or is given by air traffic control for the current area you are flying in. In the U.S., when flying at or above 18,000 feet, altitude is measured in Flight Levels (e.g., FL180 for 18,000 feet). At FL180 the indicated altitude will be equal to pressure altitude as the altimeter setting is set to 29.92″, standard pressure, or QNE. The altitude at which the crew changes to 29.92 is called the transition altitude (TA). When the crew descends for landing, the altitude at which they return the altimeter setting to local barometric pressure corrected to sea level (QNH) is called the transition level (TL). (Remember it this way: 29.92 is selected at the TA, and the “A” stands for aloft, as in climbing or cruise. When returning to land, the TL is set on descent, and “L” stands for low, or landing.)
When QNE is lower than 29.92, the lowest useable flight level is no longer FL180. The lowest useable FL is obtained from the aeronautical publications. For instance, in the US, if the pressure in the area of operations is between 29.91 and 29.42 inches, the lowest useable enroute altitude is FL185. It should also be noted that the TA and TL outside the United States will not always be 18,000. ICAO members set their own values.
Incidentally, QFE is the reference pressure set in the altimeter if the pilot wishes to know the elevation above the airfield. When the aircraft is on the airfield, the altimeter reads zero. QFE is seldom used as it would be of limited value when away from the immediate vicinity of the airfield.
Calibrated altitude is indicated altitude corrected for instrumentation errors.
True Altitude
True altitude is the actual altitude above mean sea level and is referenced as mean sea level (MSL). On most aeronautical charts MSL altitudes are published for man‐made objects such as towers and buildings, as well as for terrain, since this is the altitude closest to the altitude read off the altimeter. An important note is that true altitude will only be the same as indicated altitude when flying in standard conditions, which is very rare. When flying in conditions colder than standard, the altimeter will read a higher altitude then you are flying, so true altitude will be lower than indicated altitude. The same dangerous situation can develop when you are flying from a high pressure area to a low pressure area and the altimeter is not corrected for the local altimeter setting. Your altimeter will interpret the lower pressure as a higher altitude and your true altitude will again be lower than your indicated altitude. From the variations in true altitude versus indicated altitude, the saying was developed “high to low, or hot to cold, look out below.” Of course, this assumes that the altimeter is never reset to local pressure for an entire flight covering a long distance with varying temperatures and pressures.
Absolute Altitude
Absolute altitude is the vertical altitude above the ground (AGL), and can be measured with devices like a radar altimeter. Of course your absolute altitude is more critical the closer to the ground you are flying, so even when not equipped with a radar altimeter a pilot should be aware of their AGL altitude. When conducting an instrument approach in inclement weather, knowledge of your AGL altitude is vital to the safe completion of the approach or execution of a missed approach. Your height above airport (HAA), height above touchdown zone (HAT), and decision height (DH) are all AGL altitudes and should be briefed before the approach.
Pressure and Density Altitude
Regarding aircraft performance, two types of altitude are of most interest to a pilot: pressure altitude and density altitude.
Pressure altitude is that altitude in the standard atmosphere corresponding to a certain static pressure. Pressure altitude is the vertical distance above a standard datum plane where atmospheric pressure is 29.92". In the United States, at FL180 and above the altimeter is always set to 29.92" unless abnormally low pressure exists in the area. Pressure altitude is used in performance calculations to compute true airspeed, density altitude, and takeoff and landing data. Figure 2.2 indicates a convenient way to determine pressure altitude when unable to set 29.92" in the altimeter.

Figure 2.2 Field elevation versus pressure altitude.
U.S. Department of Transportation Federal Aviation Administration, Pilot's Handbook of Aeronautical Knowledge, 2008
When calculating the pressure ratio we will use the standard pressure of 2,116 psf. If the pressure at a certain altitude is 1,455 psf, then the pressure ratio is:

Entering Table 2.1 with this value, we find the corresponding pressure altitude of 10,000 ft.
Density altitude is found by correcting pressure altitude for nonstandard temperature conditions (Fig. 2.3). Pressure altitude and density altitude are the same when conditions are standard. Once pressure altitude has been determined, the density altitude is calculated using outside air temperature. If the temperature is below standard, then the density altitude is lower than pressure altitude and aircraft performance is improved. If the outside air temperature is warmer than standard, the density altitude is higher than pressure altitude and aircraft performance is degraded.
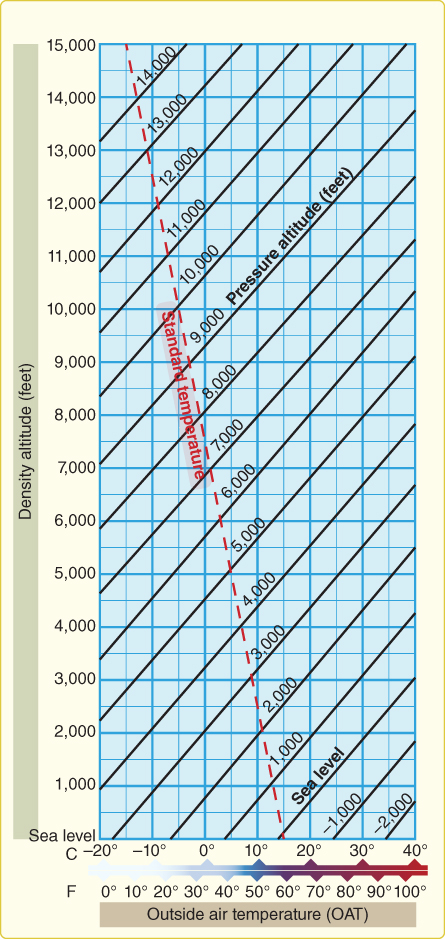
Figure 2.3 Density altitude chart.
U.S. Department of Transportation Federal Aviation Administration, Pilot's Handbook of Aeronautical Knowledge, 2008
When using Table 2.1 instead, if the air has a density ratio of 0.6292, the density ratio column shows that this value corresponds to a density altitude of 15,000 ft. As previously discussed, density altitude influences aircraft performance; the higher the density altitude, the lower aircraft performance. Low air density equals a higher density altitude; high air density equals a lower density altitude. Therefore, aircraft performance charts are provided for various density altitudes.
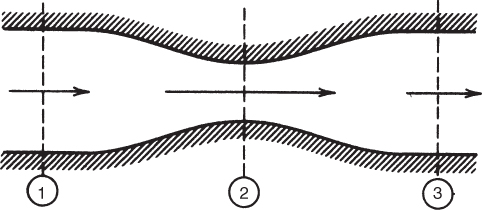
CONTINUITY EQUATION
Consider the flow of air through a pipe of varying cross section, as shown in Fig. 2.4. There is no flow through the sides of the pipe. Air flows only through the ends. The mass of air entering the pipe, in a given unit of time, equals the mass of air leaving the pipe, in the same unit of time. The mass flow through the pipe must remain constant. The mass flow at each station is equal. Constant mass flow is called steady‐state flow. The mass airflow is equal to the volume of air multiplied by the density of the air. The volume of air, at any station, is equal to the velocity of the air multiplied by the cross‐sectional area of that station.

Figure 2.4 Flow of air through a pipe.
The mass airflow symbol  is the product of the density, the area, and the velocity:

The continuity equation states that the mass airflow is a constant:

The continuity equation is valid for steady‐state flow, both in subsonic and supersonic flow. For subsonic flow the air is considered to be incompressible, and its density remains constant. The density symbols can then be eliminated; thus, for subsonic flow,

Velocity is inversely proportional to cross‐sectional area or as cross‐sectional area decreases, velocity increases.
BERNOULLI'S EQUATION
The continuity equation explains the relationship between velocity and cross‐sectional area. It does not explain differences in static pressure of the air passing through a pipe of varying cross sections. Bernoulli, using the principle of conservation of energy, developed a concept that explains the behavior of pressures in gases.
Consider the flow of air through a Venturi tube, as shown in Fig. 2.5. The energy of an airstream is in two forms: It has a potential energy, which is its static pressure, and a kinetic energy, which is its dynamic pressure. The total pressure of the airstream is the sum of the static pressure and the dynamic pressure. The total pressure remains constant, according to the law of conservation of energy. Thus, an increase in one form of pressure must result in a decrease in the other.
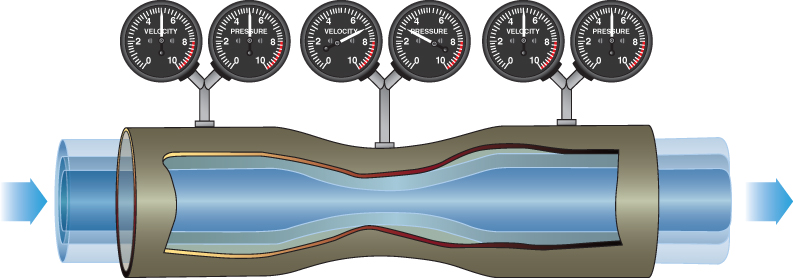
Figure 2.5 Pressure change in a Venturi tube.
U.S. Department of Transportation Federal Aviation Administration, Pilot's Handbook of Aeronautical Knowledge, 2008
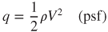
Static pressure is an easily understood concept (see the discussion earlier in this chapter). Dynamic pressure,  , is similar to kinetic energy in mechanics and is expressed by

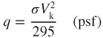
where  is measured in feet per second. Pilots are much more familiar with velocity measured in knots instead of in feet per second, so a new equation for dynamic pressure,
  , is used in this book. Its derivation is shown here:
Substituting in Eq. 2.10 yields

Bernoulli's equation can now be expressed as Total pressure,  = Static pressure,
  + Dynamic pressure,
  :
:

To visualize how lift is developed on a cambered airfoil, draw a line down the middle of a Venturi tube. Discard the upper half of the figure and superimpose an airfoil on the necked down section of the tube (Fig. 2.6). Note that the static pressure over the airfoil is less than that ahead of it and behind it, so as dynamic pressure increases static pressure decreases.
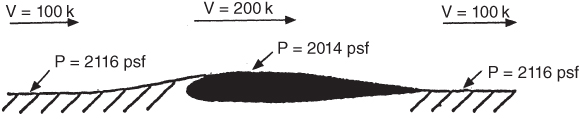
Figure 2.6 Velocities and pressures on an airfoil superimposed on a Venturi tube.
AIRSPEED MEASUREMENT
If a symmetrically shaped object is placed in a moving airstream (Fig. 2.7), the flow pattern will be as shown. Some airflow will pass over the object and some will flow beneath it, but at the point at the nose of the object, the flow will be stopped completely. This point is called the stagnation point. Since the air velocity at this point is zero, the dynamic pressure is also zero. The stagnation pressure is, therefore, all static pressure and must be equal to the total pressure,  , of the airstream.
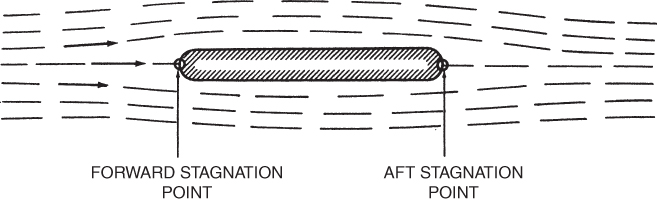
Figure 2.7 Flow around a symmetrical object.
In Fig. 2.8 the free stream values of velocity and pressure are used to measure the indicated airspeed of an aircraft. The pitot tube is shown as the total pressure port and must be pointed into the relative wind for accurate readings. The air entering the pitot tube comes to a complete stop and thus the static pressure, we will refer to as  , in the tube is equal to the total free stream pressure,
  . This pressure is ducted into a diaphragm inside the airspeed indicator.
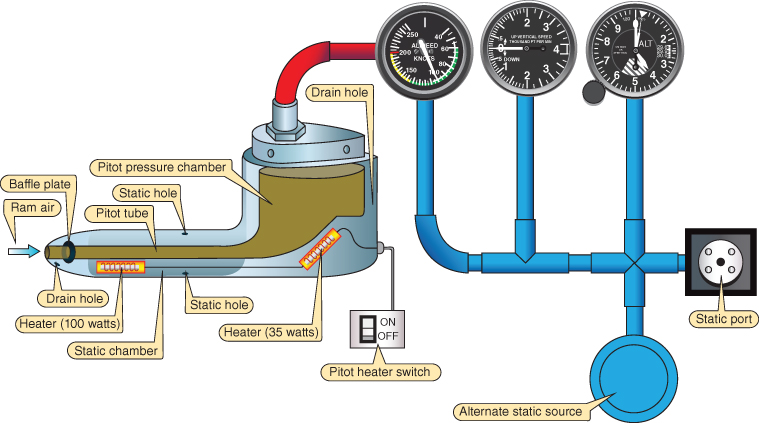
Figure 2.8 Schematic of a pitot–static airspeed indicator.
U.S. Department of Transportation Federal Aviation Administration, Instrument Flying Handbook, 2012
The static pressure port can be made as a part of the point tube or, in more expensive indicators, it can be at a distance from the pitot tube. It should be located at a point where the local air velocity is exactly equal to the airplane velocity. The static port is made so that none of the velocity enters the port. The port measures only static pressure,  for our discussion, and none of the dynamic pressure. The static pressure is ducted into the chamber surrounding the diaphragm within the inside of the airspeed indicator.
Now we have static pressure ( ) inside the diaphragm that is equal to total pressure (
 ), and then static pressure (
 ) measured from the static port outside the diaphragm. The difference between the pressure inside the diaphragm and outside the diaphragm is the differential pressure that deflects the flexible diaphragm that is geared to the airspeed pointer. The airspeed indicator is calibrated to read airspeed. Figure 2.9 shows a modern pitot‐static system associated with an air data computer (ADC).
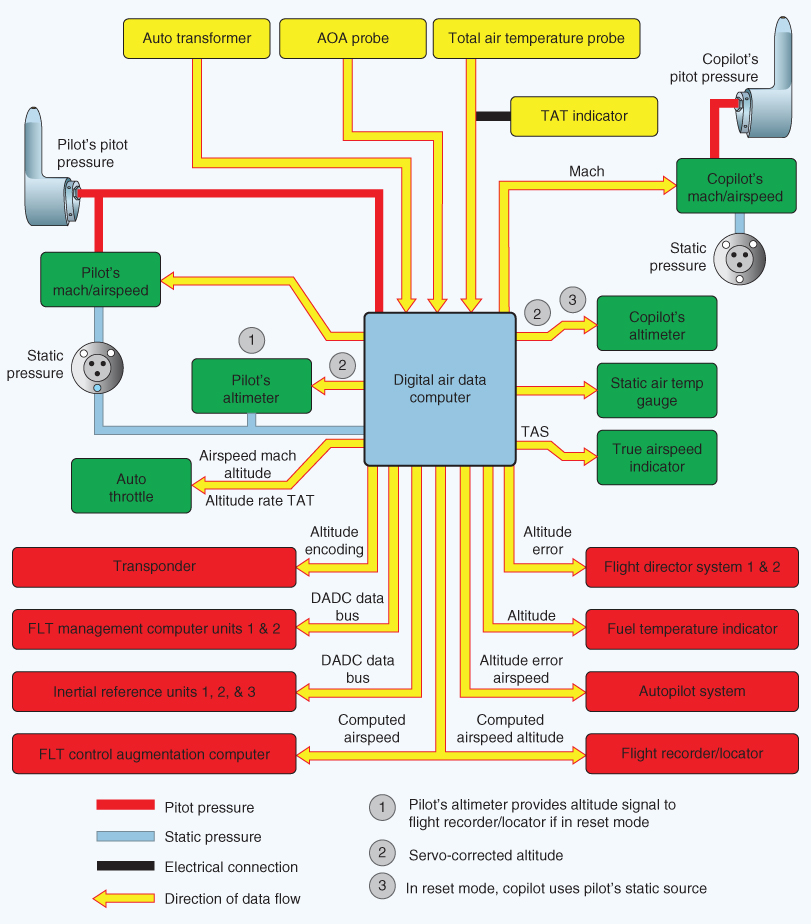
Figure 2.9 Air data computer and pitot‐static sensing.
U.S. Department of Transportation Federal Aviation Administration, Aviation Maintenance Technician Handbook: Airframe, Volume 2, 2012
Indicated Airspeed
Indicated airspeed (IAS) is the reading of the airspeed indicator dial. If there are any errors in the instrument, they will be shown on an instrument error card located near the instrument. Position error results if the static pressure port is not located on the aircraft where the local air velocity is exactly equal to the free stream velocity of the airplane. If this error is present, it will be included in the instrument error chart.
Calibrated Airspeed
Calibrated airspeed (CAS) is obtained when the necessary corrections have been made to the IAS for installation error and instrument error. In fast, high‐altitude aircraft, the air entering the pitot tube is subjected to a ram effect, which causes the diaphragm to be deflected too far. The resulting airspeed indication is too high and must be corrected.
Figure 2.10 shows a compressibility correction chart. A rule of thumb is that, if flying above 10,000 ft and 200 knots, the compressibility correction should be made. Unlike the instrument and position error charts, which vary with different aircraft, this chart is good for any aircraft.

Figure 2.10 Compressibility correction chart.
Equivalent Airspeed
Equivalent airspeed (EAS) results when the CAS has been corrected for compressibility effects. One further correction must be made to obtain true airspeed. The airspeed indicator measures dynamic pressure and is calibrated for sea level standard day density. As altitude increases, the density ratio decreases and a correction must be made. The correction factor is  .
.
EAS is not a significant factor in airspeed computations when aircraft fly at relatively low speeds and altitudes (i.e., below 300 KCAS and at altitudes below 20,000 feet PA).
True Airspeed
True airspeed (TAS) is obtained when EAS has been corrected for density ratio:

Values of  can be found in the ICAO Standard Altitude Chart (Table 2.1); values of
  (called “SMOE”) can be found in Fig. 2.11.
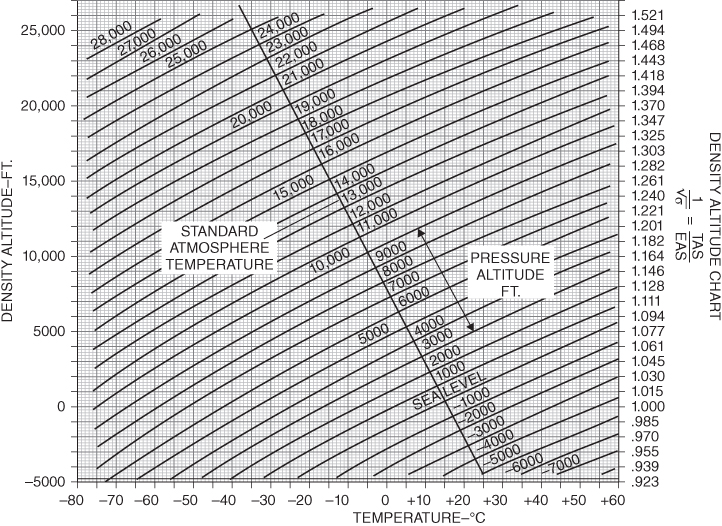
Figure 2.11 Altitude and EAS to TAS correction chart.
Understanding the relationship between the speeds above, and the calculation of each one, can be facilitated by remembering “ICE‐T.” IAS is read off the airspeed indicator, CAS is IAS corrected for installation/position errors, EAS is CAS corrected for compressibility, and finally TAS is EAS corrected for temperature and pressure.
Groundspeed
Groundspeed (GS) is the actual speed of the aircraft over the ground, either calculated manually or more commonly nowadays read off the GPS (Global Positioning Satellite) navigational unit. The GS increases with a tailwind and decreases with a headwind, and is TAS adjusted for the wind.
SYMBOLS
 |
Area (ft2) |
 |
Above ground level |
 |
Calibrated airspeed (knots) |
 |
Celsius temperature (deg.) |
 |
Density altitude |
 |
Equivalent airspeed |
 |
Fahrenheit temperature |
 |
Ground speed |
 |
Total pressure(head)(psf) |
 |
Indicated airspeed |
 |
Kelvin temperature |
 |
Mean sea level |
 |
Static pressure |
 |
Pressure altitude |
 |
Sea level standard pressure |
 |
Dynamic pressure |
 |
Universal gas constant |
 |
Rankine temperature |
 |
True airspeed |
 |
Absolute temperature |
 |
Sea level standard temperature |
 |
Velocity (fps) |
 |
Velocity (knots) |
 (delta) (delta) |
Pressure ratio |
 (theta) (theta) |
Temperature ratio |
 (rho) (rho) |
Density |
 (sigma) (sigma) |
Density ratio |
EQUATIONS
- (2.1)

- (2.2)

- (2.3)

- (2.4)

- (2.5)

- (2.6)

- (2.7)

- (2.8)

- (2.9)
- (2.10)
- (2.11)

- (2.12)

PROBLEMS
- An increase in static air pressure
- affects air density by decreasing the density.
- does not affect air density.
- affects air density by increasing the density.
- A decrease in temperature
- affects air density by decreasing the density.
- does not affect air density.
- affects air density by increasing the density.
- Pressure ratio is
- ambient pressure divided by sea level standard pressure measured in the same units.
- ambient pressure in millibars divided by 29.92.
- ambient pressure in pounds per square inch divided by 2116.
- sea level standard pressure in inches of mercury divided by 29.92.
- Density ratio,
 (sigma) is
- equal to pressure ratio divided by temperature ratio.
- measured in slugs per cubic foot.
- equal to the ambient density divided by sea level standard pressure.
- None of the above
- Bernoulli's equation for subsonic flow states that
- if the velocity of an airstream within a tube is increased, the static pressure of the air increases.
- if the area of a tube decreases, the static pressure of the air increases.
- if the velocity of an airstream within a tube increases, the static pressure of the air decreases, but the sum of the static pressure and the velocity remains constant.
- None of the above
- Dynamic pressure of an airstream is
- directly proportional to the square of the velocity.
- directly proportional to the air density.
- Neither (a) nor (b)
- Both (a) and (b)
- In this book, we use the formula for dynamic pressure,
 , rather than the more conventional formula,
  , because
 in our formula is measured in knots.
- density ratio is easier to handle (mathematically) than the actual density (slugs per cubic foot).
- Both (a) and (b)
- Neither (a) nor (b)
- The corrections that must be made to indicated airspeed (IAS) to obtain calibrated airspeed (CAS) are
- position error and compressibility error.
- instrument error and position error.
- instrument error and density error.
- position error and density error.
- The correction that must be made to CAS to obtain equivalent airspeed (EAS) is called compressibility error, which
- is always a negative value.
- can be ignored at high altitude.
- can be ignored at high airspeed.
- can be either a positive or a negative value.
- The correction from EAS to true airspeed (TAS) is dependent on
- temperature ratio alone.
- density ratio alone.
- pressure ratio alone.
- None of the above
- An airplane is operating from an airfield that has a barometric pressure of 27.82 in. Hg and a runway temperature of 100°F. Calculate (or find in Table 2.1) the following:
- Pressure ratio
- Pressure altitude
- Temperature ratio
- Density ratio
- Density altitude
- Fill in the values below for the stations in the drawing.
At station 1 At station 2 At station 3 


 = ?
= ? = ?
= ? = 2030 psf
 = ?
= ? = ?
= ?
 = ?
= ? = ?
= ? = ?
= ? - Using Table 2.1, calculate the dynamic pressure,
 at 5000 ft density altitude and 200 knots TAS.
 - The airspeed indicator of an airplane reads 355 knots. There are no instrument or position errors. If the airplane is flying at a pressure altitude of 25,000 ft, find the equivalent airspeed (EAS).
- Find the true airspeed (TAS) of the airplane in Problem 14 if the outside air temperature is −40°C.