CHAPTER 7
Brain Imaging in Psychopharmacology
Ebrahim Haroon, M.D.
Helen Mayberg, M.D.
The organization and content of this chapter represent a marked change from our chapter in the previous edition of this textbook. The approach has been modified to describe how brain-imaging techniques singly or in combination are currently being used to inform contemporary research in psychopharmacology and to guide treatment selection. Although a thorough, in-depth discussion of these topics is beyond the scope of this chapter, key references will be provided to guide further reading. In addition to introducing newer research, we have retained many of the older “classic” references that continue to inform our knowledge of neuroimaging to enable readers to easily locate and access these foundational papers.
Neuroimaging Techniques
Neuroimaging is a generic term encompassing a number of techniques and methods aimed at detecting meaningful information through the acquisition of brain images of different kinds. A first classification of these techniques may be technology based, as follows:
Magnetic resonance imaging (MRI): Based on magnetic resonance (MR) scanning equipment
Positron emission tomography (PET) and single photon emission computed tomography (SPECT): Based on tissue labeling by radioisotopes to measure brain activity
Electroencephalography (EEG) and magnetoencephalography (MEG): Enable study of brain activity and connectivity using intrinsic electrical and magnetic properties of neural circuitry
An alternative classification might be based on the types of measurement provided, as follows:
Vascular (hemodynamic) effects engendered by neural activity: PET (H215O), functional MRI (fMRI; blood oxygenation level–dependent [BOLD] contrast, perfusion imaging), SPECT
Metabolic demand: PET (18fluorodeoxyglucose [18FDG])
Receptor density: PET/SPECT (radioligands)
Neurochemistry: magnetic resonance spectroscopy (MRS)
Neural connectivity: MRI (diffusion tensor imaging), fMRI-based functional connectivity analysis
Surface electrical/electromagnetic effects of brain activity: EEG/MEG
Structural morphometry of brain structures: MRI
Positron Emission Tomography and Single Photon Emission Computed Tomography
PET and SPECT are somewhat similar techniques in that they both use injection of radioactive tracers (radiopharmaceuticals) to assess bodily functions and to diagnose and treat disease (National Institute of Biomedical Imaging and Bioengineering 2013). The path of these radioactive tracers, which emit radioactive radiation, is picked up by specialized cameras equipped with receiving counters placed on a computed tomographic scanner. SPECT techniques rely on the emission of gamma rays, whereas PET relies on the emission of positrons. Each of these techniques has specific advantages and disadvantages that render it particularly useful for certain purposes. The unique properties of gamma ray emissions and the relative inexpensiveness of the technology have made SPECT the de facto standard for obtaining key medical imaging technology data, including myocardial perfusion imaging and scans to study bone rarefaction. Although important experiments have been conducted with SPECT, its relative lack of spatial resolution has rendered SPECT techniques less useful in studying brain functions. For this reason, most of this introduction will be devoted to PET imaging.
PET was developed from in vivo autoradiographic techniques, wherein an animal is typically injected with a biologically interesting compound synthesized with a radioisotope (e.g., 3H). When the animal is sacrificed, the local tissue radioactivity is easily quantified. PET requires three basic technologies: the capability to produce positron-emitting compounds, the ability to detect simultaneously emitted gamma rays, and the computational power to reconstruct the sources of emission (Haroon et al. 2009). Positrons, or positively charged electrons (antimatter), have a particular advantage over other radioactive compounds. When a positron encounters an electron, the two annihilate each other, and their collective energy is transformed into two high-energy photons that are emitted in exactly opposite directions. Because the photons travel 180° apart, it is easy to arrange a ring of detectors to determine where the annihilation occurred. When two detectors are activated simultaneously, one knows that the emission occurred somewhere along the line connecting the two detectors. By collecting the counts over a period of time, say 60 seconds, and over a full sphere surrounding the subject’s head, it becomes possible to reconstruct the geometry of the source.
Positrons are synthesized indirectly, through the radioactive decay of particular isotopes. The most commonly used isotopes (carbon-11 [11C], oxygen-15 [15O], fluorine-18 [18F], nitrogen-13 [13N]) are produced in a cyclotron by the bombardment of targets with high-energy protons. This process results in a radioactive version of a biological ion (e.g., 15O2) that can then be used in any chemical reaction (e.g., oxidation-reduction reaction with product H215O). After appropriate purification procedures, these compounds can be injected intravenously into a human subject. Following injection, the isotope reaches the brain in approximately 20 seconds, where it undergoes radioactive decay due to positron emission, with decay latencies dependent on the half-life of the particular isotope (e.g., 2 minutes for 15O).
Because the photons emitted during positron decay are fairly high in energy (511-keV gamma rays), they tend to pass through matter with relative ease. A specialized detector, called a scintillation detector, is required to accurately count the decays in a directional fashion. PET scanners consist of rings of scintillation detectors arranged in parallel planes. An individual detector would be constructed from a scintillating crystal, either bismuth germanate (BGO) or lutetium oxyorthosilicate (LSO), and amplification electronics. When the ionized radiation (consisting of photons or gamma rays) enters the crystal, it loses its energy (through either the photoelectric or the Compton effect), resulting in the production of electrons. These electrons further interact with the crystal, resulting in the production of visible-wavelength photons. These photons are then detected and amplified by a photomultiplier tube and converted into an electrical pulse. A “coincidence circuit” allows for identification of the detector that picks up the 180° emitted gamma ray.
Depending on the injected molecule, a particular regional distribution will occur. In the case of H215O, it will follow the regional cerebral blood flow (rCBF). Other compounds will cross the blood–brain barrier and bind to specific receptors, in which case the distribution of radioactivity will reflect receptor concentration. 18FDG, a commonly used tracer, is metabolized by hexokinase during glycolysis, like glucose. Unlike glucose-6 phosphate, 18FDG is not metabolized further but instead accumulates intracellularly, yielding a measurement of local metabolic activity (Kennedy et al. 1976; Reivich et al. 1979).
Metabolic PET Studies
Metabolic studies use 18FDG to measure regional glucose metabolism. 18FDG, like all 18F compounds, has the advantage of a relatively long half-life (110 minutes), which allows it to be synthesized in one location and administered to a subject doing a particular task in another location remote from the PET scanner while remaining trapped in brain regions according to the local metabolic rate during scanning. The main disadvantage of 18FDG PET is that the compound’s long half-life results in effectively no temporal resolution. Instead, it offers a snapshot of a particular brain state, time-averaged over 20–60 minutes. Figure 7–1 shows functional localization of an epileptic focus in the right temporal lobe during presurgical workup.

FIGURE 7–1. Functional localization of an epileptic focus in the right temporal lobe during presurgical workup using magnetic resonance imaging (MRI) and fluorodeoxyglucose positron emission tomography (FDG-PET).
See Plate 15 to view this figure in color.
Source. Image courtesy of Carolyn C. Meltzer, M.D.
Most FDG uptake studies are based on the assumption that glucose uptake and neural activity at the synaptic level might be coupled. A caveat must be borne in mind when evaluating studies using FDG-PET. Glutamate, the main excitatory neurotransmitter in the brain, is removed from the synapse through a process of uptake by astroglial tissues, thereby terminating neural activation (Magistretti and Pellerin 1999a, 1999b). However, studies have shown that uptake of glutamate by astroglia can by itself stimulate glucose (and FDG) uptake (Magistretti 2006; Magistretti and Pellerin 1999a). In fact, deactivation might actually be coupled with increased glucose uptake in a variety of conditions (Magistretti 2006). Thus, the same problems that accompany studies of fMRI—i.e., whether the signal is actively excitatory versus actively inhibitory—are present in FDG-PET studies as well. Notwithstanding these limitations, PET studies have provided important information that helps to identify which patient will respond best to which treatment.
Blood-Flow PET Studies
PET studies use H215O to measure changes in local brain blood flow (Herscovitch et al. 1983; Mintun et al. 1984). As noted earlier, blood flow is an indirect measure of local synaptic activity. Because 15O has a short half-life (2 minutes), several administrations can be performed during a single session. A typical H215O study would have 8–16 injections and scans for each subject. The experimental design would manipulate the task that the subject performs during each scan. Each scan lasts about 1 minute, with 8–10 minutes between scans (5 half-lives). H215O studies not only allow for multiple conditions to be studied but also allow for repetition of conditions, increasing the statistical power of the studies. The main disadvantage is that because of the short half-life, the H215O must be produced reliably and in close proximity to the scanner. PET H215O studies are increasingly being replaced by perfusion MRI studies—mostly because of the latter’s greater ease of use, decreased radiation safety concerns, and better spatial resolution.
Metabolic and Blood-Flow PET Studies in Neuropsychiatry
PET has been used to assess functional activity of brain regions, both in the resting state and in response to various stimuli. Figure 7–2A shows a picture of increased cerebral blood flow (CBF) to paralimbic regions during a sad-mood induction task (to be described later) using H2O-PET. In contrast, Figure 7–2B shows metabolic activity differences among depressed versus healthy patients using FDG-PET. These modalities have been effectively used to study a variety of mental phenomena and have been of considerable benefit in enhancing our understanding of psychiatric disorders. Of particular interest have been studies using PET to investigate the biological basis of schizophrenia (Fujimoto et al. 2007; Lange et al. 2005), bipolar disorder (Post et al. 2003), depression (Mayberg 2003b; Neumeister et al. 2004), substance abuse and craving (Kilts et al. 2004), posttraumatic stress disorder (PTSD) (Bremner 2007), attention-deficit/hyperactivity disorder (ADHD) (Schweitzer et al. 2004), and Alzheimer’s disease (Small 1996). Most PET studies of psychiatric disorders have shown generally similar patterns of resting blood flow and metabolic abnormalities. That said, such identified patterns have not yet proved adequately consistent to warrant use of PET as a diagnostic procedure in individual patients. Notably, only resting-state FDG-PET scanning has undergone sufficient repeated sensitivity and specificity testing to be considered useful and reliable for the diagnosis of Alzheimer’s disease in patients with progressive neurocognitive disturbance and presumed dementia (Silverman et al. 2002). Nonetheless, research studies using these methods have provided many new insights into the pathophysiology of the disease and the mechanisms mediating treatment response (Erritzoe et al. 2003; Evans et al. 2006; Mayberg 2003a; Roffman et al. 2005). In a similar manner, functional imaging techniques have been combined with neurosurgical treatments such as deep brain stimulation (DBS) to study brain-imaging biomarkers of treatment response (Carbon and Eidelberg 2002).
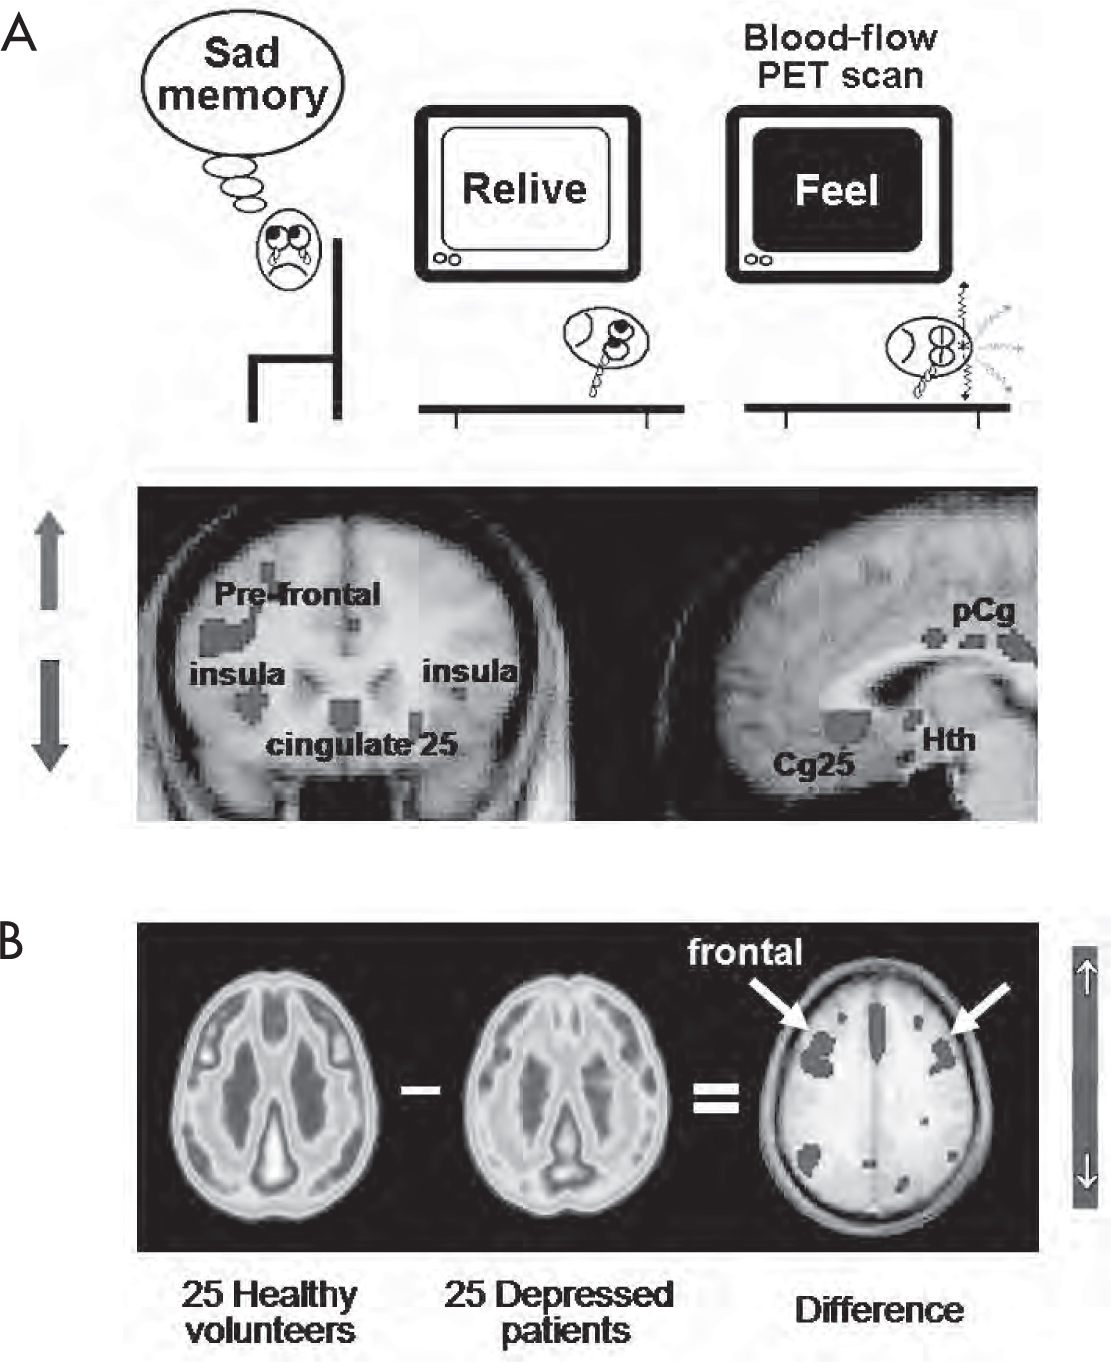
FIGURE 7–2. PET studies of regional functional activity in the brain.
See Plate 16 to view this figure in color.
(A) Task-induced increased cerebral blood flow using H2O-PET. (B) FDG-PET resting-state contrasts among depressed patients versus healthy control subjects. FDG=fluorodeoxyglucose; PET=positron emission tomography; Cg25=subgenual cingulate; pCg=posterior cingulate; Hth=hypothalamus.
Source. (A) Adapted from Mayberg HS, Liotti M, Brannan SK, et al.: “Reciprocal Limbic-Cortical Function and Negative Mood: Converging PET Findings in Depression and Normal Sadness.” American Journal of Psychiatry 156:675–682, 1999. Copyright 1999, American Psychiatric Association. Used with permission. (B) Image courtesy of Helen Mayberg, M.D.
Receptor-Labeling PET Studies
PET-based receptor imaging has provided a window for viewing the complex functioning of brain systems that mediate treatment response to psychopharmacological agents (Gunn et al. 2015). A snapshot of available radionuclide-binding modalities is provided in Table 7–1. With use of PET-based radioligands, it has been possible to visualize density, distribution, and occupancy of neural receptors and transporters before, during, and after drug therapy (Gunn et al. 2015; Talbot and Laruelle 2002). Receptor studies use radioligands—chemicals incorporating a positron-emitting isotope into a molecule whose pharmacokinetics are already known (Gunn et al. 2015). Ideally, these ligands bind specifically to one receptor type. Most of these studies are of the mapping type, which shows the distribution of a particular receptor in the brain (e.g., dopamine type 2 [D2] receptor). Here, the measured radioactivity reflects both the local concentration of receptors (Bmax) and the affinity of the ligand for the receptor (measured by KD, the equilibrium dissociation constant). If the ligand acts as a competitive antagonist, then the apparent affinity is also affected by the concentration of the endogenous neurotransmitter. The analysis can be simplified by considering the ratio of Bmax to KD, termed the binding potential. Ligands undergo both specific and nonspecific binding. Typically, one is interested only in the specific binding (i.e., to the receptor of interest). Use of a reference tissue that is known to have a low receptor concentration allows one to subtract out the nonspecific binding (e.g., the cerebellum has a low concentration of D2 receptors). In this case, the difference in distribution for the two tissues is directly proportional to the binding potential. Ligands require a more involved synthesis than either water or 18FDG, and their use is a race against the clock as the isotope decays. The end product must meet several requirements: high specific activity (amount of radioactivity per mole), high radiochemical purity, and sterility. 18F ligands are easier to synthesize because of their long half-life, but 11C ligands (20-minute half-life) have a higher potential for biological relevance. Appropriate availability of neurotransmitters and neuromodulators is essential to normal neurological and psychological function. Dysfunction or degeneration of neurons that synthesize these substances can lead to various disorders. In the following sections, specific examples will be provided to illustrate the use of imaging methods to answer pertinent questions of relevance to psychopharmacology.
Imaging modality |
Labeling agent |
Binding site |
Clinical focus and type of pharmacological probe |
Dopamine |
|||
PET |
[18F] DOPA, [18F] FMT |
Aromatic L-amino acid decarboxylase |
Viability of dopamine-synthesizing neurons Probe type: enzyme labeling ligand |
PET |
[11C] altropane, [11C] CFT, [11C] PE21, [18F] CFT |
Dopamine (D) uptake receptor |
Synaptic dopamine availability and correlation with cognition Probe type: reuptake transporter ligand |
PET |
[11C] raclopride, [11C] FLB 457, [11C] NPA, [18F] fallipiride |
D2 receptor |
Binding and affinity and occupancy of D2 receptors by antipsychotics Probe type: postsynaptic (PS) receptor ligand |
PET |
[11C] NNC-112, [11C] SCH 23390 |
D1 receptor |
Role of dopamine in cognition Probe type: PS receptor ligand |
SPECT |
[123I] iodobenzamide, β-CIT |
D2 receptor |
Hyperresponse of dopamine secretion in schizophrenia Probe type: PS receptor ligand |
Serotonin |
|||
PET |
[11C] methyl-L-tryptophan |
5-HT synthesis |
A marker of 5-HT biosynthesis Probe type: precursor ligand |
PET |
[11C] MDL100907, [11C] CIMBI-36, [18F] altanserin |
5-HT2A receptor |
Serotonin turnover among suicidal and depressed patients Probe type: PS receptor ligand |
PET |
[11C-carbonyl] WAY 100635, [11C] CUMI 101, [18F] FCWAY, [18F] MPPF |
5-HT1A receptor |
Antidepressant efficacy studies Probe type: autoreceptor ligand |
PET |
[11C] P943, [11C] AZ10419369 |
5-HT1B receptor |
Antidepressant efficacy studies Probe type: PS receptor ligand |
PET |
[11C] McN-5652, [11C] DASB, [11C] AFM, [11C] HOMADAM |
SERT |
Antidepressant binding efficacy Probe type: reuptake site ligand |
SPECT |
[123I] β-CIT, [123I] ADAM |
SERT; type: same as above |
Antidepressant binding efficacy Probe type: reuptake site ligand |
SPECT |
[123I] 5-I-R91150 |
5-HT2A receptor |
Serotonin turnover Probe type: PS receptor ligand |
Amino acid transmitters: GABA/glutamate |
|||
Glutamate |
[11C] ABP688, [18F] FPEB |
Metabotropic glutamate receptor |
Glutamate turnover Probe type: Glutamate regulation presynaptic and astrocytic |
PET |
[11C] flumazenil |
Benzodiazepine receptor |
GABA levels in anxiety states Probe type: PS receptor ligand |
SPECT |
[123I] iomazenil |
Benzodiazepine receptor |
GABA levels in anxiety states Probe type: PS receptor ligand |
MRS |
None |
None |
Concentrations of GABA, glutamate Probe type: metabolomic approach |
Neurodegeneration imaging |
|||
PET |
[11C] PIB, [11C] AZD2184, [11C] AZD4694, [11C] SB13, [18F] AV45, [18F] BAY94-9172, [18F] GE067 |
Beta-amyloid plaque |
Progression of senile plaques in Alzheimer’s disease Probe type: ligand of pathological deposit in senile plaques (beta amyloid) |
PET |
[11C] PBB3, [18F] AV-1451, [18F] FDDNP, [18F] THK5117, [18F] THK 5351 |
Tau deposition |
Progression of senile plaques in Alzheimer’s disease Probe type: ligand of pathological deposit in neurofibrillary tangles (tau) |
Other targets |
|||
PET |
[11C] carfentanil, [11C] diprenorphine, [11C] LY2795050 |
Opioid receptors |
Pain perception and placebo response Probe type: opioid receptors |
PET |
[11C] PK11195, [11C] PBR28, [18F] FEPPA, [18F] PBR06, [18F] PBR111 |
Microglial labeling: TSPO binding site |
Pain perception and placebo response Probe type: opioid receptors |
PET |
[11C] OMAR, [18F] MK9470 |
Cannabinoid receptors |
Pain perception and placebo response Probe type: cannabinoid type 1 receptors |
Note. 5-HT=serotonin (5-hydroxytryptamine); GABA=γ-aminobutyric acid; MRS=magnetic resonance spectroscopy; PET=positron emission tomography; SERT=serotonin transporter; SPECT=single photon emission computed tomography; TSPO=translocator protein. |
|||
Dopamine PET Imaging
Parkinson’s disease is caused by selective degeneration of the dopamine-synthesizing neurons of the nigrostriatal system. Uptake of 3,4-dihydroxy-6-18F-fluoro-L-phenylalanine ([18F] DOPA), which selectively labels aromatic L-amino acid decarboxylase (AADC), a critical enzyme in the synthesis of dopamine, has been used to estimate both the number of surviving cells and AADC activity among nigral neurons, thus providing a tool to understand the connection between dopamine dysfunction and clinical symptom evolution (Cropley et al. 2006; Ravina et al. 2005). PET imaging has been used to identify binding sites of neurotransmitters of relevance to psychiatric disorders, in order to characterize patients and inform treatment decisions based on mechanisms of drug action. For instance, studies with ligands that bind to D2 receptors have informed us that lower binding affinity, faster dissociation, and optimal occupancy at usually prescribed doses of D2 receptor antagonists might form the basis of atypical antipsychotic drug action (Kapur and Remington 2001). Dopamine transporter (DAT)–labeling PET ligands have also been used to study cognitive and motor dysfunction in Parkinson’s disease (Cropley et al. 2006; Ravina et al. 2005) and are currently being used to investigate psychiatric disorders such as ADHD.
Serotonin PET Imaging
PET scanning with [11C] methyl-L-tryptophan, which is a marker of serotonin (5-hydroxytryptamine [5-HT]) synthesis, is being used to identify overactive serotonin-synthesizing systems to differentiate epileptogenic from nonepileptogenic lesions in tuberous sclerosis prior to neurosurgery (Luat et al. 2007). Synaptic turnover of serotonin secretion is regulated by two processes—reuptake mediated through SERT and negative feedback mediated through serotonin type 1A (5-HT1A) autoreceptors. PET tracers can be used to study both of these processes. Antidepressant drugs that bind to and inhibit the serotonin transporter (SERT) have been shown to be associated with symptomatic recovery from depression (Nemeroff and Owens 2009). Radioligands that specifically bind to SERT, such as [11C] 3-amino-4-(2-dimethylaminomethyl-phenylsulfanyl)-benzonitrile (11C-DASB), have been used to estimate and associate SERT-occupancy rates of selective serotonin reuptake inhibitors (SSRIs) with clinical efficacy (Meyer 2007). Along similar lines, the role of SERT in suicidal behavior has been investigated in studies using SERT-binding PET ligands (Purselle and Nemeroff 2003). Downregulation of 5-HT1A receptors has been putatively linked to antidepressant efficacy and to the delay in onset of symptom response after initiation of SSRI treatment (Blier and Ward 2003). Radioligands such as [11C] WAY-100865 have been used to profile changes occurring in 5-HT1 receptors before, during, and after antidepressant treatment (Fisher et al. 2006). Finally, studies using agents such as 18F-altanserin have demonstrated that increased binding of downstream postsynaptic serotonin type 2A (5-HT2A) receptors in frontal cortex (Brodmann area [BA] 9) was associated with increases in pessimism and self-injurious and suicidal behavior, thereby adding to our understanding of suicidal behavior and depression (Kumar and Mann 2014; Meyer et al. 2008). These methods are likely to lead to reformulation of treatment practices used in the management of depressive disorders and at the same time explain how imbalances in the serotonergic system might disrupt mood-regulating neural circuitry, resulting in depressive disorders (Fisher et al. 2006).
Gamma-Aminobutyric Acid SPECT Imaging
Alterations in the function of γ-aminobutyric acid (GABA) systems in PTSD (Bremner 2007) and panic disorder (Bremner et al. 2000) have been reported on the basis of decreased binding of (123I)-iomazenil to benzodiazepine receptors in the BA9 region of patients with these disorders.
Amyloid PET Imaging
Neurodegenerative disorders such as Alzheimer’s disease have acquired critical relevance, given the larger proportion of aging population in modern society. Because the pathological changes associated with neurodegeneration (e.g., beta-amyloid deposits, neurofibrillary tangles, decreased metabolic activity) often precede clinical disease by several decades, early identification of these changes is of paramount importance. PET tracers for amyloid imaging can be roughly classified into 18F- and 11C-based tracers. 18F-based ligands include [18F] FDDNP (Small et al. 2006), and at least three commercially developed, U.S. Food and Drug Administration–approved amyloid-labeling PET tracers are available for clinical use: florbetapir ([18F] AV-45 [Amyvid], Eli Lilly), flutemetamol (Vizamyl, GE Healthcare), and florbetaben ([18F] BAY94-9172 [Neuraceq], Piramal Imaging). 11C-based tracers include [11C] PIB (Pittsburgh Compound–B) (Klunk et al. 2004) and [11C] SB (stilbene) derivatives (Ono et al. 2003). [11C] PIB in particular has garnered the lion’s share of research studies and continues to inform the development of other amyloid-labeling agents. For further information on this rapidly evolving field, readers are referred to the authoritative review of Vlassenko et al. (2012). More recent data pointing to tau accumulation as an earlier marker of neurodegeneration have led to increased interest in the development of new tracers to map tau rather than amyloid deposition (Dani et al. 2016). PET-based amyloid and tau-imaging tracers have the potential to help identify patients with mild cognitive impairment (MCI) who are at increased risk of converting to dementia (Mathis et al. 2005). However, it needs to be mentioned in passing that therapies based on combating amyloid deposition have not yielded much success in reversing the course of Alzheimer’s disease.
Microglial PET Imaging
Neuroinflammatory activation has been implicated as a pathogenic factor in patients with a wide range of psychiatric disorders (Haroon et al. 2012). The precise nature and meaning of these neuroinflammatory changes across various disorders have not yet been clearly delineated. At least some of these neuroinflammatory changes might be mediated through the activation of resident immune cells—namely, the microglial cells, which when activated express a characteristic 18-kDA translocator protein (TSPO). Several PET ligands that label the TSPO binding site have been synthesized and made available for research. The first TSPO ligand to become available was [11C]-PK11195 (Myers et al. 1991), which showed increased microglial activation in several neurological and psychiatric disorders. Initial enthusiasm for this ligand was tempered by the discovery of its high level of nonspecific binding to nonmicroglial tissue (including platelets, plasma proteins, and monocytes) and of the high quantities of TSPO in healthy blood–brain barrier regions, thus reducing the specificity of the signals. Two other compounds reported to have greater specificity in microglial TSPO labeling—including one 11C-based compound ([11C]-PBR28 [Brown et al. 2007]) and one 18F-based compound ([18F]-FEPPA [Rusjan et al. 2011])—have been proposed.
The field continues to struggle with many methodological issues. A recent study showed that [18F]-FEPPA binding was significantly elevated in prefrontal cortex, insula, and anterior cingulate cortex (ACC) brain regions in depressed subjects compared with healthy controls (Setiawan et al. 2015). This finding is important for improving treatment because it implies that therapeutics that reduce microglial activation should be promising for major depressive disorder. On the other hand, two studies of schizophrenic patients have been reported, with the first, using [18F]-FEPPA, reporting negative findings (Kenk et al. 2015) and the second (not yet published), using [11C]-PBR28, reporting positive findings clouded by the confounding effects of disease pathology and age (Turkheimer et al. 2015). A recent review (Turkheimer et al. 2015) summarized three main problems affecting quantification of PET TSPO ligands in the brain—namely, 1) genomic variation (a nucleotide polymorphism in the TSPO gene (rs6971) leads to population-level variation in binding affinity for TSPO tracers); 2) the very high affinity of some of the novel ligands disproportionately increases the TSPO signal at blood–brain barrier regions compared with the signal at the tissue; and 3) the difficulties in obtaining accurate estimates of plasma concentrations of the tracer to be used as a reference value. For a more detailed explanation of the challenges involved in obtaining meaningful data, readers are referred to the excellent review by Turkheimer et al. (2015).
Magnetic Resonance Imaging
The basis of MRI technology rests on the magnetic properties of the ions that constitute the underlying tissues. In most biological tissues, these magnetic properties are based on the hydrogen atom, which, as a component of water, is found ubiquitously in organic tissues (water constitutes roughly 80% of brain weight). The nucleus of a hydrogen atom, a single proton, has an intrinsic magnetic property known as moment, or spin, along its axis. The protons in tissue are normally oriented in random directions, but if a powerful external magnetic field is applied, the protons will tend to align in the north/south direction, the more powerful field. Spins can orient either in the direction of the applied field (parallel) or in the direction opposite to it (anti-parallel), but on average the parallel orientation tends to dominate. This situation results in a net magnetic moment induced by the external field in the tissue; in other words, the tissue becomes slightly magnetized. The intensity of the induced magnetization depends on the proton distribution (i.e., on the local molecular characteristics of the tissue). The strength of the magnetic field used in MR scanners is quantified in terms of tesla; currently available clinical scanners range in strength from 1.5 tesla to 3.0 tesla, and the range is even higher for research scanners (up to 7.0 tesla). The magnetic fields generated by these scanners are very strong, consequently leading to intense magnetization and heat generation in any metallic objects placed in or near the scanners. This often leads to safety procedures involving screening for any metallic objects such as metallic clips or implants.
MRI technique primarily involves perturbing the molecular protons aligned parallel to the magnetic field generated by the scanner magnet. This instrumental perturbation (stimulation) is performed by applying short radiofrequency (RF) pulses that, when appropriately tuned to a precise frequency, are able to transiently tip the orientation of the spins away from the applied magnetic field. However, the tendency of the spins is to return to their original orientation coherent with the applied magnetic field, given that the latter state is characterized by a lower energy (in a baseline resting state) known as “relaxation” state. Given that the relaxation of the protons results in a change from a high-energy to a low-energy state, the extra energy is generated as an RF wave, which can be detected by the same RF hardware device that emits the excitation pulses. In MR terminology, this device, referred to as the “transmit–receive” RF coil, has the form of a small cylindrical cage that surrounds the subject’s head in the scanner. The emitted RF wave—or, more precisely, the temporal signature of its decay as the excited spins relax—constitutes the actual MR signal and depends on the molecular characteristics of the local tissue, as well on the particular sequence of excitation pulses employed. The details of the physics that specify how the RF pulse sequences can be engineered to acquire images of the brain with different physiological meanings are beyond the scope of this discussion, and the interested reader is directed elsewhere (Buxton 2002).
The spin relaxation measured with MRI can be decomposed into longitudinal and transverse components, which are only partially related. Measurement of the relaxation time of the longitudinal component, called T1, provides images in which the contrast between different types of tissue (notably, gray matter, white matter, and cerebrospinal fluid) is maximized. Such T1-weighted images are capable of defining the anatomy of the living brain with great precision and are therefore used as an anatomical reference for most of the neuroimaging studies. An image of the entire brain with a resolution, or voxel size, of 1 mm3 (voxel stands for “volume pixel,” the unitary element used in MR imaging of the three-dimensional space into which the cortex is divided) can be acquired on a 1.5-tesla clinical scanner in less than 6 minutes.
Measurement of the relaxation time of the transverse component (T2), which can be divided into the T2 and the T2* characteristic times, provides images that are influenced by the local inhomogeneity of the magnetic field, which is induced by blood-perfusion patterns or lesions including infarcts or tumors. Hence, T2-weighted imaging is also used to identify lesions in the brain not picked up by the T1 scans. In particular, T2*-weighted images are characterized by a contrast that highlights changes in vascular dynamics that accompany neural activity and are thus employed in functional mapping studies. The advent of a very fast technique for the acquisition of T2*-weighted images, called echoplanar imaging (EPI), allows collection of an entire brain volume in 3–4 seconds and has been instrumental in the rapid development of fMRI. The ultrarapid acquisition of MR signals during EPI tends to diminish the T2* signal, which becomes negligible when averaged over several smaller voxels. This diminished signal limits the resolution of standard EPI images, which typically expand to a voxel size of 3–4 cu mm (which is larger than the 1 cu mm voxel size of conventional MRI images), thereby constraining the use of EPI in advanced MR imaging. Thus, EPI images will not be able to provide the submillimetric precision required to visualize columnar organization of the visual cortex (Menon and Goodyear 1999). Table 7–2 lists common applications of MR-based technologies in psychopharmacology research. These techniques will be described in greater detail in the following section.
Type of imaging |
Technique |
Method of analysis |
Purpose |
Structural MRI (sMRI)— T1 based |
Voxel-based morphometry (VBM) |
Automated |
Measure volumes of brain regions in brain disorders and ischemic lesions (hyperintensities) |
sMRI—T2 based |
Region of interest (ROI) analysis |
Manual/automated |
Measure volumes of brain regions in brain disorders and ischemic lesions (hyperintensities) |
Functional MRI (fMRI) |
BOLD technique (described in text) |
Computerized algorithm |
Measure area of activation in response to cognitive/affective challenge |
Functional connectivity analysis |
Resting-state activity, independent component analysis (ICA), structural equation modeling |
Computerized algorithms, statistical models |
Reveal connectivity between different components of neural network during various mental states |
Diffusion-based MRI |
Diffusion-weighted, perfusion-weighted, diffusion tensor imaging (DTI) |
Computerized algorithms |
Assess tissue integrity by imaging water diffusion in restricted and free space; used in diagnosis of stroke and neurodegeneration |
Perfusion-weighted imaging with arterial spin labeling |
Blood flow–based imaging using magnetic resonance labeling approaches |
Computerized algorithms |
Measure neural tissue response to activation or pharmacological challenge paradigms |
Magnetic resonance spectroscopy |
Detection of concentrations of specific metabolites in cerebral regions |
Automated and voxel based (manual) |
Detect neuronal and glial metabolic abnormalities in localized (single) or distributed (multiple) brain regions or voxels |
Innovative in vivo magnetic resonance approaches |
|||
Machine learning |
Identification of minor but consistent patterns of changes in structural and/or functional imaging data |
Advanced machine-learning algorithms |
Identify consistent patterns of brain changes across disease states; often used for subtyping |
Multimodality imaging |
Combination of data from multiple modalities to obtain meaningful conclusions |
EEG/MEG + fMRI + tractography |
Reveal structural and functional connection changes in mental disorders |
Connectomics |
Application of graph theory to connectivity analysis |
Computerized approaches |
Identify nodal and connectivity changes in brain architecture in different contexts |
Hyperscanning |
Online linkage of two fMRI scanners in different locations |
Web based |
Reveal cerebral activation changes during social interactions (social neuroscience technique) |
Note. BOLD=blood oxygenation level–dependent; EEG=electroencephalography; MEG=magnetoencephalography. |
|||
Functional Magnetic Resonance Imaging
fMRI refers to a variant of MRI that sensitively records local changes in regional blood flow resulting from neural activity. The increase in regional blood flow, as engendered by neural activation, results in oxygen consumption that exceeds the oxygen available in the tissues. The higher oxygen consumption causes an apparent decrease in deoxyhemoglobin in the activated brain region, leading to a change in the RF perturbation qualities of the local tissue. In the 1930s, Linus Pauling observed that the amount of oxygen carried by hemoglobin is inversely proportional to the degree to which it perturbs a magnetic field. This property of differential magnetization was finally demonstrated in vivo in the late 1980s, and fMRI was born (Ogawa et al. 1992; Thulborn et al. 1982). Many reviewers have considered the relative merits and demerits of fMRI versus PET imaging techniques. A brief summary of the various MR imaging techniques in current research on neuropsychiatric disorders is provided in Table 7–2.
The BOLD Signal in fMRI
Functional MRI exploits the fact that deoxyhemoglobin has paramagnetic properties and oxyhemoglobin does not. Deoxyhemoglobin disturbs the local magnetic environment, causing the surrounding protons to dephase even faster than they would otherwise (Figure 7–3).
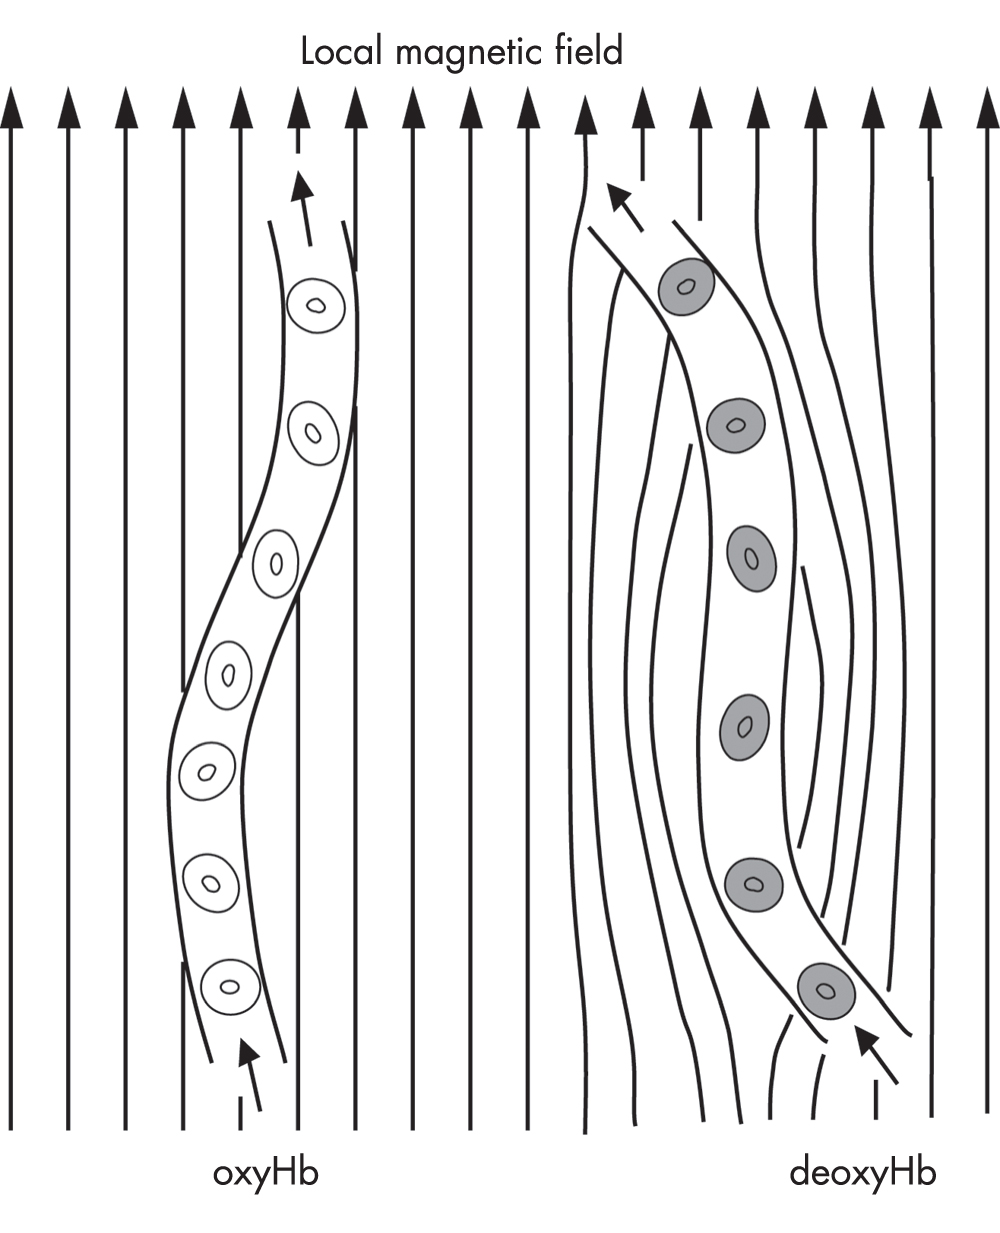
FIGURE 7–3. Schematic diagram of the effect of hemoglobin (Hb) on the local magnetic field of brain tissue.
Only deoxyhemoglobin (deoxyHb) has paramagnetic properties and locally distorts the field, leading to faster spin dephasing.
Source. Reprinted from Pagnoni G, Berns GS: “Brain Imaging in Psychopharmacology,” in The American Psychiatric Publishing Textbook of Psychopharmacology, 3rd Edition. Edited by Schatzberg AF, Nemeroff CB. Washington, DC, 2003, pp. 163–172. Copyright 2003, American Psychiatric Publishing, Inc. Used with permission.
Heightened neuronal activity leads to an increase in blood flow, accompanied by a decrease in the amount of deoxyhemoglobin relative to oxyhemoglobin. Because lower deoxyhemoglobin means reduced rapid-spin dephasing, this increase in blood flow appears as an increase in the MR signal—a phenomenon called the BOLD signal. In response to a regionally specific neuronal activation, the BOLD signal usually increases by about 1% on a standard 1.5-tesla clinical scanner. The intensity of the signal is proportional to the strength of the main magnetic field—for example, the intensity will double in the case of a 3-tesla scanner. The temporal resolution of fMRI is determined both by the hemodynamic response and by the physical constraints of the scanner magnetic fields. The hemodynamic response generally lags behind the neural activity by 3–5 seconds and may last for up to 10–15 seconds (Figure 7–4).
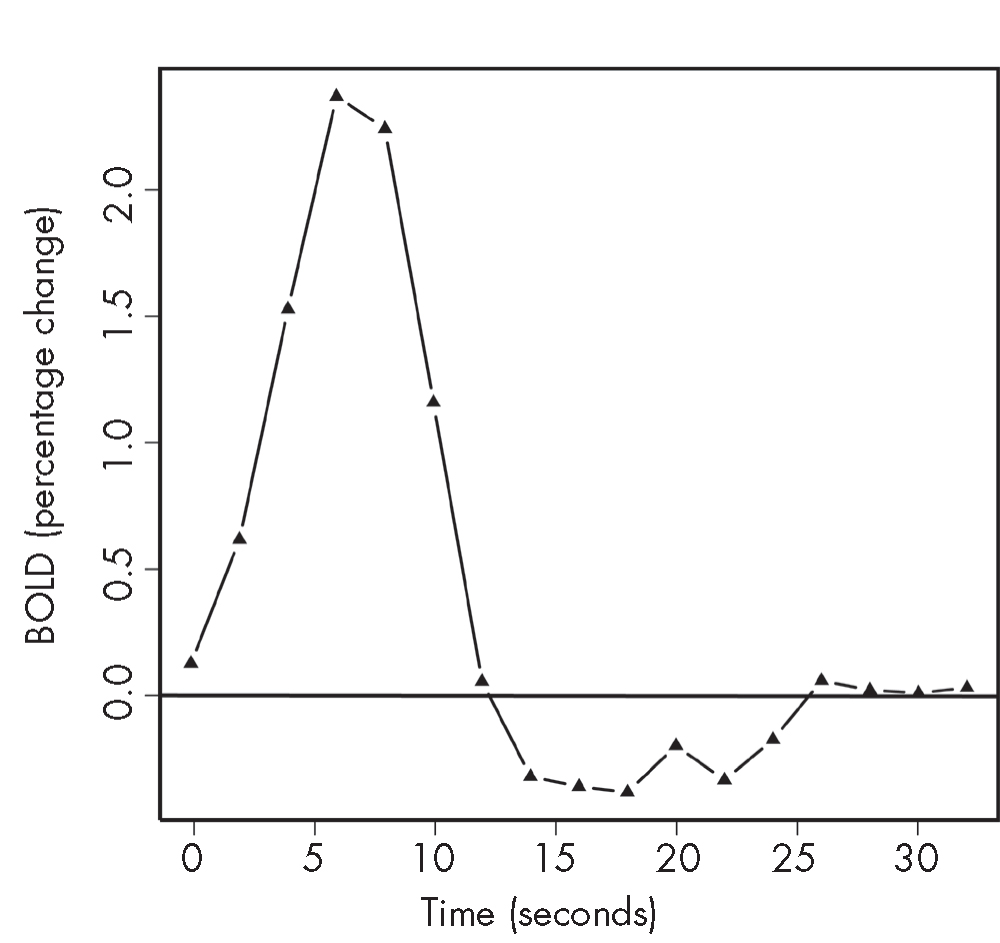
FIGURE 7–4. Relative blood oxygenation level–dependent (BOLD) response to 1-second visual stimulation.
These functional magnetic resonance imaging (fMRI) data are from the occipital cortex and were obtained in a healthy volunteer in a 3-tesla scanner. The amplitude of the signal is about 2%, with the peak 5–8 seconds after the stimulus.
Source. Reprinted from Pagnoni G, Berns GS: “Brain Imaging in Psychopharmacology,” in The American Psychiatric Publishing Textbook of Psychopharmacology, 3rd Edition. Edited by Schatzberg AF, Nemeroff CB. Washington, DC, 2003, pp. 163–172. Copyright 2003, American Psychiatric Publishing, Inc. Used with permission.
The rate at which the scanner can acquire images is influenced by the desired resolution. Generally, the more slices and the finer the resolution within each slice, the longer a whole-brain acquisition takes. Whereas an individual slice can be acquired in as little as 60 milliseconds, whole-brain imaging usually requires about 2–3 seconds. In contrast to the ease with which fMRI measurements can be performed, there are specific limitations with BOLD imaging:
Spatial errors. The BOLD effect originates from venous vessels (capillaries, venules, and veins), so the signal is not exactly collocated either with the locus of neural activity or with the arterial supply. This spatial error may, however, be negligible for brain-mapping studies employing a standard spatial resolution (voxel size ∼50 mm3).
Bulk head motion and physiological pulsation (heart pulse, respiration) artifacts. To reduce motion, head movement should be restrained while maintaining a comfortable situation for the subject.
Susceptibility artifacts. The fact that BOLD detects local changes in magnetic susceptibility (due to the variation in deoxyhemoglobin concentration) renders it vulnerable to the large discontinuity that exists at the interfaces between bone/air and bone/liquid. In these regions, the steep variations in tissue density cause a distortion of the local magnetic field, resulting in both a spatial distortion of the image and a drop in the BOLD signal. These spatial distortions make it difficult to detect the small changes associated with deoxyhemoglobin variations. The problematic regions are notably the orbitofrontal cortex and the inferior part of the temporal lobes, which unfortunately are the loci of many interesting neuropsychological processes.
Functional Imaging: PET-Based Versus fMRI-Based Methods
At this juncture, it might be helpful to draw a distinction between functional imaging paradigms using PET-based methods and those using fMRI-based methods. Table 7–3 provides a comparison of the advantages and disadvantages of the two imaging techniques.
Advantages of PET versus fMRI |
Quiet (good for acoustic stimulation); fMRI may have noise >90 dB |
Less sensitive to movement artifact |
Allows metabolic and receptor mapping |
Allows imaging of brain regions that are typically difficult to image with fMRI because of the presence of a susceptibility artifact (orbitofrontal cortex, inferior temporal lobe) that causes both distortion and loss of signal |
Allows the use of standard measurement devices (physiological, behavioral) inside the scanner (i.e., avoids the complication of the need for specially designed MRI-compatible hardware) (In the MRI environment, the presence of a very strong static magnetic field commands the use of diamagnetic components; moreover, every electric device in the scanner room needs to be carefully shielded to prevent interference problems to and from the scanner. Scanning is not used in patients who have pacemakers or ferromagnetic metal parts in their bodies.) |
Disadvantages of PET versus fMRI |
Injection of a radioactive isotope precludes the use of PET for longitudinal studies in which the same subjects are scanned repeatedly over an extended period of time. |
PET provides an integral measure (over time) of brain activity (for activation techniques), with a temporal resolution on the order of minutes because of the lifetime of the isotope. By comparison, fMRI has a temporal resolution on the order of seconds. This prevents the use of sophisticated, event-related designs with PET. Also, the number of images typically collected with PET on a single subject rarely exceeds a dozen, thereby limiting the statistical treatment in the analysis of the data. |
Spatial resolution is more limited with PET than with fMRI. |
Cyclotron must be located nearby. |
PET is more expensive than fMRI (utilization costs per hour: fMRI, ∼$500; PET, ∼$2,000). |
The acquisition procedure is time-consuming and requires more resources. (One scan typically lasts ∼3 hours [fMRI typically lasts <1 hour]. In comparison, the MRI experimental setup is easier to perform and can be operated by just one person.) |
Functional Imaging: Neural Activation Studies Versus Resting-State fMRI Studies
In the decade since publication of the previous edition of this textbook, the technique of functional imaging (PET or BOLD-MRI based) has undergone considerable evolution. Functional MRI studies may be divided into two key types: 1) neural activation studies, which profile increases and/or decreases in regional BOLD response to a specific stimulus, and in which activity changes that deviate from the norm can be assumed to reflect altered tissue functioning due to pathology); and 2) studies that examine interregional connectivity between brain regions during a nonactivated or “resting” state. These two approaches will be described in further detail in the following sections.
Neural activation paradigms in psychopharmacological research. At the time of writing this chapter, most of the applications of fMRI techniques are still experimental—for example, helping investigators to map areas of functional activation in response to cognitive and affective tasks. However, several of these techniques have begun to provide key clinical information about mechanisms of new treatments and to shed more light on the action of older treatments. Similarly, several novel and innovative uses of imaging methods have been described in the literature.
Mood and self-referential paradigms. A core feature of depression involves negative bias and anhedonia, suggesting specific alterations in neural pathways mediating salience, self-reference, and reward. Accordingly, several fMRI studies have reported failed activation of dorsomedial prefrontal cortex (BA10) in depressed patients in response to positive words or pictures (Lemogne et al. 2009; Mitterschiffthaler et al. 2003). Interestingly, activation of the dorsomedial prefrontal cortex is also seen in tasks requiring self-referential processing in healthy subjects (Craik et al. 1999; Fossati et al. 2003). A study using an emotional “Go/No-Go” task identified a depression-specific pattern consisting of blunted responses in reward circuits in response to neutral words but exaggerated responses in self-referential areas of the rostral cingulate and medial frontal cortex in response to sad words (Elliott et al. 2002). Such sensitive tasks can plausibly be used as outcome measures in the evaluation of the efficacy of antidepressant treatments.
Facial-expression-processing paradigms. Another task frequently used in neural activation studies across a range of disorders involves presentation of faces with different emotional expressions, such as angry, sad, fearful, happy, and neutral. Such faces are either overtly presented or hidden behind a mask, depending on the study hypothesis. With overt presentation, subjects typically perform a behavioral task related to classifying some aspect of the faces. Application of such tasks in fMRI studies has produced a large amount of data regarding the neural basis of emotional processing in healthy subjects, demonstrating robust activation of the amygdala in response to emotional faces (Whalen et al. 1998). Of note, patients with depression, anxiety disorders, or PTSD exhibit increased amygdala responses to the presentation of fearful or angry faces (Rauch et al. 2000; Shin et al. 2004; Whalen et al. 2002). Facial-expression-processing paradigms have also proved useful in evaluating treatment effects in response to antidepressant drugs (Sheline et al. 2001), as well as in studying temperamental or genetic contributions to emotional processing (Hariri et al. 2002; Stein et al. 2007). Similar strategies have identified antidepressant-induced changes with other tasks (Fu et al. 2007).
Cognitive “working memory” paradigms. The “n-back” task is a working memory task that captures prefrontal cortical function; it has been used in fMRI studies to identify altered neural functioning in a variety of disorders, including schizophrenia and depression (Abdallah et al. 2014; Meyer-Lindenberg and Weinberger 2006). The n-back test involves visual presentation of letter stimuli at previously chosen intervals and epochs (e.g., 2-second interval for 30-second epochs) (Owen et al. 2005). The baseline (control) condition is usually a 0-back condition in which subjects are required to press a button with the right index finger when the stimulus (e.g., the letter “x”) appears. In the experimental condition (1-, 2-, or 3-back), subjects are required to press a button if the presented stimulus is the same as a stimulus presented n trials previously (n=1, n=2, or n=3). The task difficulty and the condition are varied in a previously specified order throughout the scan time. Subject performance during scanning in regard to accuracy (number of target stimuli correctly identified) and response time is usually recorded. Increased prefrontal activity is seen in depressed patients relative to control subjects performing this task, an effect amplified by task difficulty (Harvey et al. 2005). On the other hand, several studies have reported that schizophrenic patients demonstrate deficits in activation of the prefrontal cortex during this task, thought to reflect alterations in dopamine functioning. Normalization of neural activation patterns by antipsychotic drugs is associated with response to treatment. The n-back task has also been useful in identifying genetic contributions to schizophrenia risk (Meyer-Lindenberg and Weinberger 2006). Bookheimer et al. (2000) used a verbal memory paradigm—in which patients memorized unrelated pairs of words during scanning—to study hippocampal activation in patients at risk of developing Alzheimer’s disease. Not only did the carriers of the apolipoprotein E epsilon 4 (ApoE-ε4)++ allele (associated with a higher risk of dementia) show greater hippocampal activation, but this baseline activation pattern predicted longitudinal cognitive decline.
Reward-processing paradigms. Reward processing is believed to represent a complex psychological function incorporating a wide range of goal-directed, hedonic behaviors, including motivation, salience, anticipation, experiencing pleasure, and satiety (Whitton et al. 2015). Most recent data appear to strongly support the presence of aberrant reward-processing activity across multiple psychiatric disorders (transdiagnostic and transnosological biomarker) ranging from major depressive disorder and substance use disorders to bipolar hypomanic episodes and schizophrenia (Whitton et al. 2015). Reward-processing paradigms are commonly used in studying substance use and craving, and also in studying anhedonia in both depression and schizophrenia (Whitton et al. 2015). In addiction studies, typically the patient, while lying in a scanner, is presented with multiple contexts associated with drug abuse, and activation of reward-processing circuitry is studied. Zink et al. (2006) used fMRI to study activation of the basal ganglia (a key component of reward circuitry) in healthy volunteers in response to salient stimuli with high motivational relevance. Figure 7–5 illustrates activation of salience and reward-processing brain regions during a monetary reward task, as visualized with fMRI. The concept of “temporal (or delay) discounting” refers to the extent to which an individual will choose a discounted immediate reward over a delayed reward that is much higher in value. Patients with DSM-IV (American Psychiatric Association 1994) impulse-control disorders, such as pathological gambling, have been found to show considerable variation in their tendency to use temporal discounting. Studies using fMRI reported that increased activation of paralimbic cortex was observed when subjects chose smaller/earlier rewards, whereas frontoparietal activation was seen when subjects chose larger/later rewards (Dixon et al. 2006; McClure et al. 2004). Studies of delay discounting might help us develop brain activation–based biomarkers of complex disorders such as DSM-5 (American Psychiatric Association 2013) substance-related and addictive disorders (including gambling disorder). In a recent study, a combination of [18F] DOPA PET and fMRI was used to demonstrate that decreases in dopamine synthesis resulting from inflammatory activation could lead to decreased activation of the ventral striatal regions in response to potentially rewarding stimuli, which in turn could be correlated with anhedonia (Capuron et al. 2012).
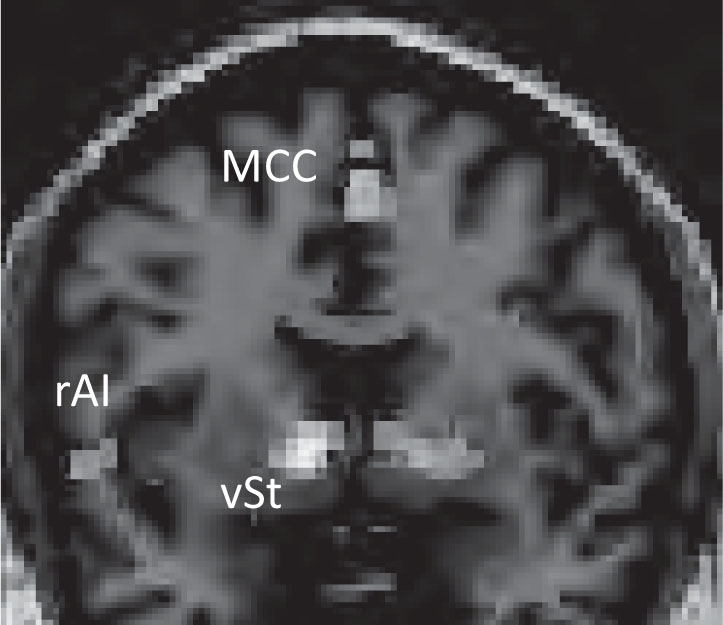
FIGURE 7–5. Activation of the ventral striatum (vSt), midcingulate cortex (MCC), and right anterior insula (rAI) during a monetary reward task, as visualized using functional magnetic resonance imaging.
See Plate 17 to view this figure in color.
Note. The activation pattern reflects changes in both salience and reward centers in the brain.
Source. Image courtesy of Helen Mayberg, M.D.
In conclusion, these examples illustrate the potential of fMRI activation studies in probing brain–behavior relationships in psychiatric disorders, owing to the flexibility of fMRI paradigm design as well as the large variety of standardized tasks and possibility of developing novel tasks.
Resting-state fMRI studies: neural networks and functional connectivity analysis. Resting-state neural cells manifest spontaneous activity that triggers a tiny but demonstrable BOLD effect, which (in contrast to other BOLD activations) shows pulsation at much lower frequencies (0.01–0.03 Hz). These low-frequency pulsatile BOLD fluctuations have been shown to be remarkably synchronous among connected structures operating within a neural network designed to execute a specific function (Biswal et al. 1997; Lowe et al. 2002).
Study of large-scale brain networks that mediate cognitive and affective functions might provide key insights into dysfunctional brain architecture (Menon 2011). Graph-theory approaches have been used to further refine data obtained using resting-state BOLD MRI data. Brain networks involve collections of brain regions (nodes) and connections (edges), both of which are defined using structural diffusion tensor imaging or resting functional connectivity analysis measured using BOLD fMRI (Bullmore and Sporns 2009). Damage to nodes or edges from disease processes can lead to aberrant signaling affecting whole networks or subnetworks, often leading to psychiatric syndromes and symptoms. Organizationally, the neural systems involved in regulation of affect and behavior are believed to involve three core intrinsically connected networks:
Central Executive Network (CEN): A frontoparietal network anchored in primary nodal regions involving dorsolateral prefrontal cortex (DLPFC) and posterior parietal regions responsible for actively maintaining and manipulating information in the working memory and making decisions in the context of goal-directed behavior (Seeley et al. 2007). A large number of studies have documented abnormalities of the CEN in most psychiatric disorders, but most importantly in schizophrenia (Forbes et al. 2009; Woodward et al. 2011) and depression (Miller et al. 2015).
Default Mode Network (DMN): In contrast to the CEN, the DMN preferentially shows greater activity during restful or passive cognitive states (Buckner and Vincent 2007; Gusnard et al. 2001) and is primarily anchored in the posterior cingulate and the inferior parietal and medial frontal cortices. High activity in these regions during periods of wakeful rest and passive self-reflection have led some to hypothesize that such activity may serve to “consolidate the past, stabilize brain ensembles, and prepare us for the future” (Buckner and Vincent 2007, p. 1066). Abnormalities in the functional connectivity of this network in psychiatric disorders such as schizophrenia (Bluhm et al. 2007), depression (Greicius et al. 2007), dementia (Rombouts et al. 2005), autism (Cherkassky et al. 2006), and multiple sclerosis (Lowe et al. 2002) have been reported.
Salience Network (SN): The SN is anchored primarily in the dorsal ACC and fronto-insular cortex and is believed to be involved in detecting and integrating relevant interoceptive, autonomic, and emotional information (Seeley et al. 2007). Dysfunction of this network has been consistently associated with anxiety, pain syndromes, and addiction (Klumpp et al. 2013; Menon 2011; Paulus and Stein 2006).
Magnetic Resonance Spectroscopy
MRS technology is based on the fact that MR acquisition involves receiving echoed RF waves of multiple cellular chemical constituents. The individual chemical and metabolite constituents could be measured by suppressing the resonance frequency of water molecules. A detailed exposition of the various types of MRS techniques is beyond the scope of this chapter, and the reader is referred to excellent reviews on the topic (Mason and Krystal 2006; C.M. Moore et al. 1999). Among the markers currently being researched are N-acetylaspartate (NAA), glutamate/glutamine, myo-inositol, choline, glutathione, creatine, GABA, phosphomonoester, and phosphodiester (Lyoo and Renshaw 2002). An example of an MRS spectrum from a healthy control subject is provided in Figure 7–6. Using proton MRS ([1H]-MRS), Frye et al. (2007) were able not only to demonstrate elevated glutamate/glutamine in anterior cingulate/medial prefrontal areas of patients with bipolar depression but also to document reduction of glutamine among patients who showed clinical response to treatment with lamotrigine. Glutamate elevation during MRS is believed to be one of the most consistent findings in bipolar disorder among children and adults (Gigante et al. 2012; Yüksel and Öngür 2010). Using another sample of adult patients, these same authors reported that ACC glutamine levels were elevated rapidly following administration of the anticonvulsant topiramate (C.M. Moore et al. 2006). A study using MRS technology reported that cortical GABA concentrations increased following a course of electroconvulsive therapy (ECT) and used this information to hypothesize that this increase in GABA might be associated with clinical recovery (Sanacora et al. 2003).
![FIGURE 7–6. Proton magnetic resonance spectroscopy ([1H]-MRS) spectrum from right dorsolateral prefrontal cortex voxel of a healthy individual.](../images/fig07-06a.jpg)
FIGURE 7–6. Proton magnetic resonance spectroscopy ([1H]-MRS) spectrum from right dorsolateral prefrontal cortex voxel of a healthy individual.
MM=macromolecules; NAA=N-acetylaspartate; Glx=glutamate/glutamine; Cr/PCr=creatine/phosphocreatine; Ch=choline; mI=myo-inositol.
Source. Reprinted from Haroon E, Watari K, Thomas MA, et al.: “Prefrontal Myo-Inositol Concentration and Visuospatial Functioning Among Diabetic Depressed Patients.” Psychiatry Research: Neuroimaging 171:10–19, 2009. Copyright 2009, Elsevier Ltd. Used with permission.
At present, MRS remains the only in vivo method of measuring glutamate among humans, albeit not without problems. Profiling brain response to inflammation is of great importance to better understand the biological basis of mental disorders. Brain and behavioral responses to inflammation might be mediated by the effect of cytokines and other inflammatory signaling molecules on the interactions between neurons and the astrocytic cells (i.e., neuron–glia coupling) (Haroon et al. 2012; Miller et al. 2013). MRS-based technologies can be used to profile inflammation-induced changes in neuron–glia coupling. Haroon et al. (2014, 2015) demonstrated that induction of high-grade inflammation (following administration of interferon-alpha for the treatment of hepatitis C in nondepressed individuals) was associated with significant increases in glutamate concentrations in the dorsal ACC and left basal ganglia. The increased glutamate concentrations were in turn associated with depression, anhedonia, and reduced psychomotor activity, and these effects were greater in older individuals. In comparison, patients with chronic major depressive disorder (MDD) associated with high inflammation demonstrated changes mostly in the basal ganglia regions characterized by increases in both glutamate and the astroglial marker myo-inositol (Haroon et al. 2016). Thus, MRS could be used to further study both the acute and the chronic impact of inflammation on mood-regulating and reward pathways.
Structural Magnetic Resonance Imaging
As illustrated in Table 7–2, MR technology has provided important information on structural abnormalities in various psychiatric disorders. Use of MR imaging–based methods in research on psychiatric disorders and their treatment is addressed in the chapters on individual disorders (see Chapters 46–54 in this volume). Only a general introduction will be provided here. MR–based volumetric methods involve estimating volumes of cerebral structures using MR images. They may be divided into two types: automated (voxel-based morphometry [VBM]) and manual (region of interest [ROI]) methods. A detailed review of these methods is provided elsewhere (Pearlson and Calhoun 2007). Using volumetric studies of hippocampus in depression, Sheline et al. (2001) described a subtype of depression associated with hippocampal volume loss, memory impairment, and hippocampal loss of 5-HT2A receptors. The alteration of cerebral structure by medications has been reported as well. Using structural MRI methods, G.J. Moore et al. (2000) reported that lithium administration led to a 3% increase in the volume of gray matter within a period of about 4 weeks. Psychiatric disorders are clinically heterogeneous entities, and such structural MRI–based studies have helped us to characterize more specific pathological subtypes of depression. T2-weighted MRI studies have also been used to identify and rate subcortical hyperintensities, the increase of which is believed to result in late-life cerebrovascular disease and late-life depression (Alexopoulos et al. 1997; Kumar et al. 2002; Parsey and Krishnan 1997).
Diffusion-Weighted and Diffusion Tensor Imaging
Diffusion-based imaging techniques, including diffusion-weighted imaging (DWI) and diffusion tensor imaging (DTI), obtain and use images of the microscopic diffusion properties of water as an indirect measure to estimate the microstructure integrity of all brain tissues, including white matter tracts (Le Bihan 2003). In free-form water, molecules have isotropic properties (i.e., they diffuse in multiple and often infinite directions). The extent of free diffusivity in all directions is known as radial diffusivity. Under restricted conditions in the white matter fiber tracts, the directional diffusion of water is highly restricted to a few vectors due to spatial limitations induced by the tightly packed nerve fibers, resulting in a phenomenon known as anisotropic diffusion, and the extent of this restricted or anisotropic diffusion is known as fractional anisotropy (Kubicki et al. 2007). DTI-based studies have advanced the hypothesis that psychiatric disorders are characterized by altered connectivity (“disconnection syndromes”). Studies employing DTI methods have helped us understand how cerebral organization and connectivity might be altered in psychiatric disorders such as autism (Alexander et al. 2007), late-life depression (W.D. Taylor et al. 2007), and schizophrenia (Nestor et al. 2007). It should be borne in mind that the direction-dependent diffusion of water in white matter tracts corresponds to the predominant directional orientation of the fiber bundles (principal diffusion direction), and by using complex statistical modeling, it is possible to estimate these directions and to trace the fibers’ journey through the brain structure using a technique called probabilistic tractography (Johansen-Berg et al. 2008). Using this technique, it has also been possible to predict antidepressant treatment responses among patients with late-life depression (Mettenburg et al. 2012).
Perfusion-Weighted MR Imaging and Arterial Spin Labeling
Traditionally, the assessment of activity in a tissue volume of interest was made using PET techniques involving exposure to radioactive tracers. Perfusion MRI techniques—which take advantage of the fact that the magnetization properties of arterial blood water are different from those of the underlying tissues—have been used to study increased resting blood flow (indexed by increased flow of arterial blood water). A subtype of perfusion MRI that uses magnetic labeling of increasing flow of arterial water proximal to the tissue volume of interest is known as arterial spin labeling (ASL) and has been used to study brain activity in disease states (Detre et al. 2009, 2012). Multiple studies have examined the effect of serotonin metabolism changes in depression. For example, it has been demonstrated that depressed patients who have the short allelic variant of the serotonin transporter (s/s group) show significantly increased resting CBF in the amygdala and decreased CBF in the ventromedial prefrontal cortex compared with patients who have the long allelic variant of the serotonin transporter (l/l group) (Rao et al. 2007). MDD patients subjected to acute tryptophan depletion showed increased resting-state habenular blood flow, and the increased resting-state amygdala blood flow (following acute tryptophan depletion) was associated with a more negative emotional bias score across both MDD and control patients (Roiser et al. 2009).
Machine Learning
A major critique of modern neuroimaging studies is that they although they demonstrate statistically significant differences between study and control groups, they are of limited clinical utility owing to low levels of sensitivity and specificity (Orrù et al. 2012). This is because conventional statistical analysis techniques aim to identify statistically significant group differences that depend on sample size and power. Machine learning enables the investigator to make sense of otherwise unstructured data by minimizing “noise” and differentiating noise from core data elements that explain most of the variance. For example, machine learning can be used to process imaging information from all brain voxels simultaneously (i.e., whole-brain model) to identify differences between the study and control groups. Thus, machine learning techniques enable us to identify minor but consistent alterations in widely distributed brain networks that can later be combined to profile brain–behavior relationships in neuropsychiatric disorders (Borgwardt and Fusar-Poli 2012; Davatzikos et al. 2005; Orrù et al. 2012).
Multimodal Imaging Approaches
Another approach to overcoming the limitations of current neuroimaging study designs has been to use multimodal imaging techniques combined with advanced statistical analyses. For instance, a combined analysis of fMRI, structural MRI, and EEG data employing canonical correlation methods could be used to differentiate patients with schizophrenia from control subjects with a level of accuracy exceeding 90% certainty (Sui et al. 2014).
Electroencephalography and Magneto-encephalography
The brain is an organ with a high level of intrinsic electrical activity. EEG and MEG are technologies that enable the recording of this electrical activity of the brain using scalp electrodes. These techniques are believed to represent brain activity in real time, and with a higher temporal resolution (∼msec) than PET or fMRI. The electrical activity recorded is generated by the postsynaptic potentials of the neurons and hence represents a direct indication of neural activity. The EEG detects the electrical potential of the field, while MEG detects the magnetic component. EEG uses relatively simple equipment, basically a multielectrode helmet, an amplifying and filtering device, and a computer (Ebner et al. 1999). A minimum of 32 scalp electrodes are needed to localize the sources of the recorded potential EEG, but high-density arrays of 128 or 256 electrodes are employed increasingly in research. MEG, by contrast, employs cutting-edge technology (Ioannides 2006), because the detection of a magnetic field intensity as weak as the one produced by the brain (∼20,000 billion times weaker than the intensity of the Earth’s magnetic field) requires the use of superconducting coil units based on superconducting quantum interference device (SQUID) technology. These units need to be specially cooled to a temperature near absolute zero. To avoid the intrusion of electromagnetic interference from the environment, the recording takes place in a room that has been appropriately shielded. MEG commonly employs arrays of 100–300 detectors.
Given the high temporal resolution of MEG and EEG, these techniques are used to study simultaneous (time-locked) neural discharges occurring in distant or contiguous groups of neurons, often referred to as “synchronous neural activity” (Tononi and Edelman 1998; Varela et al. 2001). These synchronous neural discharges are seen in both pathological situations (such as seizure discharges) and normal physiological situations (such as during development of function neural circuits). The high temporal resolution also enables measurement of neural response to sensory (somatosensory) or cognitive stimuli delivered from outside, and this process, known as the study of evoked or event-related potentials, has enabled considerable progress in understanding the pathophysiology of several neurological and psychiatric disorders. The temporal sequence of the neural responses following delivery of the stimulus (known as “time series”) is measured sequentially and averaged to generate a waveform. By combining all waveforms from all detectors, one can develop a surface map of the beginning, middle, and end of the neural response to a given stimulus.
In spite of such advances, there are some barriers to using EEG or MEG in routine clinical contexts. First, these techniques provide limited spatial resolution, given that the recorded electrical signals are averaged over extended regions of the brain. Attempts have been made to overcome this limitation through technical and mathematical means, such as the use of “dense array” (128–256 electrodes) coils to obtain multiple electrical potentials, which can then be combined using complex mathematical models to yield anatomically relevant data. Second, EEG and MEG are essentially surface techniques; because the intensity of the electromagnetic field decreases rapidly with distance, detection of neural signals is restricted to the sources closest to the detectors—that is, the neocortex. The activity of subcortical regions is very difficult to detect.
Despite these limitations, studies using EEG and related technology of evoked potentials have made significant contributions to our understanding of the pathophysiology of neurological and psychiatric disorders. Examples of such studies include the following:
Abnormalities in power spectral analysis of the resting-state EEG and study of evoked potentials in response to auditory stimuli have been consistently associated with core cognitive and neurochemical deficits in patients with schizophrenia and might lead to more effective subtyping of the disorder and delivery of more targeted and personalized care (Ford and Mathalon 2005; Turetsky et al. 1998).
Studies using dense-array EEG suggest that moderate depression may sensitize limbic networks to respond more strongly to aversive events than to positive events (Tucker et al. 2003).
EEG has been combined with other functional imaging techniques to yield highly specific temporal and spatial information, which could then be used to study deficits in neural systems and reward anticipation across multiple diagnostic entities (Gorka et al. 2015).
Some authors have recommended the use of EEG technologies in conjunction with fMRI to study analgesia and pain management (Wise and Tracey 2006).
Combined PET and EEG technologies using a source localization technique have identified disruption of frontocingulate connectivity among patients with depression (Pizzagalli et al. 2003). Studies such as these provide critical information that can complement and enhance our understanding of functional imaging approaches.
A series of papers have reported consistent evidence showing that quantitative EEG (qEEG) changes are predictive not only of antidepressant response but also of placebo response and might also help identify specific subtypes who will benefit from neuroplasticity-promoting treatments such as transcranial magnetic stimulation (Leuchter et al. 2015).
EEG-derived brain rhythm patterns have been proposed as putative biomarkers for objectively evaluating neuromodulation success and for guiding deep brain stimulation or other target-based neuromodulation strategies for patients with treatment-resistant depression (Broadway et al. 2012).
Novel Insights From Brain Imaging in Applied Clinical Psychopharmacology
Identifying Individuals at Risk of Developing Psychopathology
MAO-PET Labeling Studies
Sacher et al. (2012) used 11C-harmine PET scanning technology to measure the effect of changes in monoamine oxidase A (MAO-A) binding in brain regions implicated in affective and neurodegenerative disease. They showed that elevated activity of MAO in the ACC and prefrontal cortical area not only was associated with increases in depressive symptoms but also predicted the development of postpartum depression. This study demonstrates how receptor-labeling PET-ligand studies can provide novel therapeutic targets for new drug development and also inform the pathophysiology of depressive conditions. More importantly, early identification of high-risk individuals might usher in an era of prophylactic medication therapy.
Machine-Learning Approach to Profiling Risk of Bipolar Disorder
Neuroimaging findings from illness-based cohorts are often contaminated by chronicity effects of illness duration, medication exposure, and medical comorbidities (Hajek et al. 2015). A highly relevant approach in this regard might be to study patterns of neuroimaging change among genetically high-risk individuals, such as biological relatives of probands with a highly heritable disorder such as bipolar disorder, and to compare these high-risk individuals with a population of healthy control subjects. These data can then be analyzed by specialized pattern-recognition software such as support vector machines (Orrù et al. 2012) to identify patterns that differentiate high-risk individuals from healthy controls. Machine learning has recently been used to identify individuals at high genetic risk for bipolar disorder based on brain structure by comparing offspring of parents with bipolar disorder with an age- and sex-matched control group. Much to the surprise of the investigators, the brain changes, which significantly contributed to the between-group discrimination, included white matter of inferior/middle regions of frontal and temporal gyri and precuneus and not any of the gray matter regions included in the study (Hajek et al. 2015).
Neurochemical Targeting in Antipsychotic Treatment
Mechanisms of Dopamine System Hyperresponsiveness in Schizophrenia
It has long been known that patients diagnosed with schizophrenia have an exaggerated dopamine response to amphetamine challenge. Laruelle et al. (1995) conducted a landmark study in which they used SPECT to profile intrasynaptic dopamine release in human striatum following dextroamphetamine sulfate (D-amphetamine) challenge testing. Using the D2 receptor–labeling radiotracer [123I]-iodobenzamide ([123I]IBZM), they demonstrated a decrease in D2 receptor availability resulting from exaggerated release of dopamine (which occupied the D2 receptors in response to amphetamine challenge) in the schizophrenic brains compared with healthy brains (Laruelle et al. 1995). This study was one of the very first to demonstrate the power of modern neuroimaging to shed light on neurochemical processes that mediate drug action.
Discrimination of Biological Changes Mediating Effects and Side Effects of Antipsychotic Medication
Antipsychotic pharmacotherapy is heavily based on the premise that a correction of the exaggerated dopaminergic response might overstimulate D2 receptors. However, excessive and near-total blockade of the D2 receptors can lead to unwanted extrapyramidal side effects (EPS) and motor symptoms. Using a series of innovative PET ligand–based imaging paradigms, Kapur and colleagues (Ginovart and Kapur 2012; Kapur and Seeman 2001) explored the question of whether the thresholds for clinical response and for EPS could be separated in terms of differential D2 occupancy, measured via the PET-based D2 binding ligand 11C-raclopride following administration of haloperidol. They found that D2 occupancy at a threshold of 65% significantly predicted clinical response, whereas D2 occupancy above 78% produced EPS, and D2 occupancy above 72% produced significant prolactin elevation. Thus, even with a relatively typical antipsychotic such as haloperidol, it is possible, although not clinically feasible, to obtain an antipsychotic effect without causing EPS just by optimizing D2 occupancy. The authors later extended this observation to show that whereas even atypical antipsychotic agents with a low propensity to cause EPS, such as quetiapine and clozapine, achieved D2 binding rates of 60% within 2 hours following administration (which might explain their antipsychotic efficacy), D2 binding rates declined to less than 20% after 12 hours in the case of quetiapine and to 26% after 24 hours in the case of clozapine (which might underlie these agents’ relative lack of EPS). The atypical antipsychotics risperidone and olanzapine achieve robust antipsychotic activity only at dosages producing D2 receptor occupancy of 65% or greater, which is similar to the action of haloperidol (Ginovart and Kapur 2012; Kapur and Seeman 2001).
Profiling to Guide Treatment Selection
Identifying patients who will be ideal candidates for the manifold treatment options for major depressive disorder has been an ongoing challenge (Alhajji and Nemeroff 2015). Neuroimaging profiles have been proposed as biomarkers that could subtype and identify patients for specific therapies. Accordingly, insula hypometabolism (as indexed by 18FDG uptake) was shown to be associated with achievement of remission with cognitive-behavioral therapy and poor response to escitalopram, while insula hypermetabolism was associated with achievement of remission with escitalopram and poor response to cognitive-behavioral therapy (McGrath et al. 2013).
Subtyping of Clinical Syndromes
Not every patient with schizophrenia responds to D2-blocking antipsychotic medications. Using [18F] DOPA PET to label presynaptic dopamine synthesis, Demjaha et al. (2012) demonstrated that patients who responded to antipsychotic treatment showed significantly higher [18F] DOPA uptake in the striatum compared with patients who did not respond to D2-blocking agents. This important study points to the possibility that neuroimaging techniques might be used to profile antipsychotic-responsive versus nonresponsive schizophrenic patient subgroups.
Elucidating Mechanisms of Action of Novel and Older Treatments
Neuroimaging Studies of the Mechanism of Ketamine’s Antidepressant Effects
Ketamine is a novel antidepressant with both a novel mechanism of action and a rapid antidepressant effect seen within hours of administration (as opposed to a time lapse of weeks). The precise mechanisms underlying its rapid antidepressant effects are being explored using novel neuroimaging techniques. Studies have consistently shown a decrease in pretreatment resting ACC activity and decreased engagement of pregenual ACC in response to cognitive challenge induced by a working-memory paradigm (Salvadore et al. 2009, 2010). In addition, treatment-resistant depression was associated with decreased neural responses in the right caudate to faces showing positive emotional expression—a change that was reversed following antidepressant response to ketamine (Murrough et al. 2015). Rapid antidepressant response to ketamine was also associated with decreases in amygdalar activity (Salvadore et al. 2010). Synaptic potentiation has been proposed as a mechanism underlying chronic antidepressant treatment response, and it is clear that repeated administration of ketamine induces synaptic proteins and enhances synaptic plasticity. A temporal dissociation between acute changes in cortical excitability (measured using MEG) and clinical antidepressant response led to the conclusion that ketamine’s antidepressant effects might be mediated by non–N-methyl-D-aspartate (NMDA)-induced synaptic plasticity mechanisms (Cornwell et al. 2012). MRS measurements of glutamate response to ketamine administration among depressed and nondepressed human subjects have shown varied results, with some studies showing no changes (Forbes et al. 2009; Stone et al. 2012; M.J. Taylor et al. 2012; Valentine et al. 2011) and others showing increases in glutamate concentrations (Milak et al. 2016; Rowland et al. 2005; Salvadore et al. 2012). Nevertheless, MRS measurements obtained within a short time window of 26 minutes following ketamine administration demonstrated greater increases in glutamate than were seen in scans obtained after longer wait times (Milak et al. 2016).
Acute and Delayed Effects of Neuromodulation Using Deep Brain Stimulation
Neuromodulation treatments remain the last few options available for treatment-resistant depression and include commercially available approaches such as ECT, transcranial magnetic stimulation (TMS), and vagus nerve stimulation (VNS) as well as experimentally available modalities such as transcranial direct current stimulation (tDCS), magnetic seizure therapy, cortical brain stimulation, and DBS. A detailed description of network changes during neuromodulation treatments is beyond the scope of this chapter, and readers are referred to authoritative reviews on the topic published elsewhere (Smart et al. 2015). Multimodality imaging techniques have been used to guide and inform target selection for neuromodulation treatments based on DBS. Preoperatively acquired diffusion imaging for connectivity-based cortical mapping in combination with postoperative computed tomography could improve neurosurgical targeting and has been used to delineate adaptive changes in white matter tracts and modulation of neural activity in response to the immediate and delayed effects of DBS. Using these cortical mapping techniques, Johansen-Berg et al. (2008) demonstrated that the acute antidepressant effects of DBS were mediated by its effect on a network involving the subgenual ACC region (BA 25), with strongest connections to nucleus accumbens, amygdala, hypothalamus, and orbitofrontal cortex. Choi et al. (2015) used structural connectivity analysis to show that the best intraoperative response to DBS consisted of both interoceptive and exteroceptive changes involving contacts connected to the bilateral ventromedial frontal cortex (via forceps minor and left uncinate fasciculus) and the cingulate cortex (via left cingulum bundle). Later studies at 6 months and 2 years showed that response to DBS not only engaged the above regions but also recruited additional regions (Crowell et al. 2015). Specifically, all DBS responders showed engagement by subgenual ACC of the same bilateral pathways from their activation volumes in subgenual ACC to 1) medial frontal cortex via forceps minor and uncinate fasciculus, 2) rostral and dorsal cingulate cortex via the cingulum bundle, and 3) subcortical nuclei (Riva-Posse et al. 2014). Similar strategies are also guiding refined target selection for noninvasive neuromodulation techniques such as repetitive TMS (Fox et al. 2014).
Improved Understanding of Mechanism of Action of Older Medications
While multiple newer and faster-acting treatments have become available to treat depression, older agents such as SSRIs continue to be widely useful. Negative cognitive bias is a vulnerability marker for depression, and its neural footprints have been mapped with fMRI indices such as exaggerated amygdalar response to fearful faces. Catherine Harmer and colleagues used a double-blind, placebo-controlled pharmacological fMRI paradigm to demonstrate that a single dose of intravenous citalopram resulted in significantly greater reductions in amygdalar responses to fearful facial expressions compared with placebo (Murphy et al. 2009). In a subsequent study, the same group demonstrated that oral citalopram given at 10 mg/day for 7 days resulted in similar reductions in exaggerated amygdalar response to negative emotional stimuli, which predicted clinical improvement in depressed mood (Godlewska et al. 2012).
Conclusion
Contemporary brain-imaging methods provide a variety of strategies to probe structural, functional, and chemical abnormalities in specific neural circuits relevant to psychiatric illness. Such studies are having a considerable impact on our conceptualization of these disorders, with potential impacts on diagnosis (Mayberg 2003a), clinical management (monitoring occupancy or PIB changes with treatment [Klunk et al. 2004]), and novel treatment development (Mayberg 2009). Brain-imaging studies in psychopharmacology can be categorized both by the scanning technology employed (e.g., MRI, PET, EEG) and by the type of measurement obtained (e.g., activation, resting state, behavioral, biochemical, receptor mapping). Receptor-mapping studies have clearly added to our ability to understand mechanisms of action of psychopharmacological agents and their side-effect profiles. Activation studies, which indirectly measure neuronal activity vis-à-vis changes in CBF, have become widely used with fMRI technology, providing new insights into behaviorally specific subcircuits. Structural MRI studies have also begun to yield considerable data, enabling a better understanding of how the disease processes are regionally localized, where to target for functional imaging, and where to obtain specimens for postmortem histopathological analysis. Multimodal imaging through a combination of fMRI, PET, structural MRI, MRS, and electromagnetic measurement (EEG, MEG) offers the promise of identifying both neuronal and chemical changes related to brain function.
References
Abdallah CG, Jiang L, De Feyter HM, et al: Glutamate metabolism in major depressive disorder. Am J Psychiatry 171(12): 1320–1327, 2014 25073688
Alexander AL, Lee JE, Lazar M, et al: Diffusion tensor imaging of the corpus callosum in Autism. Neuroimage 34(1):61–73, 2007 17023185
Alexopoulos GS, Meyers BS, Young RC, et al: ‘Vascular depression’ hypothesis. Arch Gen Psychiatry 54(10):915–922, 1997 9337771
Alhajji L, Nemeroff CB: Personalized medicine and mood disorders. Psychiatr Clin North Am 38(3):395–403, 2015 26300030
American Psychiatric Association: Diagnostic and Statistical Manual of Mental Disorders, 4th Edition. Washington, DC, American Psychiatric Association, 1994
American Psychiatric Association: Diagnostic and Statistical Manual of Mental Disorders, 5th Edition. Arlington, VA, American Psychiatric Association, 2013
Berns GS: Functional neuroimaging. Life Sci 65(24):2531–2540, 1999 10619361
Biswal BB, Van Kylen J, Hyde JS: Simultaneous assessment of flow and BOLD signals in resting-state functional connectivity maps. NMR Biomed 10(4–5):165–170, 1997 9430343
Blier P, Ward NM: Is there a role for 5-HT1A agonists in the treatment of depression? Biol Psychiatry 53(3):193–203, 2003 12559651
Bluhm RL, Miller J, Lanius RA, et al: Spontaneous low-frequency fluctuations in the BOLD signal in schizophrenic patients: anomalies in the default network. Schizophr Bull 33(4):1004–1012, 2007 17556752
Bookheimer SY, Strojwas MH, Cohen MS, et al: Patterns of brain activation in people at risk for Alzheimer’s disease. N Engl J Med 343(7):450–456, 2000 10944562
Borgwardt S, Fusar-Poli P: Third-generation neuroimaging in early schizophrenia: translating research evidence into clinical utility. Br J Psychiatry 200(4):270–272, 2012 22474231
Bremner JD: Functional neuroimaging in post-traumatic stress disorder. Expert Rev Neurother 7(4):393–405, 2007 17425494
Bremner JD, Innis RB, White T, et al: SPECT [I-123]iomazenil measurement of the benzodiazepine receptor in panic disorder. Biol Psychiatry 47(2):96–106, 2000 10664825
Broadway JM, Holtzheimer PE, Hilimire MR, et al: Frontal theta cordance predicts 6-month antidepressant response to subcallosal cingulate deep brain stimulation for treatment-resistant depression: a pilot study. Neuropsychopharmacology 37(7):1764–1772, 2012 22414813
Brown AK, Fujita M, Fujimura Y, et al: Radiation dosimetry and biodistribution in monkey and man of 11C-PBR28: a PET radioligand to image inflammation. J Nucl Med 48(12):2072–2079, 2007 18006619
Buckner RL, Vincent JL: Unrest at rest: default activity and spontaneous network correlations. Neuroimage 37(4):1091–1096, discussion 1097–1099, 2007 17368915
Bullmore E, Sporns O: Complex brain networks: graph theoretical analysis of structural and functional systems. Nat Rev Neurosci 10(3):186–198, 2009 19190637
Buxton RB: Introduction to Functional Magnetic Resonance Imaging. Principles and Techniques. Cambridge, UK, Cambridge Univeristy Press, 2002
Capuron L, Pagnoni G, Drake DF, et al: Dopaminergic mechanisms of reduced basal ganglia responses to hedonic reward during interferon alfa administration. Arch Gen Psychiatry 69(10):1044–1053, 2012 23026954
Carbon M, Eidelberg D: Modulation of regional brain function by deep brain stimulation: studies with positron emission tomography. Curr Opin Neurol 15(4):451–455, 2002 12151842
Cherkassky VL, Kana RK, Keller TA, Just MA: Functional connectivity in a baseline resting-state network in autism. Neuroreport 17(16):1687–1690, 2006 17047454
Choi KS, Riva-Posse P, Gross RE, Mayberg HS: Mapping the “depression switch” during intraoperative testing of subcallosal cingulate deep brain stimulation. JAMA Neurol 72(11):1252–1260, 2015 26408865
Cornwell BR, Salvadore G, Furey M, et al: Synaptic potentiation is critical for rapid antidepressant response to ketamine in treatment-resistant major depression. Biol Psychiatry 72(7):555–561, 2012 22521148
Craik FIM, Moroz TM, Moscovitch M, et al: In search of the self: a positron emission tomography study. Psychological Science 10(1):26–34, 1999 doi: 10.1111/1467-9280.00102
Cropley VL, Fujita M, Innis RB, Nathan PJ: Molecular imaging of the dopaminergic system and its association with human cognitive function. Biol Psychiatry 59(10):898–907, 2006 16682268
Crowell AL, Garlow SJ, Riva-Posse P, Mayberg HS: Characterizing the therapeutic response to deep brain stimulation for treatment-resistant depression: a single center long-term perspective. Front Integr Neurosci 9:41, 2015 26124710
Dani M, Brooks DJ, Edison P: Tau imaging in neurodegenerative diseases. Eur J Nucl Med Mol Imaging 43(6):1139–1150, 2016 26572762
Davatzikos C, Ruparel K, Fan Y, et al: Classifying spatial patterns of brain activity with machine learning methods: application to lie detection. Neuroimage 28(3):663–668, 2005 16169252
Demjaha A, Murray RM, McGuire PK, et al: Dopamine synthesis capacity in patients with treatment-resistant schizophrenia. Am J Psychiatry 169(11):1203–1210, 2012 23034655
Detre JA, Wang J, Wang Z, Rao H: Arterial spin-labeled perfusion MRI in basic and clinical neuroscience. Curr Opin Neurol 22(4):348–355, 2009 19491678
Detre JA, Rao H, Wang DJ, et al: Applications of arterial spin labeled MRI in the brain. J Magn Reson Imaging 35(5):1026–1037, 2012 22246782
Dixon MR, Jacobs EA, Sanders S: Contextual control of delay discounting by pathological gamblers. J Appl Behav Anal 39(4):413–422, 2006 17236338
Ebner A, Sciarretta G, Epstein CM, Nuwer M; The International Federation of Clinical Neurophysiology: EEG instrumentation. Electroencephalogr Clin Neurophysiol Suppl 52:7–10, 1999 10590971
Elliott R, Rubinsztein JS, Sahakian BJ, Dolan RJ: The neural basis of mood-congruent processing biases in depression. Arch Gen Psychiatry 59(7):597–604, 2002 12090812
Erritzoe D, Talbot P, Frankle WG, Abi-Dargham A: Positron emission tomography and single photon emission CT molecular imaging in schizophrenia. Neuroimaging Clin N Am 13(4):817–832, 2003 15024964
Evans KC, Dougherty DD, Pollack MH, Rauch SL: Using neuroimaging to predict treatment response in mood and anxiety disorders. Ann Clin Psychiatry 18(1):33–42, 2006 16517451
Fisher PM, Meltzer CC, Ziolko SK, et al: Capacity for 5-HT1A-mediated autoregulation predicts amygdala reactivity. Nat Neurosci 9(11):1362–1363, 2006 17013380
Forbes NF, Carrick LA, McIntosh AM, Lawrie SM: Working memory in schizophrenia: a meta-analysis. Psychol Med 39(6):889–905, 2009 18945379
Ford JM, Mathalon DH: Corollary discharge dysfunction in schizophrenia: can it explain auditory hallucinations? Int J Psychophysiol 58(2–3):179–189, 2005 16137779
Fossati P, Hevenor SJ, Graham SJ, et al: In search of the emotional self: an fMRI study using positive and negative emotional words. Am J Psychiatry 160(11): 1938–1945, 2003 14594739
Fox MD, Buckner RL, Liu H, et al: Resting-state networks link invasive and noninvasive brain stimulation across diverse psychiatric and neurological diseases. Proc Natl Acad Sci U S A 111(41):E4367–E4375, 2014 25267639
Frye MA, Watzl J, Banakar S, et al: Increased anterior cingulate/medial prefrontal cortical glutamate and creatine in bipolar depression. Neuropsychopharmacology 32(12):2490–2499, 2007 17429412
Fu CH, Williams SC, Brammer MJ, et al: Neural responses to happy facial expressions in major depression following antidepressant treatment. Am J Psychiatry 164(4):599–607, 2007 17403973
Fujimoto T, Takeuch K, Matsumoto T, et al: Abnormal glucose metabolism in the anterior cingulate cortex in patients with schizophrenia. Psychiatry Res 154(1):49–58, 2007 17188463
Gigante AD, Bond DJ, Lafer B, et al: Brain glutamate levels measured by magnetic resonance spectroscopy in patients with bipolar disorder: a meta-analysis. Bipolar Disord 14(5):478–487, 2012 22834460
Ginovart N, Kapur S: Role of dopamine D(2) receptors for antipsychotic activity. Handb Exp Pharmacol (212):27–52, 2012 23129327
Godlewska BR, Norbury R, Selvaraj S, et al: Short-term SSRI treatment normalises amygdala hyperactivity in depressed patients. Psychol Med 42(12):2609–2617, 2012 22716999
Gorka SM, Phan KL, Shankman SA: Convergence of EEG and fMRI measures of reward anticipation. Biol Psychol 112:12–19, 2015 26394333
Greicius MD, Flores BH, Menon V, et al: Resting-state functional connectivity in major depression: abnormally increased contributions from subgenual cingulate cortex and thalamus. Biol Psychiatry 62(5):429–437, 2007 17210143
Gunn RN, Slifstein M, Searle GE, Price JC: Quantitative imaging of protein targets in the human brain with PET. Phys Med Biol 60(22):R363–R411, 2015 26513176
Gusnard DA, Raichle ME, Raichle ME: Searching for a baseline: functional imaging and the resting human brain. Nat Rev Neurosci 2(10):685–694, 2001 11584306
Hajek T, Cooke C, Kopecek M, et al: Using structural MRI to identify individuals at genetic risk for bipolar disorders: a 2-cohort, machine learning study. J Psychiatry Neurosci 40(5):316–324, 2015 25853284
Hariri AR, Mattay VS, Tessitore A, et al: Serotonin transporter genetic variation and the response of the human amygdala. Science 297(5580):400–403, 2002 12130784
Haroon E, Pagnoni G, Heim CM, et al: Brain imaging in psychophrmacology, in The American Psychiatric Publishing Textbook of Psychopharmacology, 4th Edition. Edited by Schatzberg AF, Nemeroff CB. Arlington, VA, American Psychiatric Publishing, 2009, pp 221–242
Haroon E, Raison CL, Miller AH: Psychoneuroimmunology meets neuropsychopharmacology: translational implications of the impact of inflammation on behavior. Neuropsychopharmacology 37(1):137–162, 2012 21918508
Haroon E, Woolwine BJ, Chen X, et al: IFN-alpha-induced cortical and subcortical glutamate changes assessed by magnetic resonance spectroscopy. Neuropsychopharmacology 39(7):1777–1785, 2014 24481242
Haroon E, Felger JC, Woolwine BJ, et al: Age-related increases in basal ganglia glutamate are associated with TNF, reduced motivation and decreased psychomotor speed during IFN-alpha treatment: preliminary findings. Brain Behav Immun 46:17–22, 2015 25500218
Haroon E, Fleischer CC, Felger JC, et al: Conceptual convergence: increased inflammation is associated with increased basal ganglia glutamate in patients with major depression. Mol Psychiatry 21(10):1351–1357, 2016 26754953
Harvey PO, Fossati P, Pochon JB, et al: Cognitive control and brain resources in major depression: an fMRI study using the n-back task. Neuroimage 26(3):860–869, 2005 15955496
Herscovitch P, Markham J, Raichle ME: Brain blood flow measured with intravenous H2(15)O, I: theory and error analysis. J Nucl Med 24(9):782–789, 1983 6604139
Ioannides AA: Magnetoencephalography as a research tool in neuroscience: state of the art. Neuroscientist 12(6):524–544, 2006 17079518
Johansen-Berg H, Gutman DA, Behrens TE, et al: Anatomical connectivity of the subgenual cingulate region targeted with deep brain stimulation for treatment-resistant depression. Cereb Cortex 18(6):1374–1383, 2008 17928332
Kapur S, Remington G: Dopamine D(2) receptors and their role in atypical antipsychotic action: still necessary and may even be sufficient. Biol Psychiatry 50(11): 873–883, 2001 11743942
Kapur S, Seeman P: Does fast dissociation from the dopamine d(2) receptor explain the action of atypical antipsychotics? A new hypothesis. Am J Psychiatry 158(3): 360–369, 2001 11229973
Kenk M, Selvanathan T, Rao N, et al: Imaging neuroinflammation in gray and white matter in schizophrenia: an in-vivo PET study with [18F]-FEPPA. Schizophr Bull 41(1):85–93, 2015 25385788
Kennedy C, Des Rosiers MH, Sakurada O, et al: Metabolic mapping of the primary visual system of the monkey by means of the autoradiographic [14C]deoxyglucose technique. Proc Natl Acad Sci U S A 73(11):4230–4234, 1976 825861
Kilts CD, Gross RE, Ely TD, Drexler KP: The neural correlates of cue-induced craving in cocaine-dependent women. Am J Psychiatry 161(2):233–241, 2004 14754771
Klumpp H, Fitzgerald DA, Phan KL: Neural predictors and mechanisms of cognitive behavioral therapy on threat processing in social anxiety disorder. Prog Neuropsychopharmacol Biol Psychiatry 45:83–91, 2013 23665375
Klunk WE, Engler H, Nordberg A, et al: Imaging brain amyloid in Alzheimer’s disease with Pittsburgh Compound-B. Ann Neurol 55(3):306–319, 2004 14991808
Kubicki M, McCarley R, Westin CF, et al: A review of diffusion tensor imaging studies in schizophrenia. J Psychiatr Res 41(1–2):15–30, 2007 16023676
Kumar A, Mintz J, Bilker W, Gottlieb G: Autonomous neurobiological pathways to late-life major depressive disorder: clinical and pathophysiological implications. Neuropsychopharmacology 26(2):229–236, 2002 11790518
Kumar JS, Mann JJ: PET tracers for serotonin receptors and their applications. Cent Nerv Syst Agents Med Chem 14(2):96–112, 2014 25360773
Lange C, Kracht L, Herholz K, et al: Reduced glucose metabolism in temporo-parietal cortices of women with borderline personality disorder. Psychiatry Res 139(2): 115–126, 2005 15978784
Laruelle M, Abi-Dargham A, van Dyck CH, et al: SPECT imaging of striatal dopamine release after amphetamine challenge. J Nucl Med 36(7):1182–1190, 1995 7790942
Le Bihan D: Looking into the functional architecture of the brain with diffusion MRI. Nat Rev Neurosci 4(6):469–480, 2003 12778119
Lemogne C, le Bastard G, Mayberg H, et al: In search of the depressive self: extended medial prefrontal network during self-referential processing in major depression. Soc Cogn Affect Neurosci 4(3):305–312, 2009 19307251
Leuchter AF, Hunter AM, Krantz DE, Cook IA: Rhythms and blues: modulation of oscillatory synchrony and the mechanism of action of antidepressant treatments. Ann N Y Acad Sci 1344:78–91, 2015 25809789
Lowe MJ, Phillips MD, Lurito JT, et al: Multiple sclerosis: low-frequency temporal blood oxygen level-dependent fluctuations indicate reduced functional connectivity initial results. Radiology 224(1):184–192, 2002 12091681
Luat AF, Makki M, Chugani HT: Neuroimaging in tuberous sclerosis complex. Curr Opin Neurol 20(2):142–150, 2007 17351483
Lyoo IK, Renshaw PF: Magnetic resonance spectroscopy: current and future applications in psychiatric research. Biol Psychiatry 51(3):195–207, 2002 11839362
Magistretti PJ: Neuron-glia metabolic coupling and plasticity. J Exp Biol 209(Pt 12):2304–2311, 2006 16731806
Magistretti PJ, Pellerin L: Astrocytes Couple Synaptic Activity to Glucose Utilization in the Brain. News Physiol Sci 14:177–182, 1999a 11390847
Magistretti PJ, Pellerin L: Cellular mechanisms of brain energy metabolism and their relevance to functional brain imaging. Philos Trans R Soc Lond B Biol Sci 354(1387):1155–1163, 1999b 10466143
Mason GF, Krystal JH: MR spectroscopy: its potential role for drug development for the treatment of psychiatric diseases. NMR Biomed 19(6):690–701, 2006 16986118
Mathis CA, Klunk WE, Price JC, DeKosky ST: Imaging technology for neurodegenerative diseases: progress toward detection of specific pathologies. Arch Neurol 62(2):196–200, 2005 15710847
Mayberg HS: Modulating dysfunctional limbic-cortical circuits in depression: towards development of brain-based algorithms for diagnosis and optimised treatment. Br Med Bull 65:193–207, 2003a 12697626
Mayberg HS: Positron emission tomography imaging in depression: a neural systems perspective. Neuroimaging Clin N Am 13(4):805–815, 2003b 15024963
Mayberg HS: Targeted electrode-based modulation of neural circuits for depression. J Clin Invest 119(4):717–725, 2009 19339763
McClure SM, Laibson DI, Loewenstein G, Cohen JD: Separate neural systems value immediate and delayed monetary rewards. Science 306(5695):503–507, 2004 15486304
McGrath CL, Kelley ME, Holtzheimer PE, et al: Toward a neuroimaging treatment selection biomarker for major depressive disorder. JAMA Psychiatry 70(8):821–829, 2013 23760393
Menon V: Large-scale brain networks and psychopathology: a unifying triple network model. Trends Cogn Sci 15(10):483–506, 2011 21908230
Menon RS, Goodyear BG: Submillimeter functional localization in human striate cortex using BOLD contrast at 4 tesla: implications for the vascular point-spread function. Magn Reson Med 41(2):230–235, 1999 10080267
Mettenburg JM, Benzinger TL, Shimony JS, et al: Diminished performance on neuropsychological testing in late life depression is correlated with microstructural white matter abnormalities. Neuroimage 60(4):2182–2190, 2012 22487548
Meyer JH: Imaging the serotonin transporter during major depressive disorder and antidepressant treatment. J Psychiatry Neurosci 32(2):86–102, 2007 17353938
Meyer JH, Wilson AA, Rusjan P, et al: Serotonin2A receptor binding potential in people with aggressive and violent behaviour. J Psychiatry Neurosci 33(6):499–508, 2008 18982172
Meyer-Lindenberg A, Weinberger DR: Intermediate phenotypes and genetic mechanisms of psychiatric disorders. Nat Rev Neurosci 7(10):818–827, 2006 16988657
Milak MS, Proper CJ, Mulhern ST, et al: A pilot in vivo proton magnetic resonance spectroscopy study of amino acid neurotransmitter response to ketamine treatment of major depressive disorder. Mol Psychiatry 21(3):320–327, 2016 26283639
Miller AH, Haroon E, Raison CL, Felger JC: Cytokine targets in the brain: impact on neurotransmitters and neurocircuits. Depress Anxiety 30(4):297–306, 2013 23468190
Miller CH, Hamilton JP, Sacchet MD, Gotlib IH: Meta-analysis of functional neuroimaging of major depressive disorder in youth. JAMA Psychiatry 72(10):1045–1053, 2015 26332700
Mintun MA, Raichle ME, Kilbourn MR, et al: A quantitative model for the in vivo assessment of drug binding sites with positron emission tomography. Ann Neurol 15(3):217–227, 1984 6609679
Mitterschiffthaler MT, Kumari V, Malhi GS, et al: Neural response to pleasant stimuli in anhedonia: an fMRI study. Neuroreport 14(2):177–182, 2003 12598724
Moore CM, Frederick BB, Renshaw PF: Brain biochemistry using magnetic resonance spectroscopy: relevance to psychiatric illness in the elderly. J Geriatr Psychiatry Neurol 12(3):107–117, 1999 10593699
Moore CM, Wardrop M, deB Frederick B, Renshaw PF: Topiramate raises anterior cingulate cortex glutamine levels in healthy men; a 4.0 T magnetic resonance spectroscopy study. Psychopharmacology (Berl) 188(2):236–243, 2006 16944105
Moore GJ, Bebchuk JM, Wilds IB, et al: Lithium-induced increase in human brain grey matter. Lancet 356(9237):1241–1242, 2000 11072948
Murphy SE, Norbury R, O’Sullivan U, et al: Effect of a single dose of citalopram on amygdala response to emotional faces. Br J Psychiatry 194(6):535–540, 2009 19478294
Murrough JW, Collins KA, Fields J, et al: Regulation of neural responses to emotion perception by ketamine in individuals with treatment-resistant major depressive disorder. Transl Psychiatry 5:e509, 2015 25689570
Myers R, Manjil LG, Cullen BM, et al: Macrophage and astrocyte populations in relation to [3H]PK 11195 binding in rat cerebral cortex following a local ischaemic lesion. J Cereb Blood Flow Metab 11(2): 314–322, 1991 1997503
National Institute of Biomedical Imaging and Bioengineering: Nuclear medicine (fact sheet), July 2013. Bethesda, MD, NIBIB, Office of Science Policy and Communications. Available at: http://www.nibib.nih.gov/sites/default/files/Nuclear%20Medicine%20Fact%20Sheet.pdf. Accessed February 19, 2016.
Nemeroff CB, Owens MJ: The role of serotonin in the pathophysiology of depression: as important as ever. Clin Chem 55(8):1578–1579, 2009 19498050
Nestor PG, Kubicki M, Spencer KM, et al: Attentional networks and cingulum bundle in chronic schizophrenia. Schizophr Res 90(1–3):308–315, 2007 17150337
Neumeister A, Nugent AC, Waldeck T, et al: Neural and behavioral responses to tryptophan depletion in unmedicated patients with remitted major depressive disorder and controls. Arch Gen Psychiatry 61(8):765–773, 2004 15289275
Ogawa S, Tank DW, Menon R, et al: Intrinsic signal changes accompanying sensory stimulation: functional brain mapping with magnetic resonance imaging. Proc Natl Acad Sci U S A 89(13):5951–5955, 1992 1631079
Ono M, Wilson A, Nobrega J, et al: 11C-labeled stilbene derivatives as Abeta-aggregate-specific PET imaging agents for Alzheimer’s disease. Nucl Med Biol 30(6):565–571, 2003 12900282
Orrù G, Pettersson-Yeo W, Marquand AF, et al: Using Support Vector Machine to identify imaging biomarkers of neurological and psychiatric disease: a critical review. Neurosci Biobehav Rev 36(4):1140–1152, 2012 22305994
Owen AM, McMillan KM, Laird AR, Bullmore E: N-back working memory paradigm: a meta-analysis of normative functional neuroimaging studies. Hum Brain Mapp 25(1):46–59, 2005 15846822
Parsey RV, Krishnan KR: A new MRI ratio method for in-vivo estimation of signal hypointensity in aging and Alzheimer’s disease. Prog Neuropsychopharmacol Biol Psychiatry 21(8):1257–1267, 1997 9460090
Paulus MP, Stein MB: An insular view of anxiety. Biol Psychiatry 60(4):383–387, 2006 16780813
Pearlson GD, Calhoun V: Structural and functional magnetic resonance imaging in psychiatric disorders. Can J Psychiatry 52(3):158–166, 2007 17479523
Pizzagalli DA, Oakes TR, Davidson RJ: Coupling of theta activity and glucose metabolism in the human rostral anterior cingulate cortex: an EEG/PET study of normal and depressed subjects. Psychophysiology 40(6):939–949, 2003 14986847
Post RM, Speer AM, Hough CJ, Xing G: Neurobiology of bipolar illness: implications for future study and therapeutics. Ann Clin Psychiatry 15(2):85–94, 2003 12938866
Purselle DC, Nemeroff CB: Serotonin transporter: a potential substrate in the biology of suicide. Neuropsychopharmacology 28(4):613–619, 2003 12655305
Rao H, Gillihan SJ, Wang J, et al: Genetic variation in serotonin transporter alters resting brain function in healthy individuals. Biol Psychiatry 62(6):600–606, 2007 17481593
Rauch SL, Whalen PJ, Shin LM, et al: Exaggerated amygdala response to masked facial stimuli in posttraumatic stress disorder: a functional MRI study. Biol Psychiatry 47(9):769–776, 2000 10812035
Ravina B, Eidelberg D, Ahlskog JE, et al: The role of radiotracer imaging in Parkinson disease. Neurology 64(2):208–215, 2005 15668415
Reivich M, Kuhl D, Wolf A, et al: The [18F] fluorodeoxyglucose method for the measurement of local cerebral glucose utilization in man. Circ Res 44(1):127–137, 1979 363301
Riva-Posse P, Choi KS, Holtzheimer PE, et al: Defining critical white matter pathways mediating successful subcallosal cingulate deep brain stimulation for treatment-resistant depression. Biol Psychiatry 76(12):963–969, 2014 24832866
Roffman JL, Marci CD, Glick DM, et al: Neuroimaging and the functional neuroanatomy of psychotherapy. Psychol Med 35(10):1385–1398, 2005 16164763
Roiser JP, Levy J, Fromm SJ, et al: The effects of tryptophan depletion on neural responses to emotional words in remitted depression. Biol Psychiatry 66(5):441–450, 2009 19539268
Rombouts SA, Barkhof F, Goekoop R, et al: Altered resting state networks in mild cognitive impairment and mild Alzheimer’s disease: an fMRI study. Hum Brain Mapp 26(4):231–239, 2005 15954139
Rowland LM, Bustillo JR, Mullins PG, et al: Effects of ketamine on anterior cingulate glutamate metabolism in healthy humans: a 4-T proton MRS study. Am J Psychiatry 162(2):394–396, 2005 15677610
Rusjan PM, Wilson AA, Bloomfield PM, et al: Quantitation of translocator protein binding in human brain with the novel radioligand [18F]-FEPPA and positron emission tomography. J Cereb Blood Flow Metab 31(8):1807–1816, 2011 21522163
Sacher J, Rabiner EA, Clark M, et al: Dynamic, adaptive changes in MAO-A binding after alterations in substrate availability: an in vivo [(11)C]-harmine positron emission tomography study. J Cereb Blood Flow Metab 32(3):443–446, 2012 22186668
Salvadore G, Cornwell BR, Colon-Rosario V, et al: Increased anterior cingulate cortical activity in response to fearful faces: a neurophysiological biomarker that predicts rapid antidepressant response to ketamine. Biol Psychiatry 65(4):289–295, 2009 18822408
Salvadore G, Cornwell BR, Sambataro F, et al: Anterior cingulate desynchronization and functional connectivity with the amygdala during a working memory task predict rapid antidepressant response to ketamine. Neuropsychopharmacology 35(7):1415–1422, 2010 20393460
Salvadore G, van der Veen JW, Zhang Y, et al: An investigation of amino-acid neurotransmitters as potential predictors of clinical improvement to ketamine in depression. Int J Neuropsychopharmacol 15(8):1063–1072, 2012 22040773
Sanacora G, Mason GF, Rothman DL, et al: Increased cortical GABA concentrations in depressed patients receiving ECT. Am J Psychiatry 160(3):577–579, 2003 12611844
Schweitzer JB, Lee DO, Hanford RB, et al: Effect of methylphenidate on executive functioning in adults with attention-deficit/hyperactivity disorder: normalization of behavior but not related brain activity. Biol Psychiatry 56(8):597–606, 2004 15476690
Seeley WW, Menon V, Schatzberg AF, et al: Dissociable intrinsic connectivity networks for salience processing and executive control. J Neurosci 27(9):2349–2356, 2007 17329432
Setiawan E, Wilson AA, Mizrahi R, et al: Role of translocator protein density, a marker of neuroinflammation, in the brain during major depressive episodes. JAMA Psychiatry 72(3):268–275, 2015 25629589
Sheline YI, Barch DM, Donnelly JM, et al: Increased amygdala response to masked emotional faces in depressed subjects resolves with antidepressant treatment: an fMRI study. Biol Psychiatry 50(9):651–658, 2001 11704071
Shin LM, Orr SP, Carson MA, et al: Regional cerebral blood flow in the amygdala and medial prefrontal cortex during traumatic imagery in male and female Vietnam veterans with PTSD. Arch Gen Psychiatry 61(2):168–176, 2004 14757593
Silverman DH, Cummings JL, Small GW, et al: Added clinical benefit of incorporating 2-deoxy-2-[18F]fluoro-D-glucose with positron emission tomography into the clinical evaluation of patients with cognitive impairment. Mol Imaging Biol 4(4):283–293, 2002 14537119
Small GW: Neuroimaging and genetic assessment for early diagnosis of Alzheimer’s disease. J Clin Psychiatry 57 (suppl 14):9–13, 1996 9024331
Small GW, Kepe V, Ercoli LM, et al: PET of brain amyloid and tau in mild cognitive impairment. N Engl J Med 355(25):2652–2663, 2006 17182990
Smart OL, Tiruvadi VR, Mayberg HS: Multimodal approaches to define network oscillations in depression. Biol Psychiatry 77(12):1061–1070, 2015 25681871
Stein MB, Simmons AN, Feinstein JS, Paulus MP: Increased amygdala and insula activation during emotion processing in anxiety-prone subjects. Am J Psychiatry 164(2):318–327, 2007 17267796
Stone JM, Dietrich C, Edden R, et al: Ketamine effects on brain GABA and glutamate levels with 1H-MRS: relationship to ketamine-induced psychopathology. Mol Psychiatry 17(7):664–665, 2012 22212598
Sui J, Castro E, He H, et al: Combination of FMRI-SMRI-EEG data improves discrimination of schizophrenia patients by ensemble feature selection. Conf Proc IEEE Eng Med Biol Soc 2014:3889–3892, 2014 25570841
Talbot PS, Laruelle M: The role of in vivo molecular imaging with PET and SPECT in the elucidation of psychiatric drug action and new drug development. Eur Neuropsychopharmacol 12(6):503–511, 2002 12468013
Taylor MJ, Tiangga ER, Mhuircheartaigh RN, Cowen PJ: Lack of effect of ketamine on cortical glutamate and glutamine in healthy volunteers: a proton magnetic resonance spectroscopy study. J Psychopharmacol 26(5):733–737, 2012 21616979
Taylor WD, Bae JN, MacFall JR, et al: Widespread effects of hyperintense lesions on cerebral white matter structure. AJR Am J Roentgenol 188(6):1695–1704, 2007 17515396
Thulborn KR, Waterton JC, Matthews PM, Radda GK: Oxygenation dependence of the transverse relaxation time of water protons in whole blood at high field. Biochim Biophys Acta 714(2):265–270, 1982 6275909
Tononi G, Edelman GM: Consciousness and complexity. Science 282(5395):1846–1851, 1998 9836628
Tucker DM, Luu P, Frishkoff G, et al: Frontolimbic response to negative feedback in clinical depression. J Abnorm Psychol 112(4):667–678, 2003 14674878
Turetsky BI, Colbath EA, Gur RE: P300 subcomponent abnormalities in schizophrenia, I: physiological evidence for gender and subtype specific differences in regional pathology. Biol Psychiatry 43(2): 84–96, 1998 9474441
Turkheimer FE, Rizzo G, Bloomfield PS, et al: The methodology of TSPO imaging with positron emission tomography. Biochem Soc Trans 43(4):586–592, 2015 26551697
Valentine GW, Mason GF, Gomez R, et al: The antidepressant effect of ketamine is not associated with changes in occipital amino acid neurotransmitter content as measured by [(1)H]-MRS. Psychiatry Res 191(2):122–127, 2011 21232924
Varela F, Lachaux JP, Rodriguez E, Martinerie J: The brainweb: phase synchronization and large-scale integration. Nat Rev Neurosci 2(4):229–239, 2001 11283746
Vlassenko AG, Benzinger TL, Morris JC: PET amyloid-beta imaging in preclinical Alzheimer’s disease. Biochim Biophys Acta 1822(3):370–379, 2012 22108203
Whalen PJ, Rauch SL, Etcoff NL, et al: Masked presentations of emotional facial expressions modulate amygdala activity without explicit knowledge. J Neurosci 18(1): 411–418, 1998 9412517
Whalen PJ, Shin LM, Somerville LH, et al: Functional neuroimaging studies of the amygdala in depression. Semin Clin Neuropsychiatry 7(4):234–242, 2002 12382206
Whitton AE, Treadway MT, Pizzagalli DA: Reward processing dysfunction in major depression, bipolar disorder and schizophrenia. Curr Opin Psychiatry 28(1):7–12, 2015 25415499
Wise RG, Tracey I: The role of fMRI in drug discovery. J Magn Reson Imaging 23(6):862–876, 2006 16649197
Woodward ND, Rogers B, Heckers S: Functional resting-state networks are differentially affected in schizophrenia. Schizophr Res 130(1–3):86–93, 2011 21458238
Yüksel C, Öngür D: Magnetic resonance spectroscopy studies of glutamate-related abnormalities in mood disorders. Biol Psychiatry 68(9):785–794, 2010 20728076
Zink CF, Pagnoni G, Chappelow J, et al: Human striatal activation reflects degree of stimulus saliency. Neuroimage 29(3):977–983, 2006 16153860
_____________
The authors wish to acknowledge the significant contribution made by Christine Heim, Ph.D., Guiseppe Pagnoni, Ph.D., and Greg Berns, M.D., Ph.D., in the preparation of the chapter in the previous edition of this Textbook.
Portions of this chapter are reprinted from Berns GS: “Functional Neuroimaging.” Life Sciences 65(24):2531–2540, 1999. Copyright 1999, Elsevier Science. Used with permission.