National Panel Studies Show Substantial Minorities Recording Long-Term Change in Life Satisfaction
Implications for Set Point Theory
Bruce Headey1, Ruud Muffels2 and Gert G. Wagner3, 1University of Melbourne, Melbourne, VIC, Australia, 2Tilburg University, Tilburg, the Netherlands, 3German Institute for Economic Research (DIW) and Max Planck Institute, Berlin, Germany
Set point theory can be directly tested only with panel datasets in which the life satisfaction/subjective well-being of adults has been measured repeatedly over a long period of time. Three long-running, high-quality panels are the German Socio-Economic Panel (GSOEP), the British Household Panel Survey (BHPS), and the Household, Income, and Labour Dynamics Survey in Australia (HILDA). Evidence from these panels shows that substantial minorities of adults have recorded long-term change in life satisfaction. Explanations for change relate primarily to life priorities and behavioral choices, not discrete life events. Relevant life priorities are a commitment to pro-social and family values. Relevant behavioral choices include choice of partner, a preferred work–leisure balance, active social and community participation, volunteering, regular exercise, and churchgoing. Set point theory has led to a focus on factors that stabilize life satisfaction. It is suggested that although a “weak” version of set point theory could perhaps be salvaged, it will be more productive in the future for researchers to focus on individual and public policy choices that can change life satisfaction.
Keywords
set point theory; life satisfaction; panel studies; life priorities; behavioral choices
The central proposition of set point theory is that adult life satisfaction is stable in the medium and long term. Proponents of set point theory accept that major life events can produce temporary fluctuations, but they hold that satisfaction usually reverts to set point within a year or two (Brickman & Campbell, 1971; Clark, Diener, Georgellis, & Lucas, 2004; 2008). A recent, thorough reassessment concluded that the only fairly common life event that has lasting effects in lowering life satisfaction is repeated or long-term unemployment (Clark et al., 2008). The sudden death of one’s child and the onset of disability or chronic illness in later years also have long-term negative effects (Lucas, 2007; Mehnert, Kraus, Nadler, & Boyd, 1990; Wortman & Silver, 1987). No discrete event has definitely been shown to improve satisfaction, although cosmetic surgery is a candidate (Frederick & Loewenstein, 1999; Wengle, 1986).
The aim of this chapter is to show that substantial minorities, but not majorities, of respondents in long-running German, British, and Australian household panel surveys have recorded large (not just statistically significant) long-term changes in life satisfaction. These three panels—the German Socio-Economic Panel Study (GSOEP), the British Household Panel Study (BHPS), and the Household Income and Labor Dynamics Australia Survey (HILDA)—are clearly among the best available datasets worldwide, because they permit direct tests of the stability of adult life satisfaction. So the results seriously undermine set point theory as usually understood.
It is important to realize that set point theory can be directly tested only with long-term panel data. Only by directly observing the life satisfaction of adults over a long period of time can researchers ascertain whether satisfaction really is stable. Until the GSOEP, BHPS, and HILDA became available, all the evidence for and against set point theory was indirect and inferential. Stability was inferred from links between life satisfaction and the stable, partly genetic personality traits of neuroticism and extroversion (Costa & McCrae, 1980). It has also been shown that stability is partly due to the influence of parental upbringing on the life satisfaction of children, including children who have long since left the parental home and partnered themselves (Aguche & Trommsdorff, 2010; Headey, Muffels, & Wagner, 2013).1 Stability has been inferred from evidence about adaptation to major life events (Brickman & Campbell, 1971; Headey & Wearing, 1989). In the special case of income gains, Easterlin (1974, 2005) suggested that adaptation was facilitated by social comparisons with the neighboring Joneses whose incomes were also going up. Finally, and apparently conclusively, stability was inferred from twin studies that estimated the genetic component of happiness at 40%–50%, based on comparisons of cross-sectional and over-time correlations in the happiness of monozygotic and dizygotic twins (Lykken, 1999; Lykken & Tellegen, 1996). However, as Huppert (2005) pointed out, Lykken and Tellegen’s twin studies could be interpreted as showing that even monozygotic twins have only moderately stable levels of happiness (correlation of 0.55 over a 9-year period).
A second aim of this chapter is to provide some preliminary explanations of change. The finding that most discrete life events do not produce lasting change has been taken as lending support to the view that set points are more or less fixed. We offer limited evidence to challenge this finding later. But even if it were accepted, it would still be a mistake—a non sequitur—to jump to the conclusion that because discrete life events do not produce change, then change does not happen. In this chapter, again using evidence mainly from the three national panels, we direct attention to variables other than life events, namely, life priorities and behavioral choices, that can change satisfaction. Relevant life priorities include a commitment to pro-social/altruistic values and family values rather than material values. Relevant behavioral choices include choice of partner (particularly the personality of one’s partner), active social and community participation, volunteering, a preferred work–leisure balance, regular exercise, and churchgoing.
A Crucial Definitional Issue: How to Define the Set Point?
Many subjective well-being (SWB) researchers have referred to a life satisfaction set point (or baseline) and asserted that it is stable, without actually providing an operational definition of the set point. What do we mean by the set point, and how can we assess whether an individual has deviated from his/her set point or remains at or close to it? A useful introspective exercise—or thought experiment—for SWB researchers is to ask themselves what their own set point is, responding on a 0–10 scale (because that is what survey respondents usually have to do). Having answered the initial question, they might then ask themselves why they think their set point is at the level it is. Finally, what evidence, if it turned up, would show that they did not really have a set point, or that it was at a different level from where they thought it was, that it had changed over the years, or that their explanation (or theory) about their own set point was incorrect?
The answers given by the SWB researchers might run like this:
I’m usually about 7 or 8 on a 0–10 Life Satisfaction scale. If you ask me on a normal day in a normal mood for year after consecutive year, 7 or 8 is what I would usually answer. I think the results would be pretty stable. Why do I think I score 7 or 8? It is mainly due to personality. How do I rate on the NEO personality inventory?2 I rate about average on the neuroticism trait, fairly high on extroversion, high on openness to experience, and about average on agreeableness and conscientiousness. Because neuroticism is negatively related to life satisfaction, while extroversion, agreeableness, and conscientiousness are positively related, and openness is unrelated, that gives me an overall rating on life satisfaction that is about average, or a bit above average.
This account suggests that operational measures of the set point could be based on either taking an average (or perhaps a weighted average) of each individual’s life satisfaction scores over a period of several consecutive years, or based on predictions of life satisfaction (e.g., regression predictions) made from ratings on personality traits.
These leads will be followed up in the next section. For now, let us continue the thought experiment and ask, “What evidence could confirm or falsify my theory about my own set point?”
One possibility is that repeated measures of my satisfaction would show large fluctuations, which did not appear to be around any stable mean. In that case, I would not really have a set point.3 Another possibility is that my results would be stable in most years but would occasionally fluctuate perhaps due to major life events. This would be in line with set point theory. A further possibility is that my results would be stable for several consecutive years, but then would change by a substantial amount (either upward or downward on the scale) and remain stable at their new level in subsequent years. From this evidence, we would conclude that my set point had changed. Still another possibility, regardless of whether my satisfaction ratings were stable or not, is that my personality theory would turn out to be false or weak. That is, my satisfaction ratings might be only weakly correlated with personality traits. This last inference would, of course, have to be based on interpersonal evidence, not just evidence about one person.
Operational Definitions
Plainly, debates about whether individual set points are stable or subject to change in the medium or long term cannot be resolved without precise working definitions. Before we suggest some reasonable definitions, it may be useful to mention one unsatisfactory definition that has been used or, more often, just implied in previous research. Researchers assessing the impact of life events have sometimes treated a single measure of life satisfaction as the “set point” prior to an event. Clearly, this is unsatisfactory because a single measure cannot possibly provide evidence about whether life satisfaction is stable, about whether it is, in any sense, “set.” In the context of assessing the effects of life events, a single measure is further confounded by the possibility that some events are anticipated by the individuals to whom they happen, with the result that life satisfaction changes prior to the event and not just afterward. Clark, Georgellis, Lucas, and Diener (2004) showed that anticipatory changes occur in relation to both marital separation and unemployment.
Two working definitions or measures of the life satisfaction set point are now suggested, together with criteria for assessing set point change:
1. Multiyear (e.g., 5-year) averages of life satisfaction. A multiyear average (mean) of individual life satisfaction ratings has the advantage of ironing out temporary fluctuations, which could be due to transient factors, including mood at time of interview. This approach to defining the set point has been used by previous SWB researchers (Fujita & Diener, 2005) and is similar to the approach taken by economists when they want a measure of “permanent” income. Ideally, one would wish to take medium-term (e.g., 5-year) averages, and this is what we do in analyzing data from the GSOEP survey, which has run for more than 25 years. In analyzing the BHPS and HILDA surveys, which have not been running for as long, we use 3-year averages.
2. How to assess whether a person’s set point has changed? One possibility would be to regard any statistically significant change (e.g., at the 0.001 level) between one 5-year period and a later period as indicative of set point change. Alternatively, as is done here, one might adopt a more stringent criterion, requiring individual changes of more than 25, 33.3, or 50 percentiles within the life satisfaction distribution in order to infer that a set point change had occurred.
3. Set point predicted by personality traits. An alternative idea is that set points are a function of personality, so one would expect a person’s life satisfaction scores to fluctuate around the level predicted by his or her personality traits. Following this approach, initial or baseline set points can be estimated as the satisfaction scores that respondents are predicted to get in a baseline period on the basis of their scores on the NEO-AC personality traits. Possible changes in individual set points can then be viewed as the difference between predicted scores in the baseline period and actual scores in later 5-year periods.
The German (GSOEP), British (BHPS), and Australian (HILDA) Household Panel Surveys
The German (GSOEP) panel is the longest running of these national household panels. It began in 1984 in West Germany with a sample of 12,541 respondents (Wagner, Frick, & Schupp, 2007). Interviews have been conducted annually ever since. Everyone in sample households aged 16 and over is interviewed. The cross-sectional representativeness of the panel is maintained by interviewing “split-offs” and their new families. So when a young person leaves home (“splits off ”) to marry and set up a new family, the entire new family becomes part of the panel. The sample was extended to East Germany in 1990, shortly after the Berlin Wall came down, and since then has also been boosted by the addition of new immigrant samples, a special sample of the rich, and recruitment of new respondents partly to increase numbers in “policy groups.” There are now more than 60,000 respondents on file, including some grandchildren as well as children of the original respondents. The main topics covered in the annual questionnaire are family, income, and labor force dynamics. A question on life satisfaction has been included every year.
The British (BHPS) panel was launched in 1991 with about 10,300 individuals in 5,500 households (Lynn, 2006). However, a question about life satisfaction was not included until 1996, so in this chapter, only 1996–2010 data are used. As in Germany, all individuals in the household aged 16 and over are interviewed. Again, sample representativeness is maintained by including split-offs and their new households. The British panel has been augmented by booster samples for Scotland and Wales in 1991 and a new Northern Ireland sample in 2001. A major change occurred in 2010 when the panel was merged into the new United Kingdom Household Longitudinal Study (“Understanding Society”), which has a much larger sample and many additional questions, especially in the health area. Only data provided by the original panel members are analyzed here.
The Australian (HILDA) panel began in 2001 with a sample of 13,969 individuals in about 7,700 households (Watson & Wooden, 2004). Interviews were achieved in 61% of in-scope households. In the Australian panel, all household members aged 15 and over are interviewed. Following rules similar to the Germans and British, individuals who split off from their original households continue in the panel, and members of their new households join it. In 2009 (the latest year of data used), interviews were conducted with 13,301 individuals in 7,234 households.
For this chapter, the sample in each country is restricted to prime age adults, defined as those aged 25 to 69. The aim is to restrict analysis to mature-age individuals who, according to set point theory, should have stable levels of life satisfaction. The lower age limit excludes younger individuals whose personalities may still be changing. The top limit excludes senior citizens whose life satisfaction, in some cases, will be declining due to declining health (Gerstorf et al., 2010).
Measures
The research teams that run the three panels have developed slightly differing measures for most concepts used in this chapter. However, despite differences of language, question wording, and response scales, nearly all results replicate across the three countries.
We first describe how the dependent variable, life satisfaction, is measured in the three panels. Then we describe explanatory variables used here to account for medium- and long-term change in life satisfaction.
The Dependent/Outcome Variable: Life Satisfaction
In the German and Australian panels, life satisfaction is measured on a 0–10 scale (German mean=7.0, standard deviation=1.8; Australian mean=7.8, SD=1.5). A response of 0 means “totally dissatisfied,” and 10 means “totally satisfied.” In Britain, a 1–7 scale is used (mean=5.2, SD=1.2).
Single-item measures of life satisfaction are plainly not as reliable or valid as multi-item measures, but are widely used in international surveys and have been reviewed as acceptably reliable and valid (Diener, Suh, Lucas, & Smith, 1999; Lucas & Donnellan, 2007).
Explanatory Variables
The explanatory variables included in the analyses that follow are life priorities, self and partner personality traits, social participation, the balance between work and leisure (work-life balance), physical exercise, and churchgoing.
Personality Traits of Self and Partner
In 2005, the research teams running the three panels all included a full set of personality measures for the first time. The chosen instrument in each country was a short version of the NEO (Costa & McCrae, 1991). The British and German panels included very short versions of the five scales—just three items/questions to measure each trait—which are reported to be satisfactorily reliable and to correlate highly with longer versions of the NEO preferred by psychologists (Gerlitz & Schupp, 2005).4 The Australian panel included seven items per trait (Saucier, 1994).
Psychologists usually take the view that personality is about 40%–50% hereditary and quite stable, at least from the age of about 25 or 30 onward (Roberts, Walton, & Viechtbauer, 2006). It should be stressed that, by including personality traits measured in 2005 on the right side of equations to account for life satisfaction in earlier as well as later years, we are, in effect, assuming that personality is completely stable. If it were completely stable, then, of course, it would not matter when it was measured. However, the assumption may not be entirely correct. It has been suggested that ratings on personality traits may be changed to a moderate degree by life experiences such as having a stable marriage or an absorbing job (Roberts et al., 2006; Scollon & Diener, 2006).
Life Priorities, Goals, or Values
SWB researchers are understandably keen to measure what are variously termed life priorities or goals or values. However, it has proved difficult to obtain valid measures. In a very thorough investigation, two pioneers of SWB research, Andrews and Withey (1976), reported that measures of the priority attached to goals, asked on scales running from “very important” to “not at all important,” appeared to suffer from social desirability bias, with respondents all giving high ratings to family goals. Importance scores also had low test–retest reliability. A further possible problem was that importance scores and satisfaction scores in most life domains turned out to be moderately correlated. This might mean that people were quite good at getting what they wanted from life—a result in line with economists’ utility maximization assumption—or might suggest some reverse causation, with respondents tending to attribute importance to domains they were already well satisfied with, perhaps as a psychological mechanism to boost their overall life satisfaction (Andrews & Withey, 1976). In general, respondents whose life satisfaction was high tended to rate most domains as very important, whereas unhappy or depressed respondents tended (presumably as a consequence of unhappiness) to rate most domains as relatively unimportant. An underlying problem, which may partly account for measurement difficulties, is that most people are not of a philosophical bent and do not regularly think about their life priorities.
The German panel group decided to tackle these issues afresh and appears to have made considerable improvements in life priorities/goals/values measurement. Their approach is based on a classification initially developed by Kluckhohn and Strodtbeck (1961). Kluckhohn and Strodtbeck set out to measure three sets of life priorities:
• Material priorities and career success
• Family priorities: marriage, children, and the home
• Pro-social or altruistic priorities: friendship, helping others, social and political activism
Using this framework, the German research group developed survey items that have a stable factor structure and adequate test–retest reliability (Headey, 2008; Wagner et al., 2007). Life priorities have been measured intermittently (rather than annually) in GSOEP, starting in 1990. The specific questions asked in different waves of the survey have varied somewhat; here, we use data from the 1990, 1992, 1995, 2004, and 2008 surveys in which the questions were nearly identical. In these surveys 9 or 10 items were included,5 all asked on a 1–4 scale running from “very important” to “not at all important.” In each wave, the items formed three distinct, replicating factors: a material priorities factor, a family priorities factor, and a pro-social or altruistic priorities factor (Headey, 2008).
A material priorities index was constructed that gave equal weight to “being able to buy things” and “success in your job.” Similarly a family priorities index gave equal weight to items relating to the importance of marriage and children. Finally, the pro-social/altruistic priorities index gave equal weight to “being involved in social and political activities” and “helping other people.”
The Australian panel has included questions on life priorities only once (2001), and the British panel only twice (1998, 2003). Rather than follow the German panel approach of measuring priorities according to an a priori classification, these two research teams reverted to the earlier approach of presenting respondents with a rather miscellaneous list, which nevertheless overlapped substantially with the German list. Here, we analyze only priorities included in all three surveys, because a subsidiary aim of this chapter is to assess the extent to which degrees of change in life satisfaction and in the factors causing life satisfaction replicate cross-nationally.
In the British panel, questions were asked on a 1–10 scale (“not at all important” to “very important”). Respondents rated the importance of “money” (material priority), “a good partnership” and “having children” (family priorities), and “good friends” (friendship priority, but without a community participation aspect). In the Australian survey, questions were included about the various priorities on a 0–10 scale (“not at all important” to “very important”). Key items related to the importance of “your family” (family priority) and “involvement in your local community” (community priority but without a friendship aspect). The question intended to tap material priorities was somewhat ambiguous. Respondents rated the importance of “your financial situation.” This item could have assessed the extent to which respondents were concerned or worried about their financial situation, rather than, or as well as, the priority they attached to material success.
We have not attempted to assess the effects of changes in life priorities in this chapter. Because the questions have been asked only once in Australia, twice in Britain, and intermittently in Germany, the data are not really suited to analysis of change. Instead, we have averaged respondents’ scores on priorities for the waves in which they participated.
Behavioral Choices: Partner Personality Traits, Social Participation, the Work–Leisure Trade-off, Regular Exercise, and ChurchGoing
Choice of Partner—Especially His/Her Personality Traits
It comes as no surprise that a person’s choice of partner can have an effect on his or her own life satisfaction. In all three panels, both partners in sample households are interviewed. In this chapter, we hypothesize that one partner’s personality traits can influence the other partner’s satisfaction, over and above the influence of his or her own traits. Because neuroticism is the NEO-AC trait most strongly (negatively) related to life satisfaction, we hypothesize that partner neuroticism will affect one’s own satisfaction.
Active Social and Community Participation
The three panel surveys differ somewhat in how they measure participation in social activities. In the Australian panel, respondents are asked a single question about how frequently they meet with “friends and relatives.” The response scale runs from 1 (every day) to 7 (less than every 3 months).6 In the British panel, there are two separate items, one relating to frequency of “meeting with friends and relatives” and one to frequency of “talking with neighbors.” These questions are asked on a response scale running from “on many days” (code 1) to “never” (code 5). For present purposes, these highly correlated items have been combined into a social participation index. In the German panel, the social participation index used here combines two correlated items about frequency of “meeting with friends, relatives or neighbors” and “helping out friends, relatives or neighbors.”7 The response scale has just three points: “every week,” “every month,” and “seldom or never.”8
An advantage is that the social participation questions have been asked every year in all three panels, so it is possible to analyze the effects on life satisfaction of changes in participation levels.
The Work–Leisure Trade-off: Preferred and Actual Working Hours
The trade-off between paid work and leisure is central to welfare economics. Welfare economists assume that leisure is pleasurable, whereas work is less pleasurable but necessary to pay for consumption (Little, 2002). It is further assumed that the balance that individuals (and households) choose between work and leisure reflects the priority they attach to consumption versus leisure. The validity of this last assumption has rarely been directly tested, but the panel datasets make a rough test possible.
Respondents in the Australian and German panels are asked both how many hours per week they actually work (in all jobs combined, if they have more than one job) and how many they would prefer to work. The gap between these two figures can be treated as a rough measure of the degree to which they are achieving their preferred trade-off/choice between work and leisure. Here, we classify individuals whose actual working time is within 3 hours of their preferred time as having their preferences met. We treat those who work over 3 hours more than they want as “overworked,” and those who work over 3 hours less than they want as “underworked.” Other hours “gaps” were tested, but the 3-hour variables showed the highest correlation with life satisfaction.
In the British panel, respondents are asked how many hours they work (in all jobs combined), and whether they would prefer to work more hours than they do now, fewer, or the same. They are not asked precisely how many hours they would prefer to work, so designating them as “overworked,” “underworked,” or having their preferences met is a somewhat cruder exercise than in the Australian and German panels.
Because questions about preferred working hours are asked every year in all three panels, we can assess the extent to which changes in work–leisure balance are associated with changes in life satisfaction.
Regular Exercise
In all three panels, a single question has been asked repeatedly (but not in the British survey annually) about participation in sports and/or exercise. Again, questions differ slightly. In the Australian panel, respondents are asked about how frequently they take moderate or intensive physical activity lasting for at least 30 minutes. The response scale runs from 0 (“not at all”) to 5 (“every day”). In the British panel, a question is asked every 2 years about how often respondents walk, swim, or play sports. The 5-point response scale runs from “at least once a week” to “never/almost never.” Finally, in the German dataset, there is an annual question about participation in active sports or exercise. The 1–4 response scale runs from “almost never” to “at least once a week.”
Churchgoing
Many previous research papers have noted the positive cross-sectional association between churchgoing and/or religious belief and life satisfaction (for a recent review, see Myers, 2013). Using the German data, we can go further and estimate whether changes in churchgoing are associated with medium-term gains and losses of life satisfaction. (In the other two panels, questions on churchgoing have been asked only intermittently, so analysis of change is less feasible.)
Analysis of Change Based on Moving 5-Year or 3-Year Averages of Life Satisfaction
In this chapter, one of our aims is to offer some preliminary explanations of medium- and long-term change in life satisfaction. For reasons already explained, it makes no sense for this purpose to use single-year measures of satisfaction. For Germany, we used 5-year moving averages of life satisfaction (1984–1988, 1985–1989, 1986–1990, and so on).9 For the shorter Australian and British panels, which are available only for 9 and 12 years, respectively, it was infeasible to use 5-year blocks, so we settled for 3-year moving averages.10
In summary, all analyses in the paper that are concerned with explaining change are based on 5- or 3-year moving averages of life satisfaction ratings. We then use annual measures of independent (explanatory) variables in trying to account for medium-term change in life satisfaction.
It should be noted that values for some variables that were not included in every wave of the panel surveys have been imputed. Oddly, the life satisfaction question was omitted from the British survey in 2001 and 2009. We simply averaged results for the years immediately before and after the missing years to obtain imputations. More importantly, the NEO-AC has been asked only once in each panel (in 2005), so we needed to assume that personality is stable and impute it for all other years. Not to have done so would have voided all longitudinal analyses.
In any panel survey, what are called “panel conditioning effects” are a possible source of bias. That is, panel members might tend to change their answers over time—and answer differently from the way nonpanel members would answer—as a consequence just of being panel members. In all three panels, there is some evidence that panel members, in their first few years of responding, tend to report higher life satisfaction scores than when they have been in the panel for a good many years (Frijters, Haisken-DeNew, & Shields, 2004). This could be due to “social desirability bias”—a desire to look good and appear to be a happy person, which is stronger in the first few years of responding than in later years. Or it could be due to a “learning effect”—learning to use the middle points of the 0–10 or 1–7 scale rather than the extremes and particularly the top end.
To compensate for these possible sources of bias, we included in all equations a variable that measured the number of years in which each panel member had already responded to survey questions.
Results
Set Point Theory: Is Life Satisfaction Really Stable?
We now use evidence from the three national panel studies to assess whether life satisfaction really is stable in the medium and long term. Tables 6.1, 6.2, and 6.3 give results for “balanced panels” of adults aged 25 to 69 in, respectively, Germany, Britain, and Australia. The “balanced panels” comprise respondents who reported their life satisfaction in every year of the survey to date. It should be noted that use of balanced panels, although essential for the analysis here, greatly reduces sample sizes. The German balanced panel comprises 1,110 respondents and is restricted to those who were living in West Germany in the 1980s when the survey began. The British and Australian balanced panels number 2,102 and 5,536, respectively. Longitudinal weights, provided by the survey managers, are used in an attempt to correct for this panel size reduction, but the representativeness of the remaining panel must be in some doubt (further discussion later).
Table 6.1
Germany (GSOEP)
Long-term Change in the Life Satisfaction (LS) Set Points of Adults Aged 25–69: Alternative Measuresa
| Life Satisfaction Scale (0–10) | Measure 1 5-Year Means: Change in LS between 1984–1988 and 2004–2008, % of Sample | Measure 2 Personality: Difference between Personality Prediction of LS 2004–2008 and Actual LS 1984–1988, % of Sample |
| Change of 25 percentiles or more | ||
| upward | 18.7 | 25.7 |
| downward | 19.7 | 24.2 |
| total | 38.4 | 49.9 |
| Change of 33.3 percentiles or more | ||
| upward | 11.8 | 19.1 |
| downward | 13.5 | 18.6 |
| total | 25.3 | 37.7 |
| Change of 50 percentiles or more | ||
| upward | 4.7 | 9.0 |
| downward | 7.4 | 10.0 |
| total | 12.1 | 19.0 |
aSource: GSOEP 1984–2008: A balanced panel of respondents aged 25–69 who reported life satisfaction each year in 1984–2008 (N=1,110). Results are weighted, using a 1984–2008 longitudinal weight.
Table 6.2
Britain (BHPS) Long-Term Change in the Life Satisfaction (LS) Set Points of Adults 25–69: Alternative Measuresa
| Life Satisfaction Scale (1–7) | Measure 1 3-Year Means: Change in LS Between 1996–1998 and 2008–2010, % of Sample | Measure 2 Personality: Difference Between Personality Prediction of LS 2008–2010 and Actual LS 1996–1998, % of Sample |
| Change of 25 percentiles or more | ||
| upward | 16.1 | 24.1 |
| downward | 16.7 | 21.4 |
| total | 32.8 | 45.5 |
| Change of 33.3 percentiles or more | ||
| upward | 10.3 | 17.3 |
| downward | 10.4 | 15.0 |
| total | 20.7 | 32.3 |
| Change of 50 percentiles or more | ||
| upward | 3.2 | 8.3 |
| downward | 5.5 | 7.7 |
| total | 8.7 | 16.0 |
aSource: BHPS 1996–2010: A balanced panel of respondents aged 25–69 who reported life satisfaction each year in 1996–2010 (N=2,102). Results are weighted, using a 1996–2010 longitudinal weight.
Table 6.3
Australia (HILDA)
Long-Term Change in the Life Satisfaction (LS) Set Points of Adults 25–69: Alternative Measuresa
| Life Satisfaction Scale (0–10) | Measure 1 3-Year Means: Change in LS between 2001–2003 and 2007–2009, % of Sample | Measure 2 Personality: Difference between Personality Prediction of LS 2007–2009 and Actual LS 2001–2003, % of Sample |
| Change of 25 percentiles or more | ||
| upward | 13.4 | 21.5 |
| downward | 13.0 | 19.8 |
| total | 26.4 | 41.3 |
| Change of 33.3 percentiles or more | ||
| upward | 8.5 | 15.5 |
| downward | 7.5 | 13.8 |
| total | 16.0 | 29.3 |
| Change of 50 percentiles or more | ||
| upward | 3.3 | 7.6 |
| downward | 3.3 | 6.5 |
| total | 6.6 | 14.1 |
aSource: HILDA 2001–2009: A balanced panel of respondents who reported life satisfaction each year in 2001–2009 (N=5,536). Results are weighted, using a 2001–2009 longitudinal weight.
The first column in each table reports results for the first of our alternative measures of the set point, namely, multiyear means of life satisfaction. The second column gives results for set points defined as predictions, or really postdictions, based on the NEO personality traits. The reason for using postdictions, rather than predictions, is that in each of the national questionnaires the NEO was included only toward the end of the survey periods covered here. It therefore makes sense to make our initial regression predictions for the periods in which the personality inventory was actually included and then postdict (rather than predict) life satisfaction for earlier periods. For example, in the German case, we “predicted” each person’s life satisfaction for 2004–2008 on the basis of NEO measures taken in 2005, and then compared these results with actual life satisfaction scores for the 1984–1988 period.
Because our aim is to estimate long-term change, Tables 6.1 to 6.3 deal with changes in life satisfaction for the longest available period in each country. For example, for Germany, the table reports changes occurring between 1984 and 1988 (the first 5-year period) and between 2004 and 2008, the latest 5-year period for which data are available.
It is clear that, whichever operational measure of the set point is used, substantial minorities—but not majorities—in all three countries must be assessed as having recorded large (and not merely statistically significant) changes in their life satisfaction set points. In Germany, the country for which we have the longest period of evidence, the multiyear mean measure (measure 1 in Table 6.1), indicates that 38.4% of the panel recorded changes that moved them 25 percentiles or more up or down the life satisfaction distribution between the baseline period of 1984–1988 and 2004–2008. Just over a quarter, 25.3%, recorded changes that moved them up or down by 33.3 percentiles or more, and 12.1% moved by 50 percentiles or more (e.g., from above the 75th percentile to the 25th percentile or below).
The percentages of respondents reporting substantial degrees of change in life satisfaction in Britain and Australia appear lower at first reading, but the reason is only that shorter time periods are involved: 12 years for Britain and 9 for Australia, compared with 25 for Germany. Table A6.1 in Appendix 6.1 provides more detailed evidence for Germany, showing percentages reporting substantial change in each successive 5-year period after the baseline period of 1984–1988. A comparison of results in this table with the British and Australian results in Tables 6.2 and 6.3 makes it clear that the degrees of change in all three countries are about the same for any given time period.
Personality postdictions of life satisfaction are quite weak for all three countries. The NEO personality measures included in these surveys account for only a moderate amount of variance in satisfaction: 13.4% in Germany, 16.4% in Britain, and 11.9% in Australia. If we were to rely on this approach to measuring the set point, then we would have to conclude that very large minorities change their set points in each country. We would have to say that in Germany 49.9% changed by 25 percentiles or more, 37.7% changed by 33.3 percentiles, and 19.0% changed by 50 percentiles or more.
It seems reasonable to infer that personality postdictions of life satisfaction provide less satisfactory measures of the set point than multiyear means. Psychologists would rightly point out that, if longer and more valid versions of the NEO scales had been used, the variance accounted for would have been somewhat greater. However, reviews of the evidence have generally concluded that, even when personality traits are measured with long and well-validated questionnaires, they account for only moderate amounts of variance in life satisfaction (Lucas, 2008). It seems certain that stable personality traits help to stabilize satisfaction ratings over time, but they do not account for a great deal of inter-person variance.
In all three countries, the longer the time period that elapses, the more respondents report levels of life satisfaction that are substantially changed from their baseline measure. This is best appreciated with correlational data. In Germany, the correlation between Life Satisfaction 1984–1988 and Life Satisfaction 1989–1993 was 0.70. Later, 5-year correlations with the 1984–1988 baseline result were 0.54 (for 1994–1998), 0.47 (for 1999–2003), and 0.45 (for 2004–2008). These declining correlations show a pattern of change typical of any longitudinal, attitudinal dataset. However, they run counter to set point theory as usually understood.
Possible Concerns and Sensitivity Analysis
It could be argued that the balanced panels used in these tables may be unrepresentative of the three national populations. This is certainly a possibility. Respondents who remain in panels for a long time may well be different in some respects from people who drop out. However, experienced survey researchers know that the hardest people to retain in any survey are the young, those who move from house to house a lot, and those whose lives undergo major changes (e.g., marital separation, unemployment, and extended job search). People whose lives are less subject to change are more likely to remain in panels. This makes it likely that, if there is any selection bias in our balanced panels, it is toward people whose lives have been relatively stable and who may therefore be less (not more) likely than others to record large changes in life satisfaction.
Using the longer-running German panel, we performed a number of sensitivity analyses to see if serious variations in results were found, compared with what is reported in Table 6.1. Instead of taking the mean of each 5-year period to measure changes in life satisfaction, we took the median. This made virtually no difference. Nor did analysis based on removing apparent outlying scores (one or two outliers) in each 5-year period.
Finally, and at the cost of further reducing the size of the balanced panel, we removed all respondents to whom major life events happened in either or both of 1984–1988 and 2004–2008. We then reanalyzed changes in life satisfaction for this 25-year period. The reason for doing this was that it could be argued that one cannot get a valid reading of a person’s set point in a period just before, during, or just after a major life event. The life events that led to removals from the panel were as follows: got married/partnered, child born, separated or divorced, partner died, became unemployed, own business failed, real disposable income changed by more than 20% in the past year, became seriously disabled, and went to the doctor 25 times or more in the past year. Of course, this is by no means a full list of major life events, but it reflects what is available in the GSOEP. Again, the reanalyzed results showed degrees of change little different from what is reported in Table 6.1 (for more detail, see Headey, 2010).
Explaining Medium- and Long-Term Change in Life Satisfaction: Life Priorities and Behavioral Choices
As previously mentioned, one persistent finding that has bolstered set point theory is that most life events appear not to cause medium- or long-term changes in life satisfaction. SWB researchers have tended to draw the conclusion that, if even major events have no lasting impact, then medium- and long-term life satisfaction “must” be stable. In the next few sections, we summarize relatively new lines of research that show that choices about life priorities (values, goals) can change medium-term life satisfaction, as can behavioral choices relating to one’s partner, work–leisure balance, social participation, physical exercise, and churchgoing. Recall that by medium-term life satisfaction, we mean 3- or 5-year moving averages.
Life Priorities, Values, or Goals
Several papers have reported that giving top priority to material goals/values is inimical to happiness (Diener & Fujita, 1995; Diener & Seligman, 2004; Kasser & Kanner, 2004; Nickerson, Schwarz, Diener, & Kahneman, 2003). Experimental and survey evidence indicates that people who spend more money on others and relatively less on themselves have higher life satisfaction (Dunn, Aknin, & Norton, 2008). Headey, Muffels, and Wagner (2011), analyzing data from the three national panel studies, reported that individuals who give relatively high priority to pro-social, altruistic goals and also family goals and lower priority to material and career goals have higher life satisfaction and that these differences persist over time (see also Emmons, 1986). The results held, controlling for the effects of personality traits. Several studies have indicated that volunteering, engaging in altruistic community activities, and repeatedly carrying out “good deeds” are associated with higher subjective well-being (Harlow & Cantor, 1996; Lyubomirsky, 2008; Thoits & Hewitt, 2001).
In trying to explain why people who give priority to pro-social/altruistic and family goals appear more satisfied than those who prioritize material and career goals, Headey (2008) suggested that a key distinction may lie between zero sum and nonzero sum goals.11 Generally speaking, material and career goals (also status goals) are zero sum. They can be pursued only at the expense of someone else: “my gain is your loss.” It follows that there are bound to be many losers and that almost all those who win in round 1 will lose in round 2 or later rounds. So, on average and for most people, prioritizing zero sum goals may turn out to be a recipe for disappointment rather than life satisfaction. By contrast, family goals and pro-social goals are generally (although not necessarily) nonzero sum. If family relationships improve, or pro-social goals are achieved, everyone can be better off; there do not have to be any losers.
Behavioral Choices
A diverse set of behavioral choices, which also appear to have nonzero sum implications, are associated with higher levels of life satisfaction.
Choice of Partner
One key choice, unsurprisingly, is choice of partner. Again using data from the three national panels, Headey et al. (2011) showed that individuals who choose (or are chosen by) partners who rate high on the personality trait of neuroticism have lower life satisfaction than those whose partners are more emotionally stable. This finding held net of (controlling for) a person’s own personality traits. Furthermore, differences in life satisfaction due to partner neuroticism persisted even after more than 20 years of marriage, indicating the very long-term effects of choice of partner (Headey, Muffels, & Wagner, 2010). Partner neuroticism has long been known to have damaging effects on marital satisfaction (Robins, Caspi, & Moffitt, 2000), so it is plausible that life satisfaction is affected as well. It is also clear that the marital satisfaction and life satisfaction of partners are quite highly correlated, although their satisfaction levels do not become more similar over time (Schimmack & Lucas, 2010).
The evidence that partner neuroticism matters to one’s own life satisfaction should probably lead to a reinterpretation of the finding that getting married/partnered is one of those life events that produces only a temporary change (usually a gain) in life satisfaction, but that the long-term effect is zero (Campbell, Converse, & Rodgers, 1976; Clark et al., 2008; Lucas, Clark, Georgellis, & Diener 2003). The evidence is that individuals who marry/partner someone who is more neurotic than average will record a long-term loss of life satisfaction, whereas those who marry someone who is more emotionally stable than average will record a long-term gain. Because about 50% of people are likely to fall into both camps, the finding that, on average, getting married makes no long-term difference to life satisfaction makes arithmetic sense but is seriously misleading.12
Work–Leisure Balance
Headey et al. (2010, 2011) attempted to test the validity of the welfare economist’s assumption that a key trade-off affecting utility lies between work (benefit: more consumption) and leisure (benefit: more pleasure). Until quite recently, most economists denied the validity of interpersonal measures and, hence, comparisons of utility, but some are now accepting that standard life satisfaction scales are adequately reliable and valid (Frey & Stutzer, 2002).
Headey et al. (2010, 2011) reported that people who are able to arrange their lives so that they work within plus or minus 3 hours of their preferred working time have higher life satisfaction than those who work longer than they want or less than they want. The relationship between “work–leisure balance” and life satisfaction held in Germany, Britain, and Australia, net of controls for personality traits, life priorities, and standard socioeconomic variables. Further, panel regression fixed effects analyses showed that changes over time in “work-life balance” were associated with changes in life satisfaction.13
Active Social Participation and Volunteering
A matter of individual choice, which has nonzero sum implications, is the extent to which one spends leisure time participating in social and community activities. There is abundant evidence that individuals with richer social networks or more social capital enjoy greater life satisfaction (Argyle, 2001; Bradburn, 1969; Harlow & Cantor, 1996; Putnam, 2000). The three national panel datasets go beyond measuring static social networks and provide annual measures of frequency of social interaction with friends, relatives, and neighbors. In all three national panels, it was found that respondents who reported high levels of interaction were more satisfied with life than those who were less sociable (Headey et al., 2011). Again, fixed effects analysis indicated that changes over time in social activity were associated with changing levels of life satisfaction. These findings held good, net of the effects of personality traits and life priorities/values.
Somewhat related to active social and community participation is volunteering. This is also usually found to be associated with higher levels of life satisfaction (Thoits & Hewitt, 2001). The result holds using fixed effects models of the German and British but not the Australian national panel data (Headey et al., 2011).
Regular Exercise
The health domain is also nonzero sum; plainly, gains to one’s health are unlikely to be associated with consequent losses to anybody else’s health. Further, adopting a healthy lifestyle is, for most Western people, a matter of relatively free choice. A great deal of previous research has been concerned with the impact of exercise, body-mass index, and other lifestyle variables on health rather than life satisfaction. Reviews of the evidence relating to life satisfaction have generally suggested positive relationships, but with an important “reverse causation” caveat, namely, that people who are happier in the first place may choose more exercise and a healthier diet (Argyle, 2001; Diener & Biswas-Diener, 2008).
The only “healthy lifestyle” measure that has been included annually in the three national panels relates to frequency of taking exercise or participating in sports. In all three countries, frequent exercise is associated with higher life satisfaction, and changes in frequency are associated with changes in satisfaction (Headey et al., 2011). These relationships hold net of personality traits and life priorities/values. The panel analysis fixed effects approach does not rule out the possibility of some reverse causation, but a more plausible interpretation (it is suggested) is that personality traits are causally antecedent and affect both choice of lifestyle and life satisfaction.
Churchgoing
As previously mentioned, many researchers have reported a positive cross-sectional relationship between life satisfaction and churchgoing. However, as with many cross-sectional relationships, doubts have been expressed about whether the relationship is causal. In the German panel, churchgoing has been measured at regular intervals, so we can take one more step toward establishing causation by seeing whether changes in frequency of church attendance are associated with changes in life satisfaction. It turns out that they are. Headey, Schupp, Tucci, and Wagner (2010) found that individuals who increased their church attendance also recorded increases in satisfaction, whereas those whose attendance declined recorded declines in satisfaction. Results held net of the effects of personality traits and standard socioeconomic variables.14 It should also be mentioned that regular churchgoers have several other characteristics that contribute to life satisfaction. They give relatively high priority to altruistic and family values, and lower priority to material values, than infrequent or nonchurchgoers. They also spend more time on volunteering and charitable activities than nonchurchgoers.
Do Some People’s Personality Traits Predispose Them to Gains or Losses of Life Satisfaction?
This section has been mostly about choices that can change life satisfaction. Clearly, one’s own personality traits are scarcely a matter of personal choice, and it might be thought that, because adult personality is more or less stable, it could not be associated with change in life satisfaction. There is, however, some evidence that extroverted people may be predisposed toward gains in life satisfaction, while relatively neurotic people may be predisposed toward losses. It is known that extroverts are more likely than average to experience positive life events (e.g., job promotion), whereas neurotic people are more likely than average to experience adverse events (e.g., job loss) (Headey & Wearing, 1989; Magnus, Diener, Fujita, & Pavot, 1993). Further, it has been shown that when positive events happen to extroverts, they extract more satisfaction than others (Larsen & Ketelaar, 1991; Lucas & Baird, 2004). Similarly, relatively neurotic individuals experience more negative affect than average in the face of adverse events (Larsen, 1992). Could it be that, by repeatedly extracting more satisfaction than average from positive events, some extroverts register lasting gains in life satisfaction? Similarly, is it possible that some neurotic individuals register lasting losses of life satisfaction as a result of repeatedly experiencing worse than average reactions to adverse events (Huppert, 2005)? Headey (2010) found some panel evidence to support both of these conjectures. It does appear that extroverts are somewhat more likely than others to record long-term gains in life satisfaction and that neurotic people are likely to record long-term losses (see also Scollon & Diener, 2006). There is no direct evidence, however, about which specific life events or sequences of events trigger these gains and losses of life satisfaction.
In short, it does seem possible that some people’s personality traits predispose them to changes in life satisfaction. This inference is tentative, however, not only because the specific events that may bring about change are unclear, but also because the evidence implies a logical consequence that is perhaps implausible. The logical consequence is that some extroverts must be repeatedly increasing their life satisfaction, and some neurotic individuals must be in repeated decline. This is not impossible but seems somewhat implausible.
Conclusions
The best, most direct way to test set point theory is to measure degrees of change in adult life satisfaction (subjective well-being) in national representative panel surveys. The three most readily available panels are the GSOEP, BHPS, and HILDA. In these panels, large minorities, although not majorities, have recorded substantial and apparently lasting changes in life satisfaction. Germany, Britain, and Australia are fairly affluent, stable Western countries. It is quite likely that more change will be found (if and) when evidence becomes available from poorer countries that have experienced wars in recent times or more serious social, economic, and political crises.
Until long-term panel data became available, it was reasonable to claim that the balance of evidence was in favor of set point theory. It was also the case that, until fairly recently, there was little convincing evidence about causes of change in life satisfaction. Most major life events appeared to produce only temporary fluctuations, with reversion to set point being the norm. However, in the past decade or so, evidence has slowly accumulated that indicates that changes in life satisfaction can be partly explained by differing life priorities (values, goals) and behavioral choices. Evidence from fixed effects panel regressions is, perhaps, particularly convincing in showing that when individuals change their choices, then changes also occur in life satisfaction. Recall that, in this type of regression, the effects of all factors that are constant over time (e.g., family background, personality traits), whether measured or unmeasured, are automatically removed. Fixed effects results show that choices relating to active social participation, volunteering, work–leisure balance, regular exercise, and churchgoing can change life satisfaction. Choice of partner also appears to have long-term effects.
Attributing life satisfaction or other personal outcomes to choice is sometimes regarded as problematic in the social sciences, although not in economics. Obviously, many choices are more or less constrained. However, it seems reasonable to suggest that choices relating to social participation, volunteering, exercise, and churchgoing are not seriously constrained. Nor, perhaps, are choices relating to life priorities/values. Choices about working hours and work–leisure balance are, in many cases, constrained by financial pressures and lack of flexibility on the part of employers. Choices relating to partner personality traits may be relatively unconstrained, but the relevant evidence may not be transparent!
In claiming that conscious choices can improve or worsen life satisfaction, we are not denying the prevalence or importance of adaptation in response to life changes. It is clear that most people fully adapt to most life events. They probably partially adapt to changes resulting from personal choices. For example, the effects on life satisfaction of starting a program of regular exercise or striking a more preferred work–leisure balance may be greater in the short run than the long run. Nevertheless, the evidence in this chapter, which relates to 3- and 5-year time periods (medium-term change), suggests that full adaptation does not occur.
On the basis of current evidence, it might be possible to salvage a “weak” version of set point theory. This weak version would say that a majority of adults in Western countries appear to have stable levels of life satisfaction, due to stabilizing factors including personality traits and parental influence. However, the purpose of a scientific theory or paradigm is not just to summarize and account for existing evidence, but also to direct attention to promising lines of future research. Set point theory directed the attention of SWB researchers to factors that stabilize well-being. The main future challenge is to develop a revised theory that focuses more on variables, particularly personal and public policy choices, that can bring about changes and, potentially, improvements in well-being.
Appendix 6.1
Table A6.1
Germany (GSOEP)
Long-Term Change in the Life Satisfaction (LS) Set Points of Adults Aged 25-69: 5-Year Mean Change from 1984–1988 to 2004–2008a
| Life Satisfaction Scale (0–10) | Change in LS Between 1984–1988 and 1989–1993, % of Sample | Change in LS Between 1984–1988 and 1994–1998, % of Sample | Change in LS Between 1984–1988 and 1999–2003, % of Sample | Change in LS Between 1984–1988 and 2004–2008, % of Sample |
| Change of 25 percentiles or more | ||||
| upward | 11.5 | 15.7 | 18.2 | 18.7 |
| downward | 11.1 | 16.5 | 19.5 | 19.7 |
| total | 22.6 | 32.2 | 37.7 | 38.4 |
| Change of 33.3 percentiles or more | ||||
| upward | 6.4 | 10.9 | 12.4 | 11.8 |
| downward | 6.6 | 11.5 | 13.7 | 13.5 |
| total | 13.0 | 22.4 | 26.1 | 25.3 |
| Change of 50 percentiles or more | ||||
| upward | 2.4 | 4.4 | 5.5 | 4.7 |
| downward | 2.3 | 4.8 | 6.1 | 7.4 |
| total | 4.7 | 9.2 | 11.6 | 12.1 |
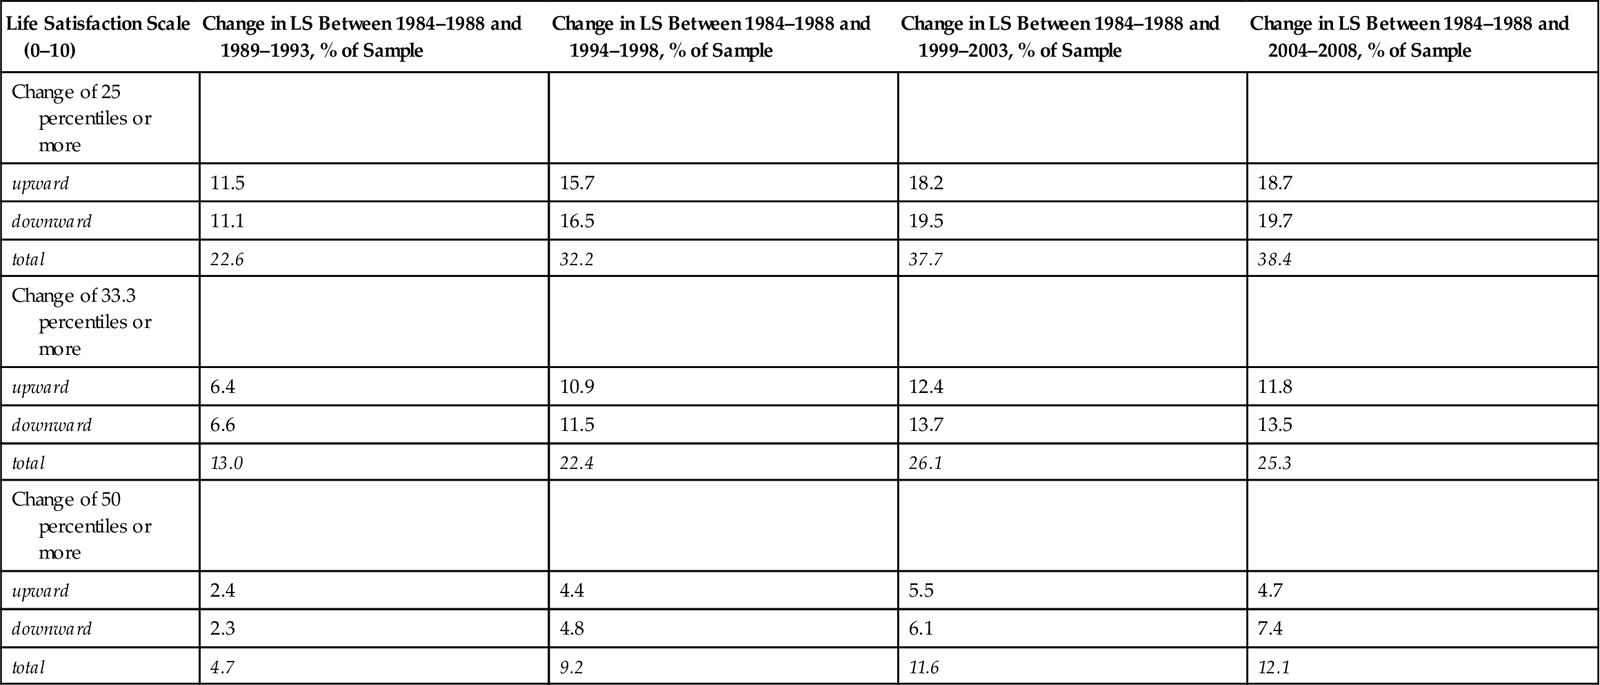
aSource: GSOEP 1984–2008: A balanced panel of respondents aged 25–69 who reported life satisfaction each year in 1984–2008 (N=1,110). Results are weighted, using a 1984–2008 longitudinal weight.
Correlations of Life Satisfaction1984–1988 with Life Satisfaction in Later 5-Year Periods
The 5-year Pearson correlations of Life Satisfaction1984–1988 with each successive 5-year period become progressively weaker. The correlation with Life Satisfaction1989–1993 is 0.70; with Life Satisfacton1994–1998, it is 0.54; with Life Satisfaction1999–2003, it is 0.47; and with Life Satisfaction2004–2008, it is 0.45. This is the pattern of change to be expected in almost any longitudinal attitudinal dataset. However, it runs counter to set point theory, as usually understood.