7
Continuously Variable Transmissions
7.1 Introduction
As discussed in Chapter 1, continuously variable transmissions (CVT) are the ideal transmission that theoretically optimize engine matching. The idea of CVT dates back to the 15th century, the original design being credited to Leonardo da Vinci [1], who invented a mechanism with CVT functionality in 1490. CVTs have found applications in machinery that operates at relatively low power, but their applications in the automotive industry have gone through many setbacks and it is only in recent decades that the CVT vehicle market share has become significant. The British company Clyno was the first to develop a passenger car equipped with a CVT, in 1923 [1]. Not much happened for automotive CVTs since that, until, in 1961, the Dutch company DAF developed a production CVT for a small passenger vehicle with the brand name Daffodil [2]. Although this rubber CVT was not successful in the automotive industry due to its low efficiency, low torque capacity, and low reliability, it regenerated industrial interest in CVT development and inspired engineers in the design, manufacturing, and ratio control of this type of transmission. In 1987, Subaru developed a CVT vehicle named Justy which was well received by the market [3]. The Justy was a subcompact car with a 1.0 or 1.2 litre gas engine. In the same year, Ford and Fiat also launched compact cars of similar engine size equipped with CVTs. Due to limited torque capacity and reliability issues, CVT applications before the turn of the century were not widespread in the industry. The purchase of the patent of the CVT belt from DAF by Busch in 1995 was probably a major event in the transmission industry. As the leading automotive supplier, Busch played a leading role both in CVT technology and its market development.
The advancements in materials, manufacturing, and control technologies made possible CVT applications in vehicles with high engine outputs. As the leading CVT developer, Jatco supplies CVTs for passenger vehicles with engine sizes of 1.0–3.5 litres, covering most vehicle models. Nissan, as the industry leader in CVT automotive applications, uses CVTs across its product line from subcompact cars to full size SUVs. Other OEMs, such as Honda, Toyota, and Subaru, are also marketing popular cars and SUVs that are equipped with CVTs. It can be safely stated that CVTs today offer a service life as long as conventional ATs. Drivers can drive a CVT vehicle as long as they want to keep it, just like a vehicle equipped with a manual or conventional AT.
The status of CVT technologies today is the result of intensive research and development by researchers and engineers both in the academic community and in the automotive industry. In a paper published in Mechanism and Machine Theory, Srivastava and Haque provided a comprehensive review of the development of CVT related technologies, with a long list of technical papers in the reference [4]. In this paper, CVT research and development was summarized in detail according to key CVT technical areas, including dynamic modeling of both belt and chain CVTs, as well as CVT ratio control. In the area of dynamic modeling, major contributions are credited to G. Gerbert for his fundamental work in the kinematics and mechanics of belt CVTs [5,6]. Miloiu, Worley, and Dolan proposed closed‐form solutions that closely approximate the CVT belt slippage and forces involved under various CVT operations [7–9]. Belt CVT Transient behaviors and dynamics during ratio changing operations were investigated by Srivastava and Haque [10–12] and Carbone et al. in a series of papers [13–15]. Micklem et al. modeled the torque transmission mechanism of belt CVT based on elastohydrodynamic theory instead of Coulomb friction and studied the power transmission losses [16]. Pfeiffer and his co‐workers conducted in‐depth investigations into chain CVT dynamics and performance using multibody and FEM modeling [17,18]. In a series of papers [19–22], Fujii and Kurokawa presented valuable research results by analytical and experimental approaches on important technical issues for belt CVT design and control, including relationships between torque transmission and pulley thrust, compression of metal blocks and ring tension, and forces acting on metal blocks during fixed ratio operations and ratio changing operations. Fujii and Kurokawa’s work sets up the practical guidelines for belt CVT design and control, and greatly contributes to the application of belt CVTs in vehicles with various engine sizes. In the area of CVT control, research efforts were mainly concentrated on continuous CVT ratio control with the objective of optimizing vehicle fuel economy, even though CVTs in today’s vehicles are often controlled with multiple stepped ratios that emulate conventional ATs. For fuel economy optimization, the engine is controlled to always operate along the optimal operating line in the fuel map. This can be realized through engine–CVT integrated control where both the engine speed and the CVT ratio are controlled simultaneously [23,24].
Note that the research works referenced above are only the highlights of CVT research and development in the published domain. For a more thorough literature review, readers are recommended to read Srivastava and Haque’s paper [4]. In addition, interested readers are also recommended to see the publications on the research and development on toroidal CVTs [25–28]. This chapter will mainly concentrate on the design and control of belt type CVTs. Readers may refer to publications that are mainly relevant to the contents in this chapter, such as the paper series by Fujii et al. [19–22].
Following this introduction section, the chapter will continue with Section 7.2 on the structural layouts of CVT systems and key components, including the basic CVT kinematics and operation principles. Section 7.3 will then concentrate on force analysis during CVT operations, and the mechanisms for torque transmission and ratio changes. Section 7.4 will look at control system design and the analysis of the control of ratio changing processes. Section 7.5 will present CVT system control strategies, including continuous ratio control, stepped ratio control, and system line pressure control.
7.2 CVT Layouts and Key Components
In a belt type or chain type continuously variable transmission, the belt–pulley or chain–pulley assembly realizes the ratio change functions. Overall transmission ratio is the multiplication of the variable CVT ratio with the stepped ratios of the gear sets in the transmission layouts. Typical belt or chain CVT systems are illustrated in Figure 7.1.
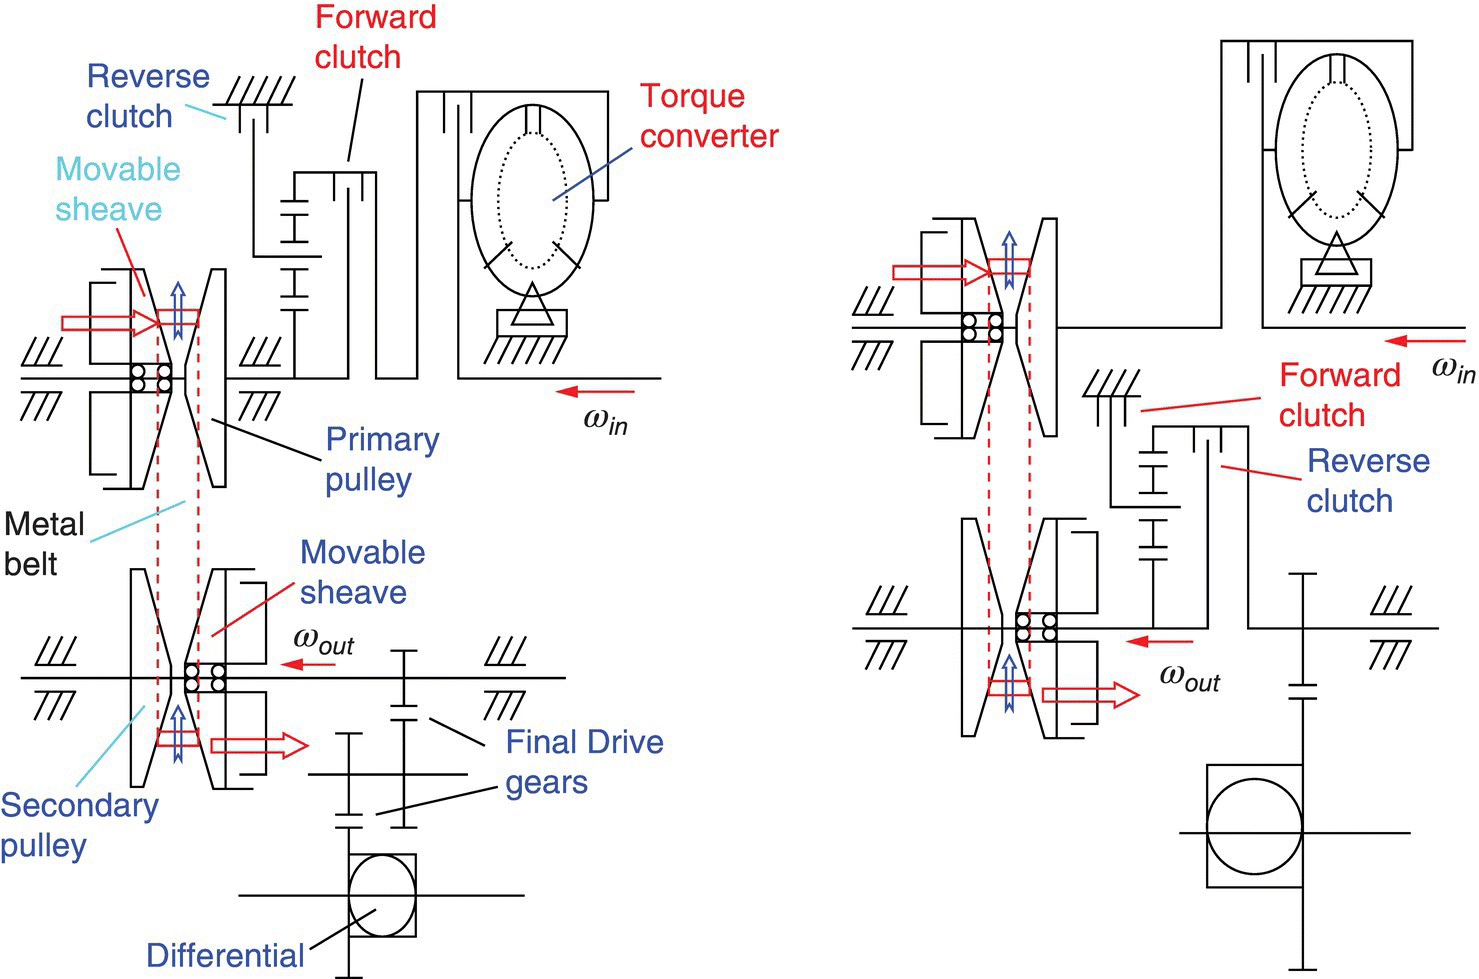
Figure 7.1 Belt or chain CVT structural layouts.
As shown in Figure 7.1, forward and reverse gears of the transmission are achieved by a simple planetary gear set through a forward clutch and a reverse clutch that are hydraulically actuated. A torque converter is used in most CVTs as the vehicle launcher, even though it is possible to use the forward clutch as the launcher if no torque converter is provided. There is no fundamental difference in the kinematics shown in Figure 7.1 between RWD CVTs and FWD CVTs Figure.
The planetary gear set can be placed either before the input (primary) pulley or after the output (secondary) pulley, as shown in the figure. For the case when the planetary gear set is placed before the input pulley as shown on the left in Figure 7.1, the input pulley rotates in opposite directions for forward and reverse gears, and the final drive usually consists of two gear sets, since the planetary gear set does not contribute to the overall drive line ratio. If placed after the output pulley as shown on the right in Figure 7.1, the planetary gear set provides an additional gear ratio in forward gears. This additional gear ratio is equal to the planetary gear train parameter β, and the overall drive train ratio is then equal to (icvtβia), with icvt and βia as the CVT ratio and the final drive ratio respectively. In this layout, only one set of gears is needed in the final drive, and the input pulley always rotates in the same direction.
7.2.1 Belt Structure
The metal belt is the key CVT component and consists of many pieces of identical thin metal blocks and two steel bands, as shown in Figure 7.2. Each of the bands contains multiple layers (usually 9–12 layers) of thin steel rings (about 0.2 mm in thickness) laminated one on top another as shown in Figure 7.2b. The metal block has two slots, one on each side, into which the band is positioned. Hundreds of metal blocks – up to 400, and each with a thickness of about 2 mm – are strung along the two bands as shown in the figure. When assembled, the two bands (or rings as also commonly termed in the industry) will be in tension and the metal blocks will be under compression. When placed in the pulleys, as shown in Figure 7.2a, the side surfaces of each metal block contact the conical surface of the pulleys and it is the friction at this contact that transmits torque from the input pulley to the output pulley. The wedge angle of the pulleys is usually designed to be 22°, as indicated in Figure 7.2b. This gives a half wedge angle or groove angle of 11°, which optimizes the torque transmission and the lifting of the belt in the pulley wedges during ratio changing operations. The mean contact radius between the side surface of a metal block and a pulley groove surface is called the pitch radius, which is denoted as r1 on input side and r2 on the output side. The CVT ratio is then defined as  .
.
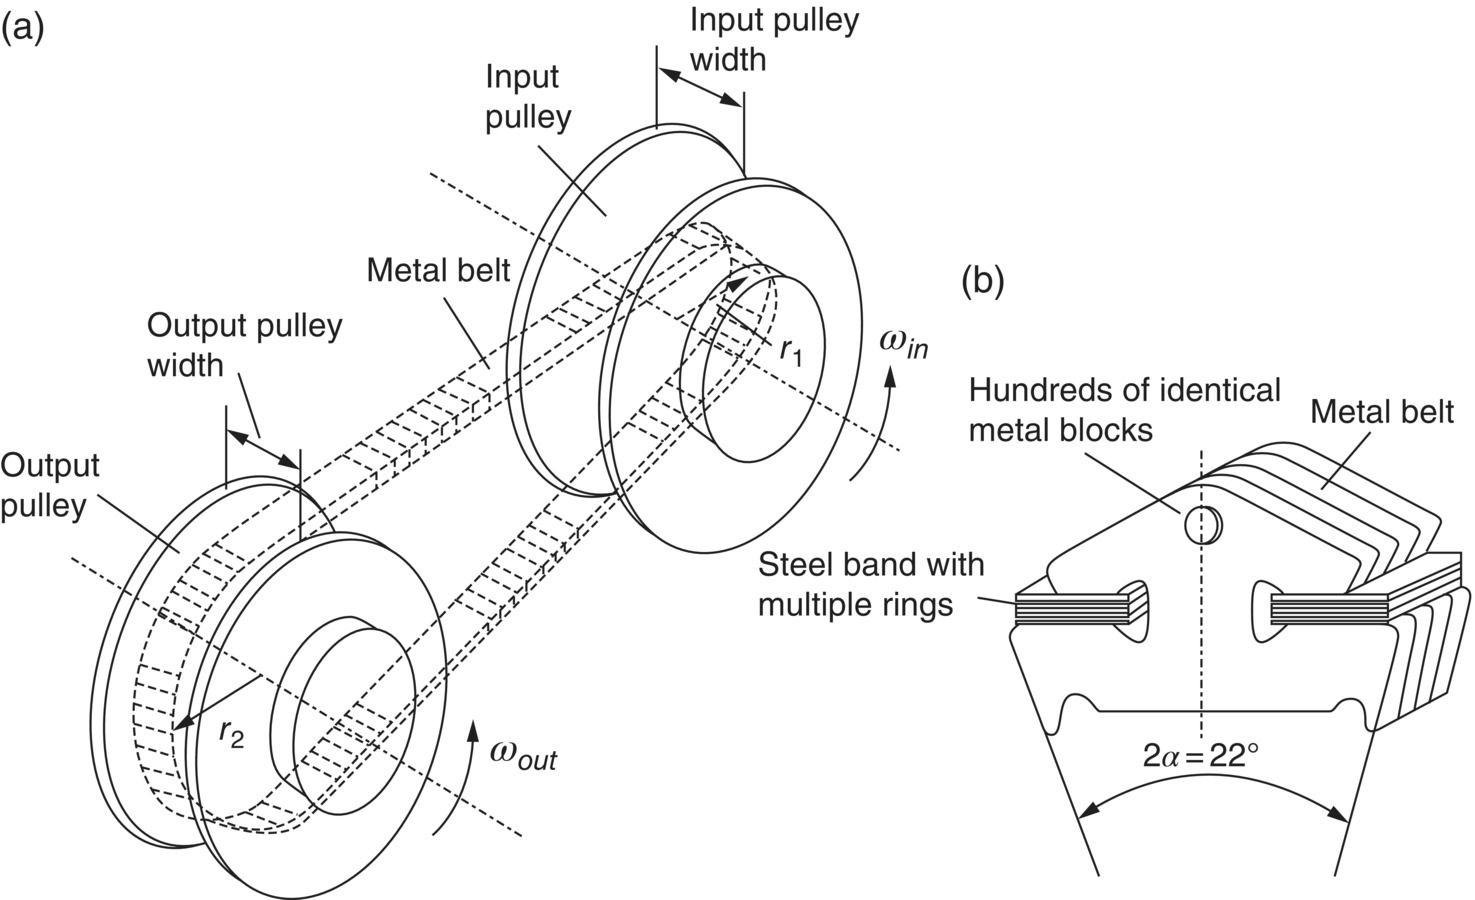
Figure 7.2 Structure of metal belt.
7.2.2 Input and Output Pulleys
Each of the two pulleys consists of two sheaves, one movable along the shaft and the other fixed on the shaft. As shown in Figure 7.3, the movable sheaves are supported on the input and output shafts by ball splines. These ball splines minimize the friction between the shaft and the movable sheave on it, during ratio changing processes, while keeping the movable sheave rotating with the shaft. The axial motion of the two movable sheaves is actuated hydraulically, with the moveable sheaves also serving as the hydraulic pistons, as shown in Figure 7.3. The return spring in the piston chamber dampens the initial stroking force of the hydraulic piston. During ratio changing processes, the movable sheaves are actuated to move along the respective shafts, forcing the metal belt to rise or drop in the grooves of the input and output pulleys. In an upshift, the metal belt rises in the input pulley groove and drops in the output pulley groove, making r1 larger and r2 smaller so as to decrease the CVT ratio icvt. As can be observed in Figures 7.2 and 7.3, the width of the input pulley decreases whiles the width of the output pulley increases during upshifts. On the contrary, the metal belt rises in the output pulley groove and drops in the input pulley groove during downshifts, making r2 larger and r1 smaller so as to increase the CVT ratio icvt. This also increases the input pulley width while decreases the output pulley width.

Figure 7.3 Input and output pulleys.
As the movable sheaves move axially during shift operations, the central line or the line of symmetry of the input pulley and the output pulley will be displaced unequally along the respective shaft. As a result, the central line of the metal belt will be tilted as shown in Figure 7.4, causing unfavorable loading conditions on the belt. Belt tilt caused by ratio change can be minimized by arranging the movable sheaves of the input and the output pulleys on opposite sides, as shown in Figure 7.3. In this arrangement, both the input and output sides of the belt move in the same direction during ratio change operations, thus keeping the belt tilt angle at a negligible level. As shown in Figure 7.4, the displacement of the movable sheave and the belt displacement in the pulley groove are related as  . The belt tilt angle is then determined as:
  .
.
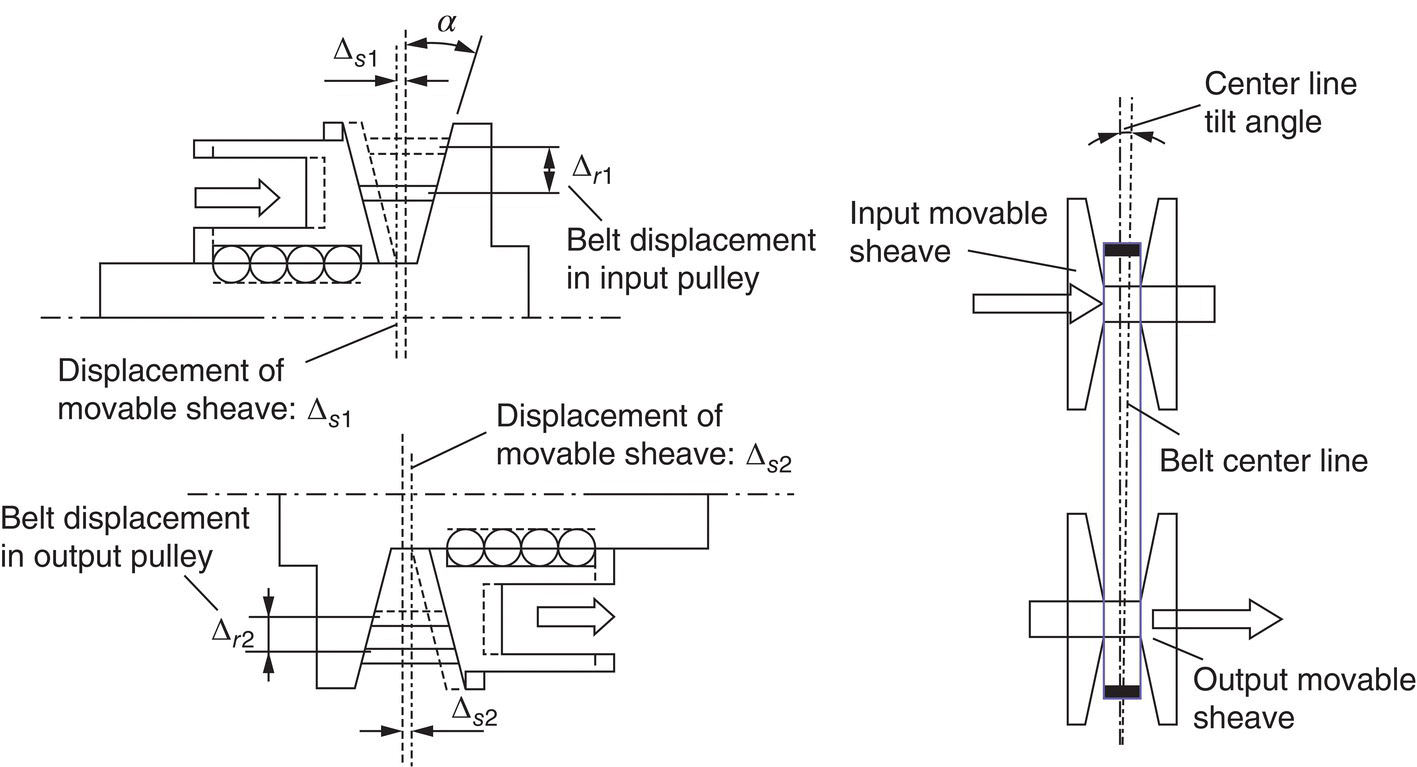
Figure 7.4 Belt central line tilt.
7.2.3 Basic Ratio Equation
The length of the metal belt at assembly is equal to the metal block thickness multiplied by the number of the metal block and is a near constant since the compressive deflection of the metal blocks is negligible. A pitch line is defined on the metal belt to relate the angular velocities of the input and output pulleys. This pitch line has the same length as the metal belt and consists of the contact arcs on the pitch circles of the two pulleys with pitch radii r1 and r2, and the two identical tangents to the two pitch circles, as shown in Figure 7.5. Theoretically, there is no slippage along the pitch line between the side surfaces of the metal blocks and the pulley surfaces. In kinematics, it can be stated that the two pitch circles are defined by the CVT ratio icvt.
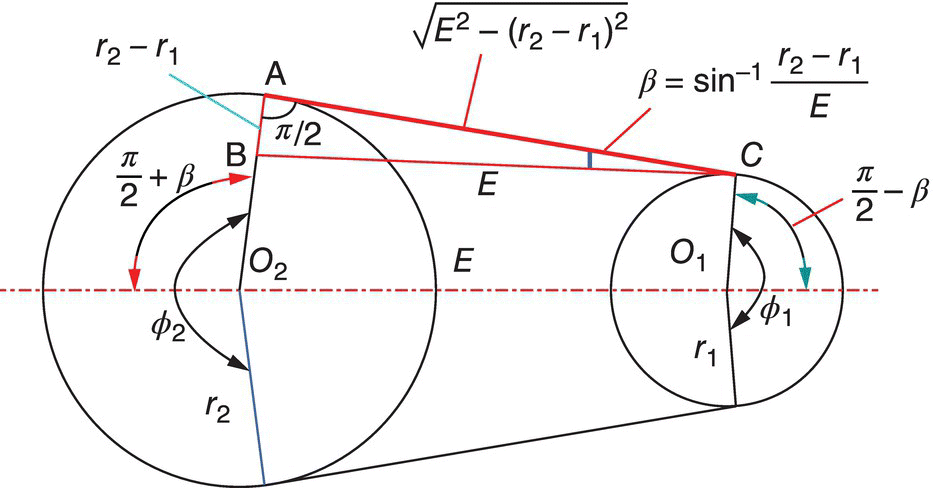
Figure 7.5 Belt pitch line and contact arcs.
As shown in Figure 7.5, O1 and O2 are the centers of the input and output pulleys respectively and E denotes the center distance. Angle β is measured between the common tangent to the two pitch circles and line BC that is parallel to the center line O1O2. It is apparent from Figure 7.5 that the contact angles ϕ1 and ϕ2, which are the angles that the contact arcs span on the pitch circles of the input and output pulleys respectively, are equal to  on the input pulley and
  on the output pulley. Since the length of the pitch line is a constant, the following equations can be readily derived by trigonometry using Figure 7.5:
where L is the length of the pitch line, which is almost a constant. For any specified value of the CVT ratio icvt, the two corresponding pitch radii r1 and r2 can be uniquely determined by solving Eqs (7.1) and (7.2) together. The two contact angles, ϕ1 and ϕ2 are then determined readily as shown in Figure 7.5. Note that the trigonometry shown in Figure 7.5 is valid when the CVT ratio is larger than 1.0. When the CVT ratio is smaller than 1.0, the subscripts for the pitch radii in Eq. (7.1) should be switched.
7.3 Force Analysis for Belt CVT
As mentioned in the introduction section, force analysis and the relation between various forces during belt CVT operations has been the subject of intensive research. This section presents the analysis, as quantitatively as possible, for the forces acting on individual metal blocks, pulleys, and the whole belt. The distribution of block compressive force and ring tension force will be analysed according to the CVT ratio and load conditions. The focus of the section is on the torque transmitting mechanism and the relations between the various forces involved in CVT operations, especially the relation between the thrust forces on the input pulley and the output pulley. Since the ratio between the pulley thrust forces is critical for belt CVT design and control, it has been the main subject of study in the paper series [19,20] by Fujii et al. as highlighted previously.
7.3.1 Forces Acting on a Metal Block
The free body diagram for an individual metal block inside the input or output pulley groove is shown in Figure 7.6. On the friction surface of the metal block, there exist three forces: the normal contact force N, the radial friction force Fr, and the tangential friction force Ft. The band normal force NB and the band friction force Fb exist on the contact surface (saddle surface) between the steel band and the metal block. These forces are symmetrical on both sides of the metal block. The metal block is also subject to compressive forces (pushing forces) CB and CA, that are applied by the neighboring blocks before and after respectively. The friction forces are related to the normal contact forces as follows, based on Coulomb friction theory:


where μt and μr are the tangential and radial friction coefficients between the block side surface and the pulley groove surface respectively, while μb is the friction coefficient between the band and the block slot surface. During CVT operation, torque is transmitted from the input pulley to the output pulley by the tangential friction force Ft. For normal CVT power transmission, there must be no slippage between the belt and the pulleys. This requires that the tangential friction coefficient μt in Eq. (7.3) must not exceed the maximum friction coefficient μmax, i.e.  . The radial friction force Fr is opposite in direction to the radial displacement of the metal belt in the pulley grooves during ratio changing operations. For example, the radial friction force is toward the input pulley axis during upshifts and outward during downshifts. Based on the equilibrium of the metal block, there exist the following relations between the forces shown in Figure 7.5:
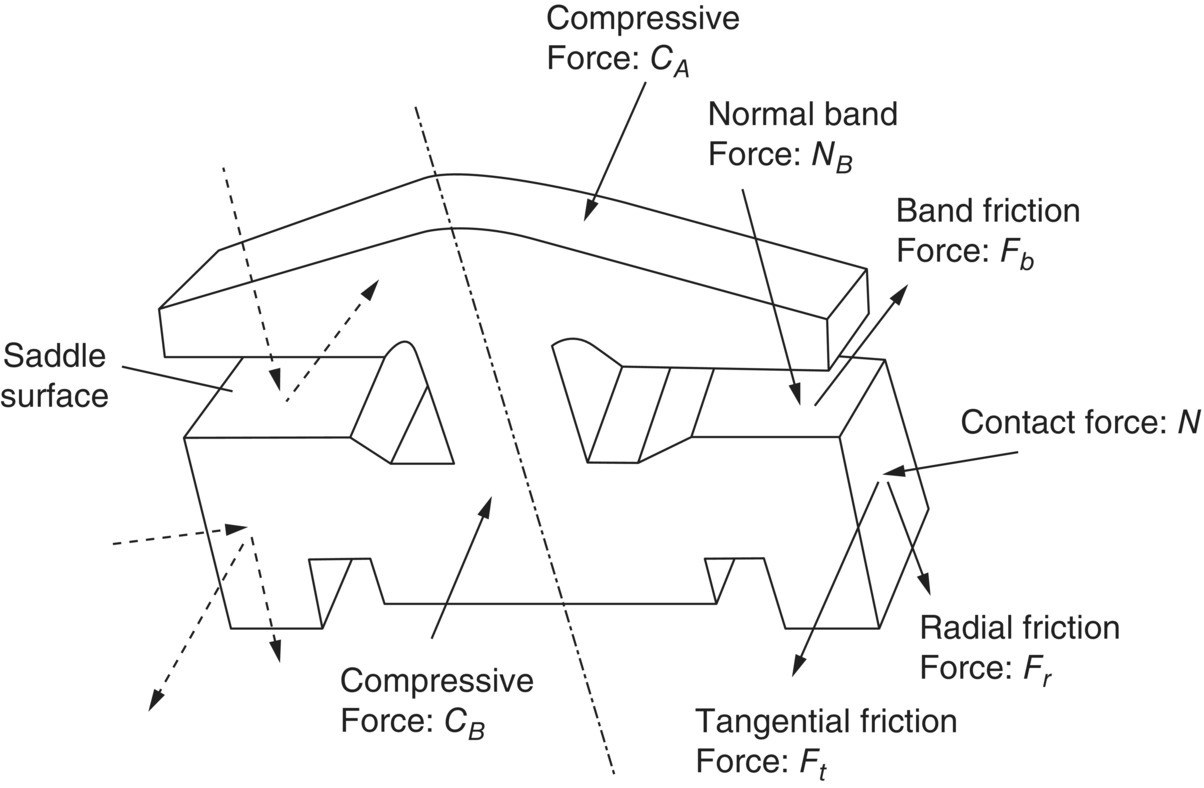
Figure 7.6 Forces acting on a metal block.
In Eq. (7.6), the minus sign is for upshifts and the plus sign is for downshifts for the radial friction force in the input pulley. The signs for the radial friction force in the output pulley are opposite to those for the input pulley. Note that the quantitative analysis on the band friction force is very difficult since Eq. (7.7) is highly indeterminate as the compression of metal blocks and the band slippage are dependent upon CVT operations.
7.3.2 Forces Acting on Pulley Sheaves
The normal contact force and the radial friction force acting on the metal block are shown in Figure 7.7a on the axial section of the input pulley when the metal belt is moving outward. These forces are symmetrically applied on each side of the metal block. The normal contact force and the radial friction force acting on the two sheaves of the input pulley are shown in Figure 7.7b. The thrust force P is applied respectively on the two sheaves along the axial direction. For the movable sheaves of the two pulleys, the thrust force P is applied by the respective hydraulic piston as shown in Figure 7.3a. As mentioned previously, the movable sheave is supported on the shaft by ball splines and the resultant reaction from the balls to the movable sheave is denoted by R in Figure 7.7b. Altogether, there are five forces applied to the movable sheave: four act on the axial section as shown in Figure 7.7b, the fifth force is the tangential friction force Ft that acts perpendicular to the axial section and is not shown in Figure 7.7b. Note that the resultant axial load on the input or output shaft is zero since the thrusts on the two sheaves cancel each other. In addition, the groove angle α must be designed to be larger than the friction angle  since the metal block must be pushed outward by the thrust force during ratio changes.
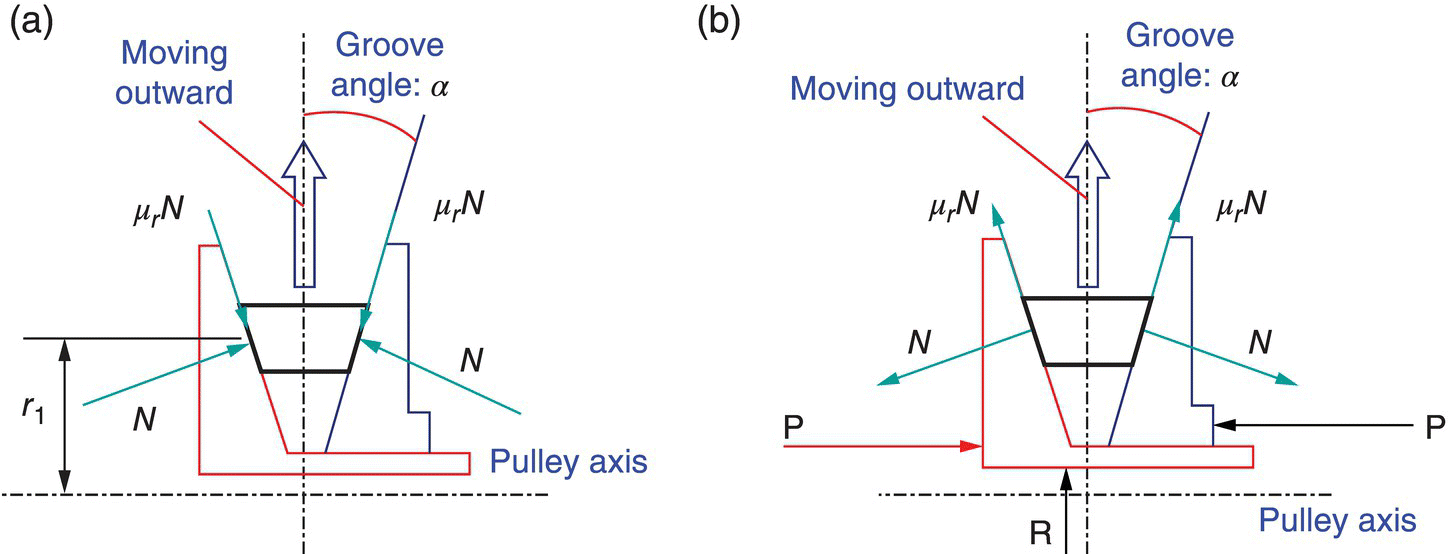
Figure 7.7 Forces acting on a metal block and on the input pulley on the axial section.
Forces acting on pulley axial section are shown in Figure 7.7. The thrust force P is applied on each half of the pulley along the pulley axis and R is the reaction force applied on the movable sheave in the direction that is collinear with the CVT center line O1O2 shown in Figure 7.5. The contact force N and the radial friction force μrN of all metal blocks, shown in Figure 7.7, on the axial section for one block, have the same projections respectively upon the pulley axis. The sum of the projections of all forces on a movable sheave in the direction of the pulley axis must be equal to zero for equilibrium. This results in the following equations that relate the thrust force P, the contact force N and the radial friction force μrN for the movable sheaves of the input and output pulley respectively:
where Pin and Pout are the thrust forces applied by the hydraulic pistons, or the thrust forces generated by other means on the movable sheaves of the input and output pulleys respectively, and n and m are the numbers of metal blocks along the contact arcs on the two pulleys respectively. The plus sign is for the case when the block in the input pulley is moving outward and the minus sign is for the case when the block is moving inward. It is assumed in the equations that the radial friction coefficient μr is the same for all metal blocks in the same pulley. Assuming the tangential friction coefficient μt to be the same for all metal blocks in the same pulley, the resultant torque made by all the tangential friction forces on the input or output pulley is then given by the following two equations:
where r1 and r2 are the pitch radii of the input and output pulleys respectively. Clearly, the input torque and the output torque are related by the CVT ratio, i.e.  . The relation between thrust force and torque can be readily derived by combining Eq. (7.8) with Eq. (7.10) and Eq. (7.9) with Eq. (7.11), as follows:
Note that the derivation of the two equations above does not assume even distribution of the contact force N between the pulley groove surface and the metal blocks. Since the groove angle α is small and the term (μr sin α) is negligibly small, these two equations can be simplified for the relation between thrust force and torque:

Note that the four friction coefficients, (μr1, μt1) and (μr2, μt2), are highly indeterminate during CVT operation. Practically, this means that the relation between the input thrust force Pin and the output thrust force Pout cannot be readily derived using Eqs (7.12) and (7.13). This relation is critical for belt CVT design and control and will be discussed later in detail. To avoid slippage between belt and pulley, both the real time tangential friction coefficients μt1 and μt2 must be smaller than the maximum friction coefficient μtmax. The maximum input torque that can be transmitted by belt CVT is then defined using Eq. (7.15) as:
This simple equation is important for belt CVT design and control. The thrust force on the output pulley, Pout is usually controlled as the active force, with the thrust force on the input pulley Pin as the reaction force, as will be detailed later. For a given CVT, the value of the maximum friction coefficient μmax can be estimated with decent accuracy experimentally. Even without knowing the exact μmax value, the relation between the maximum input torque Tmax and the thrust on the movable sheave of the output pulley can be determined by experiments on a CVT test rig. In such experiments, a certain thrust force Pout is set and the CVT under test is controlled to run at a certain CVT ratio. The input torque is then gradually ramped up until the belt starts to slip. The input torque recorded at the threshold of slippage is then the maximum input torque Tmax for the specific thrust force Pout. For CVT design and control, the ratio between the real time input torque that is being transmitted and the maximum input torque determined by Eq. (7.16), is defined as the torque ratio, i.e.  . The torque ratio is a measure of the load condition and of how much the CVT operation status is below the block–pulley slippage threshold and thus can be considered as a safety factor. The torque ratio it is one of the important factors that determine the mechanism of torque transmission and the relation between the forces involved in CVT operations.
As mentioned previously, Figure 7.7b only shows the forces applied by the metal block to the input pulley on the pulley axial section. In general, the free body diagram of the movable sheave of the input pulley is shown in Figure 7.8. In this figure, the pulley central line O1O2 bisects the input pulley. The position of a particular metal block is defined by the block position angle θi, and R and Q are, respectively, the reaction force applied by the ball splines shown in Figure 7.3 to the movable sheave in the direction along the CVT center line and along the direction perpendicular to the plane formed by the two pulley axes.
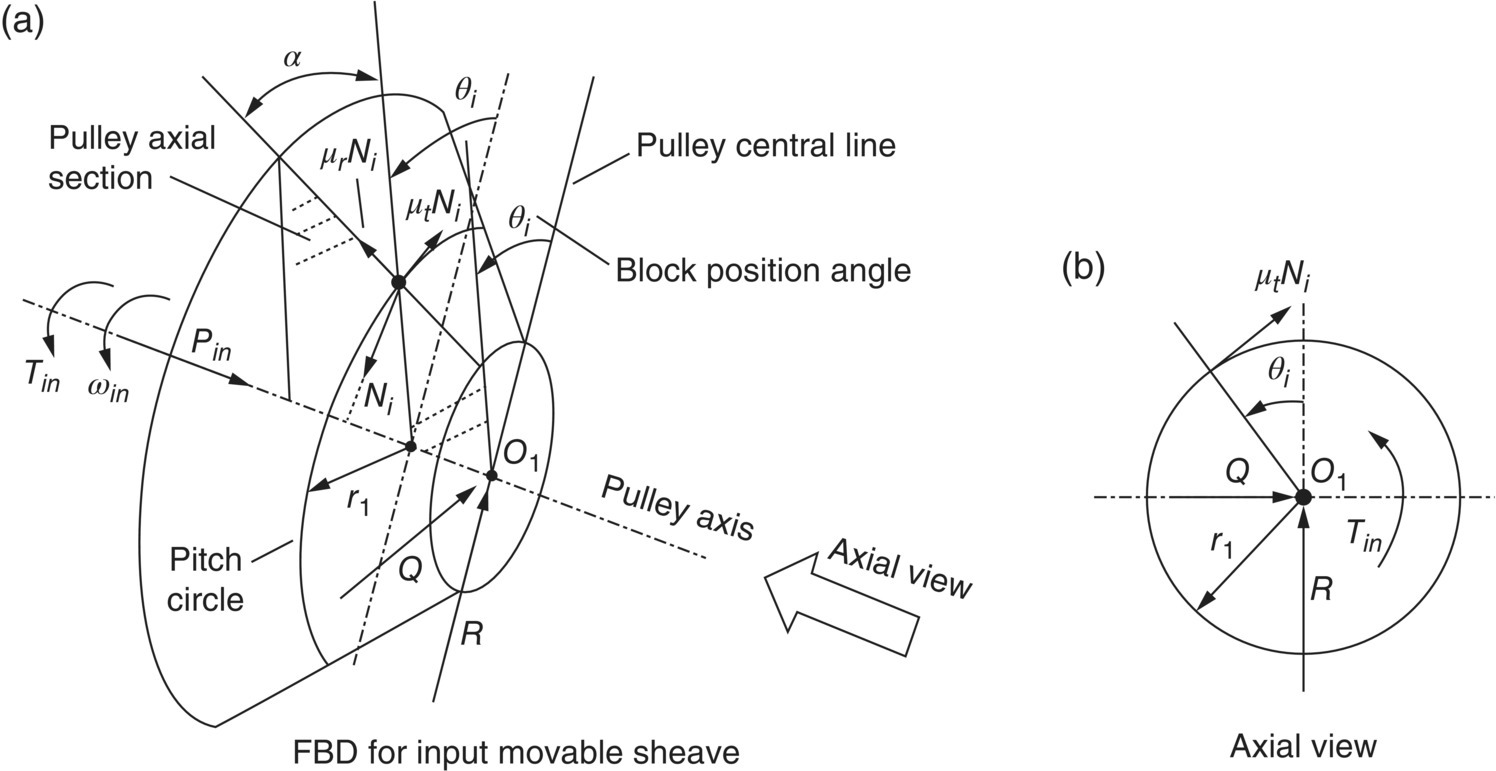
Figure 7.8 Free body diagram of the movable sheave of the input pulley.
The block position angle θi in Figure 7.8 is related to the contact angle ϕ1 defined in Figure 7.5, the pitch radius r1 and the thickness of the metal block, denoted as t. It is apparent that the number of metal blocks on the input pulley and the position angle of each block along the contact arc can be determined by:

The number of blocks denoted as n in Eq. (7.17) can be rounded to the nearest even number without losing notable accuracy. The equilibrium condition along the pulley axis has been used to derive Eq. (7.8) for the determination of the thrust force Pin. The reaction forces R and Q can be determined respectively in terms of the contact force Ni and the friction forces applied by the belt to the movable sheave by considering the equilibrium conditions along the other two directions. Reaction force Q is only related to the load on the ball splines that support the movable sheave. The reaction force R, that acts along the CVT center line is more relevant to CVT torque transmission and ratio control and is determined by:
The minus sign in this equation is for the case when the block is moving outward in the input pulley. The free body diagram for the movable sheave of the output pulley can be drawn similar to Figure 7.8 and the reaction force to the output pulley movable sheave can be represented by an equation similar to Eq. (7.19).
7.3.3 Block Compression and Ring Tension
As mentioned previously, the steel band or ring is in tension while the metal blocks are under compression when the CVT is assembled. However, the status of ring tension and block compression will change according to the CVT’s operation conditions. The CVT ratio and the torque transmitted have the most effect on the status of ring tension and block compression, as analysed in the paper series published by Fujii et al. [19,20]. As shown in Figure 7.9, C1 and C2 are respectively the block compressive forces on side 1 and side 2, K1 and K2 are the respective ring tension forces. Away from the contact arcs, the block compressive force and the ring tension force on either side of the belt are constant. According to the analysis by Fujii and Kurokawa, there exists sliding between the ring and the block on the saddle surface (i.e. the contact surface between the ring and the block, as shown in Figure 7.6) at the pulley with smaller pitch radius. This is because the so‐called saddle speed, that is the speed of the pulley at the radius of the saddle surface, is higher in the pulley with smaller pitch radius than that in the pulley with the larger pitch radius. This speed difference is larger than ring elasticity can compensate for. As shown in Figure 7.9, ring sliding on the saddle surface occurs on the input pulley when  and on the output pulley when
  . As a result of this, the pulley with smaller pitch radius is always ahead of the belt on it, tightening up the belt side that moves toward it and slackening the other side that moves away from it, as shown in Figure 7.9. Ring tension exists under all CVT operation conditions on both sides, but block compressive force only exists on one side, as determined by the CVT ratio and the torque ratio defined previously. As shown in Figure 7.9, block compressive force only exists on Side 1 of the ring when
  , and may exist on either side of the ring as warranted by the torque ratio it when
  .
.
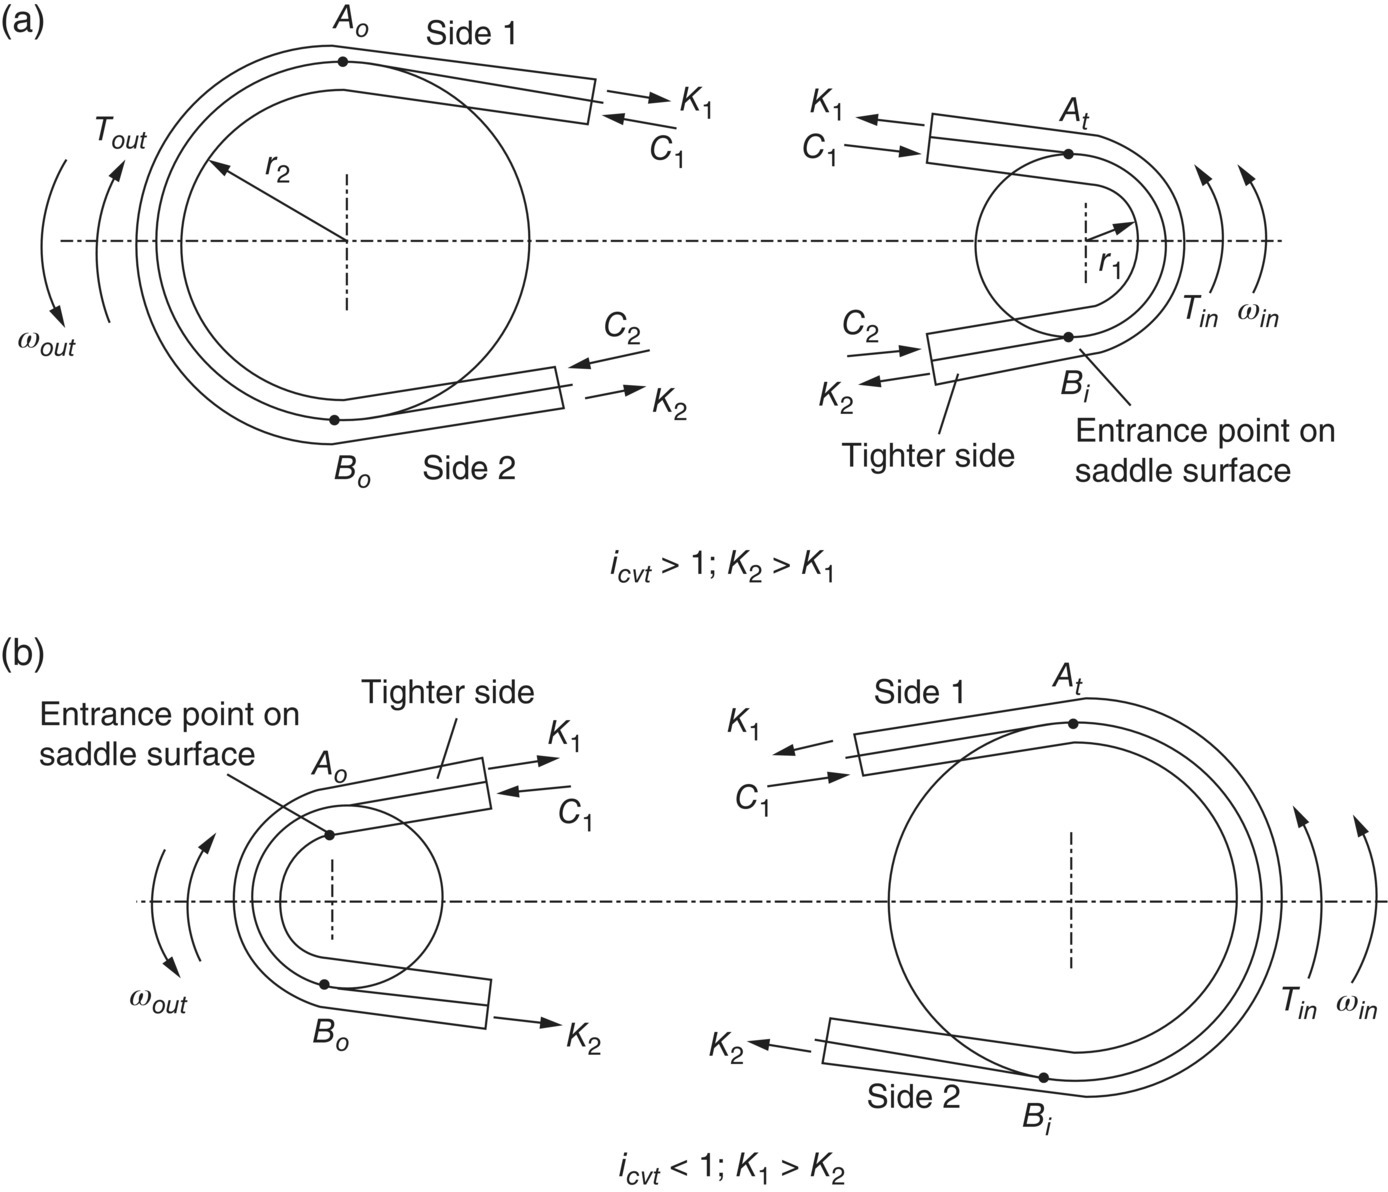
Figure 7.9 Ring tension and block compression forces.
7.3.4 Torque Transmitting Mechanism
By considering the equilibrium of the input or output pulley in Figure 7.9, it is apparent that both the block compressive force and the ring tension force participate in the transmission of torque between the input pulley and the output pulley. This might be in contrast to the common conception that torque is only transmitted by the pushing force on the blocks from the input to the output. The qualitative effect of ring tension on torque transmission can be readily observed from Figure 7.9, which shows that the ring tension aids the block compressive force in transmitting torque from the input pulley to the output pulley when  since
since  , but when
  , the ring tension acts against the torque transmission from the input pulley to the output pulley. When
  , the ring tension status is similar to the case for
  as shown in Figure 7.9a. This is because the friction force between the pulley saddle surface and the ring, that is force Fb shown in Figure 7.6, tightens up Side 2 of the ring which moves toward the input pulley in the absence of the sliding of the ring on the saddle surface. A peculiar situation arises when
  and there is no load on the output pulley (i.e.
  . Since ring tension always exists, a torque with its magnitude proportional to
  is transmitted from the input pulley to the output pulley as shown in Figure 7.9a. To maintain the equilibrium of the output pulley, there must exist block compressive force C2 on Side 2 of the ring to counterbalance the effect of the ring tension. Therefore, when
  and there is no load on the output pulley (i.e. torque ratio
  ), there exists block a compressive force on Side 2 of the ring. Since the compression status of the metal blocks can only be changed continuously as the transmitted torque or torque ratio it increases, block compressive force on Side 2 of the ring will maintain its existence until the torque ratio increases from zero to a certain threshold value itc. In summary, the input torque that is transmitted by the block compressive force and the ring tension force is formulated by the following equations:
where r1 is the pitch radius of the input pulley; rs1 is the mean radius of the arc formed by the ring in the input pulley; rc1 is the radius of the point of concentration of the compressive force on the block face and can be approximated as the input pulley pitch radius r1. Ce is the equivalent torque transmitting force as if it acts at the pitch radius. In Eq. (7.20), the ring tension difference inside the pair of parenthesis is always positive; the block compressive force C1 or C2 does not exist simultaneously on both sides of the ring. The following conclusions can be made on the belt CVT torque transmission mechanism based on Eq. (7.20):
- When
 and torque ratio is lower than a certain value itc (i.e. when load is low), torque is transmitted by the ring tension force positively from the input to the output, but block compressive force acts against positive torque transmission, i.e. it acts against torque transmission from the input to the output. This is the only situation where the block compressive force exists on Side 2 of the ring and acts against torque transmission, as shown in Figure 7.9a.
 - When
 and torque ratio is higher than the threshold value itc, both the ring tension force and the block compressive force transmit torque positively from the input to the output. This is the most efficient belt CVT torque transmission mechanism and is also the most conducive to CVT durability. In order to keep the torque ratio it around the optimized value, it is necessary to control the thrust force on the output pulley Pout in Eq. (7.15) just above the value needed to transmit the required input torque. The torque ratio
  or above is suggested in the paper series by Fujii et al. [19,20] for CVT operations corresponding to the most driven traffic conditions. In addition, lowering the thrust force Pout to be just above the value necessary for normal torque transmission reduces the loads on all components of the CVT system, including the CVT unit itself, pumps and hydraulic components, gears, bearings, and shaft, and is beneficial for CVT system efficiency, reliability, and durability.
 - When
 , the ring tension force acts against positive torque transmission from the input to the output. The block compressive force always transmits torque positively from input to output when
  regardless of the torque ratio.
 - The equivalent torque transmitting force Ce is defined in Eq. (7.20) to reflect the resultant effect of the block compressive force and the ring tension on torque transmission. This is a virtual force that acts at the pitch radius of the input pulley.
- When
 , it is correct to say that a certain percentage of the input torque is transmitted from input to output by the ring tension force since it contributes positively to the equivalent torque transmitting force Ce. However, when
  , it is not correct to say that a torque with a magnitude of
  is transmitted from the output pulley backward to input pulley. Or otherwise, there would exist a significant amount of power recirculation between the input and the output pulleys, causing significant efficiency loss, overheating, and other detrimental issues.
The block compressive force and the ring tension force were investigated experimentally in depth by Fujii et al. [19–22]. As shown in Figure 7.9 and Figure 7.10, Bi and Ai are respectively the entrance and exit points on the input pulley contact arc; Ao and Bo are respectively the entrance and exit points on the output pulley contact arc. AiAo is belt Side 1 and BiBo is belt Side 2. The distribution of block compression and ring tension is shown in Figure 7.10 when  and the torque ratio it is higher than 0.5. As shown in the figure, ring tension on Side 2 is higher than on Side 1 (
 , and block compressive force C1 exists on belt Side 1. A convincing interpretation of the experimental data was provided in [19–22] regarding the distribution of block compression and ring tension shown in Figure 7.10. When the CVT under testing runs in stable condition, ring Side 2 BiBo is tightened up while Side 1 AiAo is slackened. There exists a small amount of backlash between blocks on Side 2 under this condition. Therefore, there is still no compression on the blocks after they have entered the input pulley on Side 2 at point Bi, because compression cannot build up until the backlash is totally eliminated by the tangential friction force between the blocks and the input pulley. The tangential friction force has the effect of pushing the blocks toward the input pulley exit Ai. After the block backlash is eliminated, the block compression then rises quickly in the input pulley. Theoretically, the compressive force of the block that leaves the input pulley exit should be equal to the compressive force C1 on Side 1. The spiky transition at point Ai is caused by the tilt of the block when it leaves the input pulley exit. For the ring contained in the input pulley, the tension gradually decreases from the value K2 on Side 2 toward the input pulley exit. It jerks somewhat at the position in the contact arc where the block compression starts to build up and is equal to the ring tension force K1 on Side 1. After the blocks enter the output pulley at the entrance AO, the block compressive force ramps up to a maximum value and then quickly ramps down to be zero at the exit Bo. This phenomenon was not explained by Fujii et al. and can be analysed as follows. After entering the output pulley, a block is acted on by four forces: two compressive forces that act on the front and rear of the block, denoted as CB and CA respectively in Figure 7.6, the tangential friction force Ft and ring or band friction force Fb. The ring friction force increases the block compression while the tangential friction force decreases it as indicated by Eq. (7.7). The effect of the ring friction force is more than that of the tangential friction force along the contact arc until the block compression reaches its maximum. Then, the effect of tangential friction dominates and reduces the block compression to zero quickly toward the exit Bo.
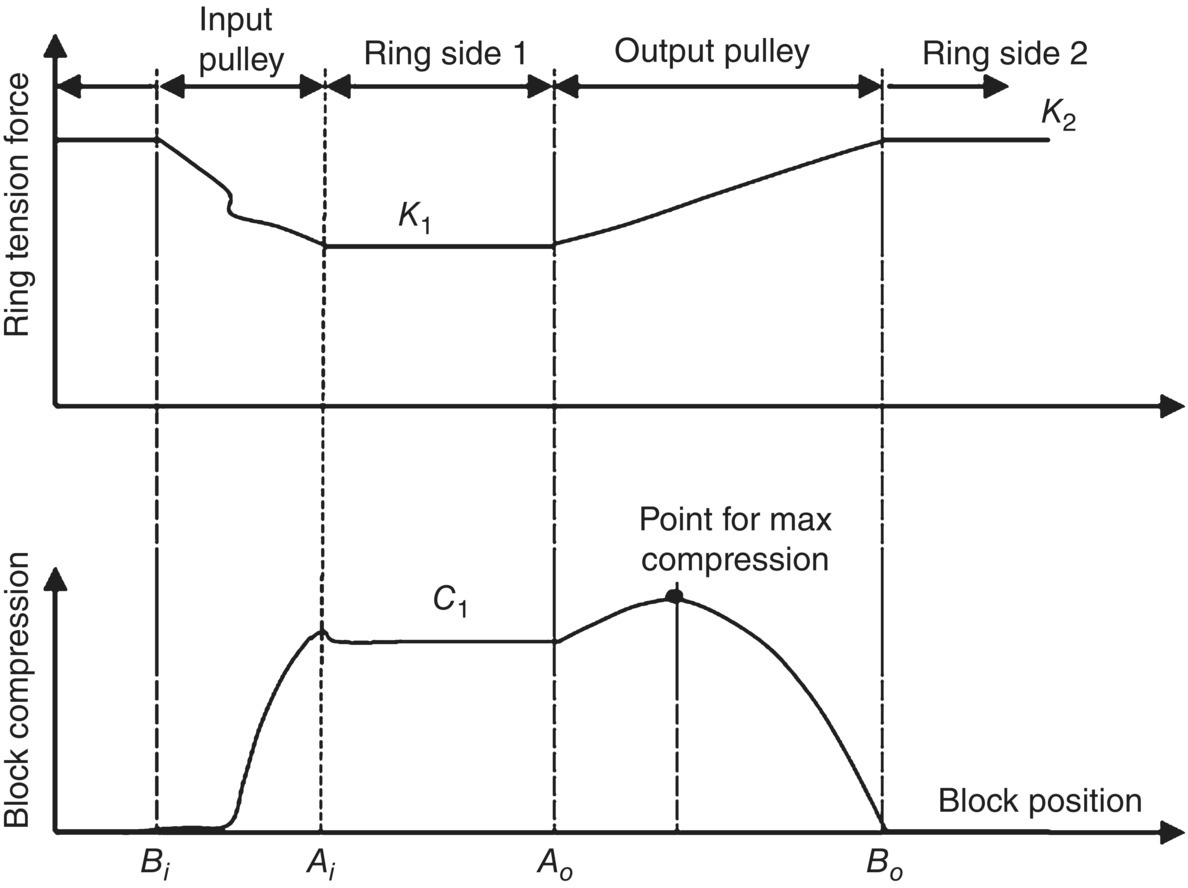
Figure 7.10 Ring tension and block compression distribution when  and
and  .
.
The distribution of block compression and ring tension is shown in Figure 7.11 when the CVT runs under light load conditions, with Figure 7.11a showing the case when  and Figure 7.11b showing the case when
  . As shown in Figure 11a, block compressive force C2 acts on belt Side 2 and acts against torque transmission from the input to the output. There is no block compressive force on belt Side 1. Under this condition, it is the ring tension that overcomes the block compressive force C2 and acts as the torque transmitting force. This is the only condition under which the block compressive force ramps down to be zero in the input pulley from entrance to exit and ramps up in the output pulley from zero at the entrance to C2 at the exit. When
  , the ring tension always acts against torque transmission since
  , as shown in Figures 7.9b and 11b. Based on the experiment data in the paper series [19,20], the ring tension force difference
  remains almost unchanged for all torque ratios at a given CVT ratio except when
  . This requires that the block compressive force C1 keeps increasing as the torque ratio it increases. This is in contradiction to the analysis in the papers [19,20], which states that the block compressive force C1 remains a constant when the torque ratio is below some threshold value itc.
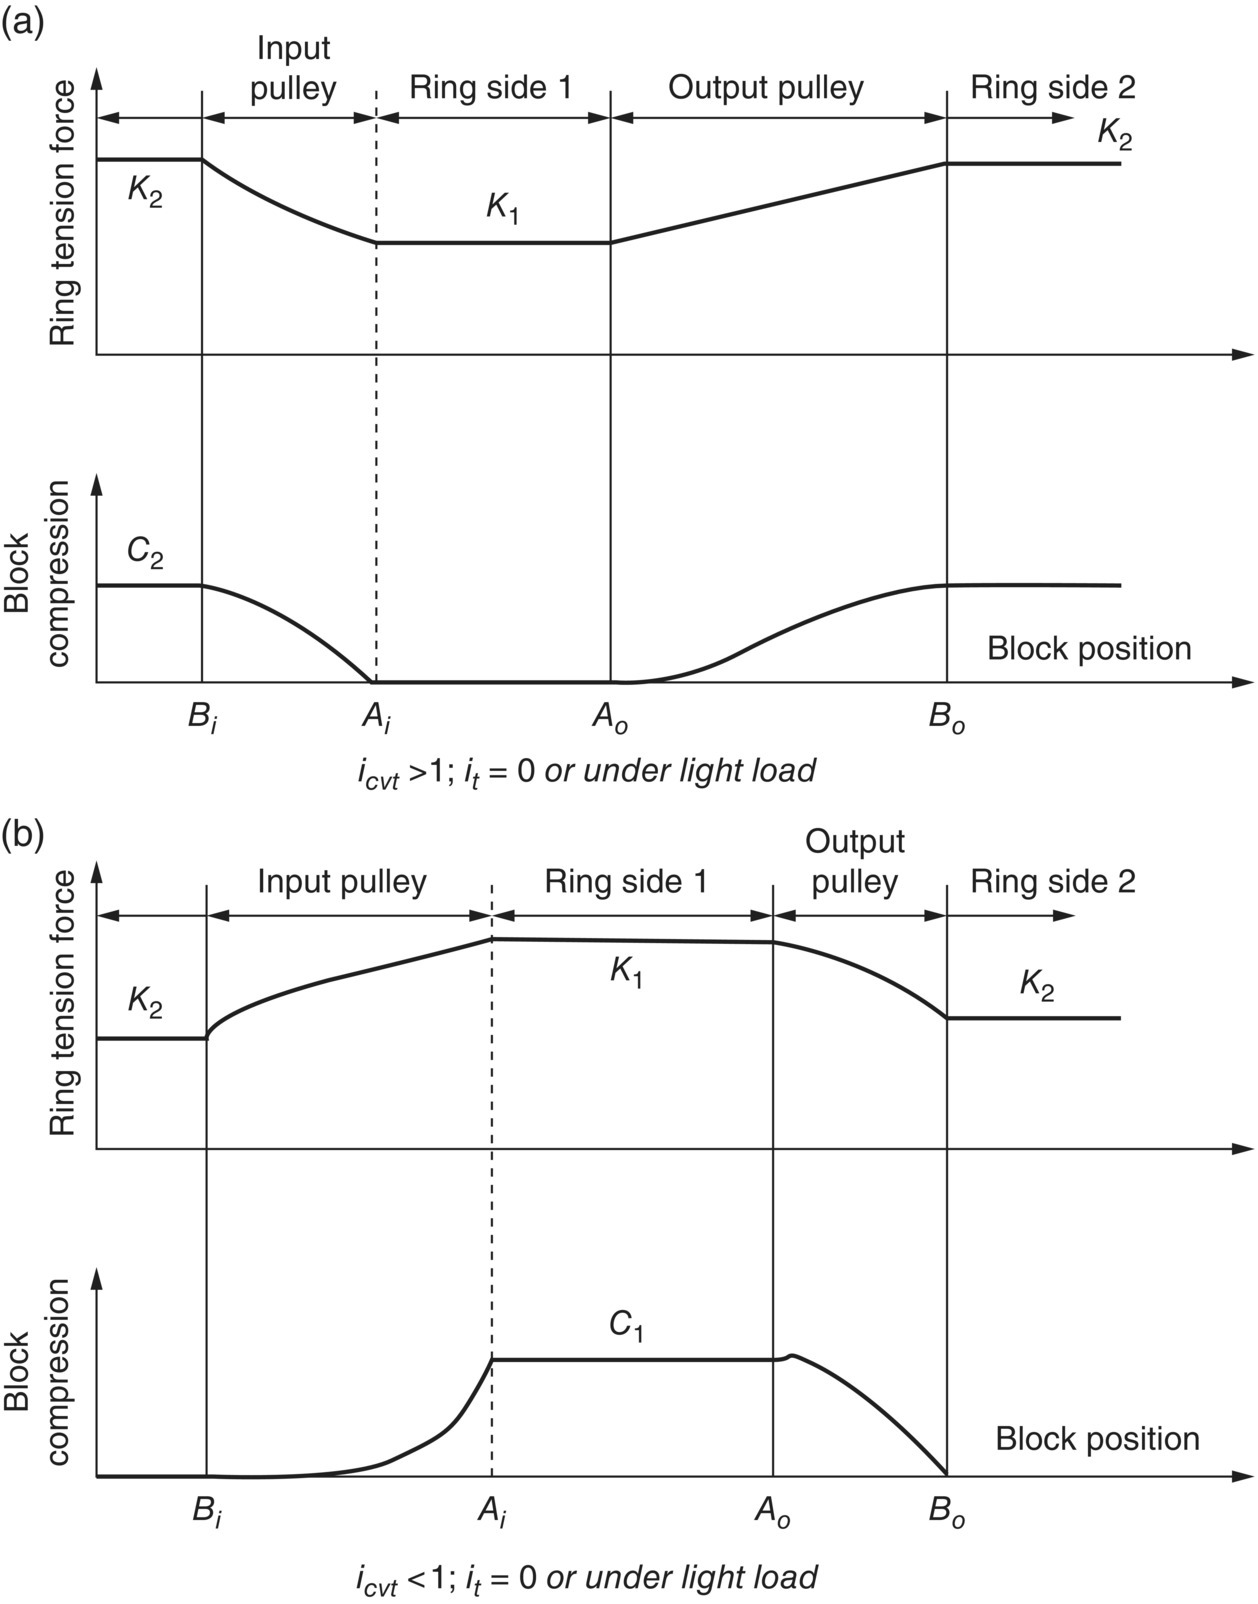
Figure 7.11 Ring tension and block compression distribution under light load conditions.
7.3.5 Forces Acting on the Whole Belt
The free body diagram of the belt assembly as a whole body is shown in Figure 7.12. In this free body diagram, the contact force N, the radial friction force μrN and the tangential friction force μtN are applied by the input and output pulleys respectively to the belt. When the CVT runs at a fixed ratio with a constant input angular velocity, the belt is in a dynamic equilibrium. However, blocks in the pulleys rotate with the pulley and there is a centrifugal acceleration for each block along the contact arc. Therefore, an inertia force, that is equal to  for a block in the input pulley and
  for a block in the output pulley, is added in the free body diagram based on the D’Alembert principle. Here, mi is the mass of each block.
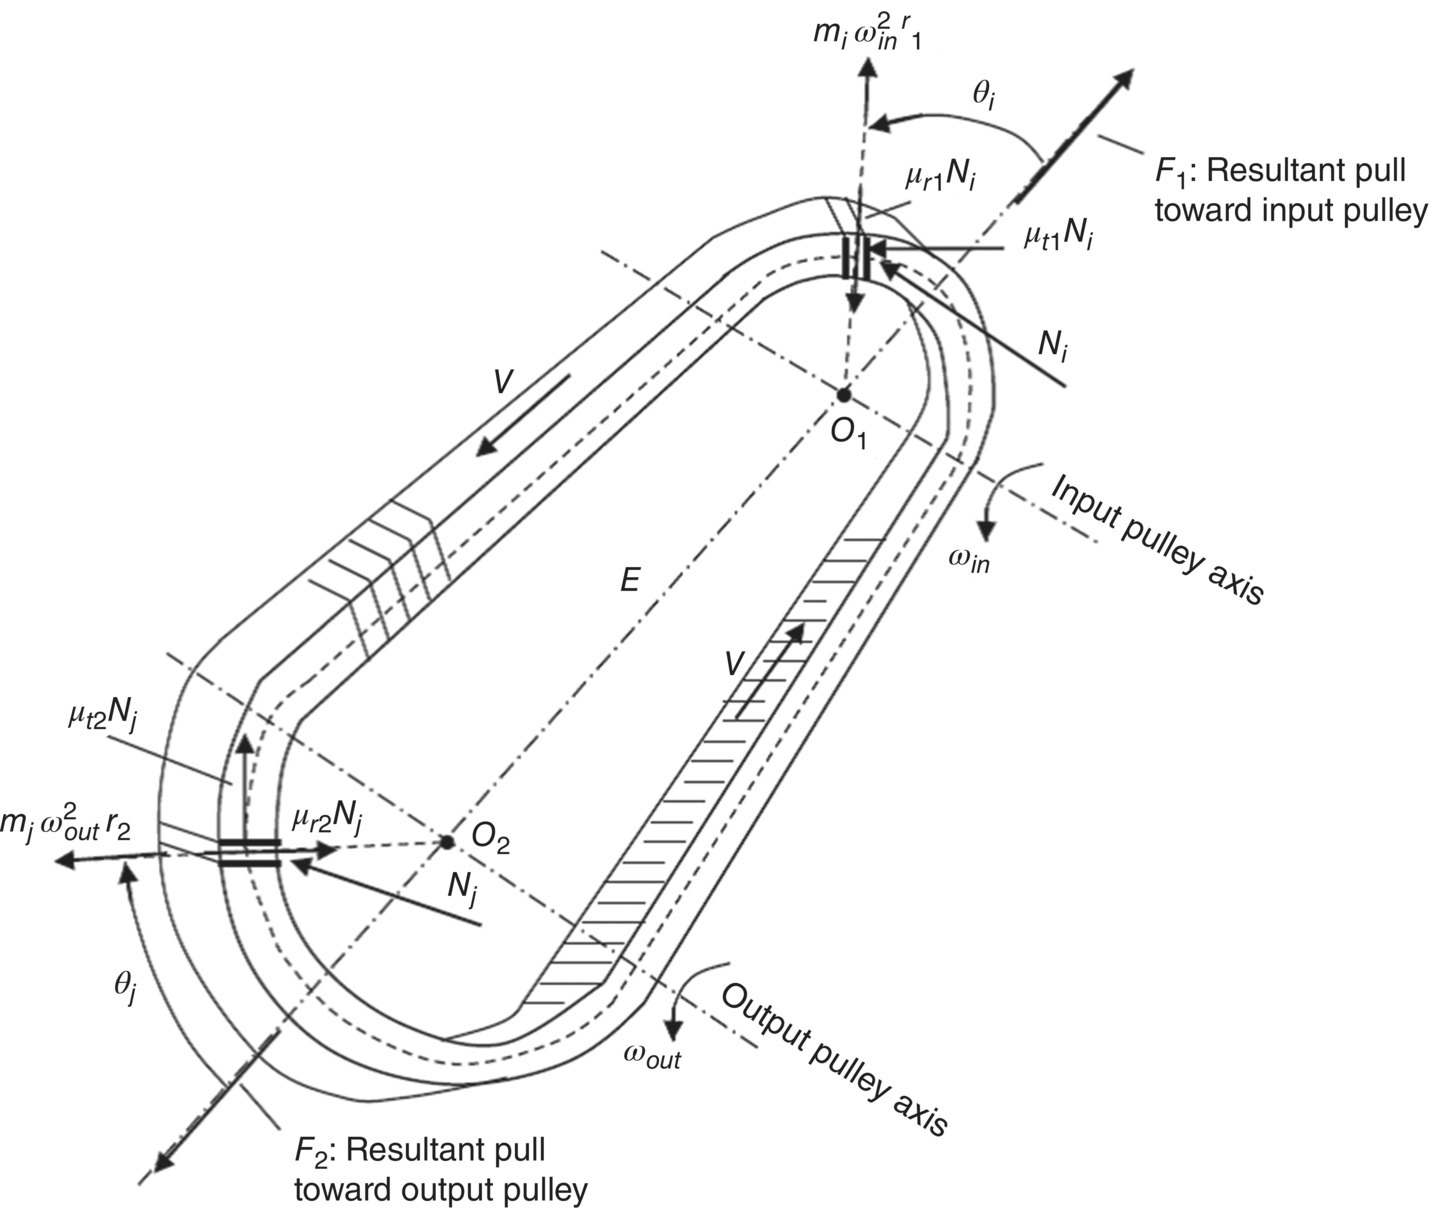
Figure 7.12 Forces acting on the belt as a whole body.
The reaction R that is applied by the ball splines to the movable sheave has been determined by Eq. (7.19). The magnitude of force R is equal to the sum of projections upon the CVT center line O1O2 of the contact force N, the radial friction force μrN, and the tangential friction force μtN applied on the belt by one side of the input or output pulley. Therefore, the sum of projections of all forces applied on the belt, including the inertia force, upon the center line O1O2 is represented for the input side and output side respectively:
where F1 and F2 are respectively the resultant force applied to the belt in the direction of the CVT center line on the input side and the output side. These two forces have the effect of pulling the belt toward the respective pulleys and are termed the resultant pull as denoted in Figure 7.12. Note that it is almost impossible to determine the resultant pulls using Eqs (7.21) and (7.22) because the distribution of the contact force N and the friction coefficients are not known under real time CVT operation conditions. However, the resultant pulls are affected primarily by the contact force N, which is related to the thrust forces Pin and Pout by Eqs (7.8) and (7.9). Clearly, the two resultant pulls must be equal in magnitude and opposite in direction during fixed ratio CVT operations, i.e.  . Here, Fs is sometimes called the axial force in CVT related technical publications.
It is apparent from Figure 7.9 that the resultant projection of the block compression force and ring tension on the CVT center line O1O2 is equal to the resultant pull or the axial force, as represented by:
where angle β is as defined in Figure 7.5. In some CVT related literature, a so‐called traction coefficient is defined as  . This traction coefficient is physically a measure on the effectiveness of the block compression force and ring tension for torque transmission since the magnitude of the axial force is proportional to the resultant torque transmitting force by just a factor of cos β, as shown in Eq. (7.23).
7.3.6 Relation between Thrusts on Input and Output Pulleys
The contact force is proportional to the thrust as defined by Eqs (7.8) and (7.9) respectively for the input and output pulleys. As mentioned previously, Eqs (7.12) and (7.13) cannot quantitatively define the ratio between the pulley thrusts, namely  , because the friction coefficients during real time CVT operations are indeterminate. This ratio is critical for CVT design and control for the following reasons:
- For a given CVT ratio, the maximum input torque that can be transmitted depends on the output pulley thrust force Pout, as indicated by Eq. (7.16). Therefore, the output pulley thrust force can be controlled at different magnitudes for a specified CVT ratio for the transmission of input torque at different levels. Usually, the thrust pulley force is generated by a hydraulic piston and its magnitude is controlled through the hydraulic pressure in the piston chamber. As mentioned previously, the hydraulic pressure should be controlled at a level just high enough for the transmission of the input torque intended for the vehicle operation status.
- Now that the output thrust Pout is controlled as mentioned above, what should then be the input pulley thrust Pin? Clearly, the input pulley thrust Pin must generate sufficient contact force for the contact between input pulley and the metal blocks so that the input torque can be transmitted from the input pulley without slippage. Meanwhile, the contact force generated by Pin must guarantee that the dynamic equilibrium of the belt is maintained, i.e.
 . This means that the hydraulic pressure in the input piston chamber must be exactly equal to a certain value to maintain the belt dynamic equilibrium.
 - It is theoretically possible to use two variable force solenoids, one for each movable pulley sheave, to control the hydraulic pressure in the input pulley piston chamber and in the output pulley chamber separately using feedback control. In practice, however, this control method needs active pressure control for both the input and output piston chambers with high accuracy to avoid control instability.
- In production CVTs, the hydraulic pressure in the piston chamber of the output pulley, pout, is actively controlled at the calibrated value corresponding to the input torque and the CVT ratio, but the hydraulic pressure in the piston chamber of the input pulley, pin, is not actively controlled. As detailed in the following section, the input piston chamber is isolated from the line pressure circuit and the CVT fluid is trapped inside during a fixed ratio operation. The thrust force on the output pulley Pout, that is proportional to pout, generates the contact force and the friction forces between the belt and the output pulley, which then generate the resultant pull F2 that would pull the belt toward the output pulley. However, the belt is tightly squeezed in the groove of the input pulley and cannot move toward the output side since the CVT fluid trapped in the input piston chamber is incompressible and does not allow the input movable sheave to move axially. Therefore, hydraulic pressure in the input piston chamber pin will build up as a reaction, which leads to the generation of the input pulley thrust force Pin and thus to the contact force and friction forces between the input pulley and the belt. The resultant pull F1 in Eq. (7.21) on the input side is then generated as a reaction to F2. Since F1 reacts to F2, the two forces are always the same in magnitude, i.e.
 .
. - As mentioned above, the hydraulic pressure pin in the input piston chamber is generated as a reaction during fixed ratio CVT operation. The value of pressure pin is inversely proportional to the input piston area. Knowing the ratio between the pulley thrusts under various CVT ratios and the torque ratios, the piston effective areas, Ain and Aout, can be optimized so that both hydraulic pressures pin and pout will be close to the line pressure or in the range conducive to CVT efficiency.
- During ratio changes, pressure pin is controlled by the line pressure of the CVT control system so as to control the motion of the belt in the pulley grooves. For ratio control responsiveness, the pressure pin before a shift is initiated should not differ too much from the line pressure. Knowing the pulley thrust ratio allows CVT control and calibration engineers to optimize piston chamber pressures and line pressure levels for all CVT operation conditions.
Analytical formulations on pulley thrusts for rubber belt drives was proposed decades ago by Gerber [5,6], Miloiu [7], and Worley [8,9]. The traction coefficient λ and the axial force Fs defined previously are used in the closed form formulations of the output pulley thrust by Miloiu and on the input pulley thrust by Worley, as represented respectively in the following equations:
where μ is the maximum friction coefficient between the block and the pulley groove surface and γ is the friction angle. To enhance the accuracy of these two equations for belt CVTs, Fujii et al. [19,20] introduced a so‐called effective friction coefficient μ′ defined as  to reflect the effect of the active contact arc in the pulley with the larger pitch radius, where ϕ1 and ϕ2 are the contact angles for the input and output pulleys as shown in Figure 7.5; α is the pulley groove angle; Pout is the output pulley thrust corresponding to the maximum transmitted torque Tmax defined by Eq. (7.16) for a given CVT ratio with the maximum effective friction coefficient μ′, i.e.
  . In the paper series [19–22], Fujii et al. further simplified Eq. (7.24) by linearizing the term
  as aλ (with
  ); this simplification does not affect the accuracy of the original equation proposed by Miloiu since the traction coefficient λ is in the range 0.25 –0.45 for the practical torque ratio range between 0.5 and 0.9. With this simplification, the first equation in Eq. (7.24) is rewritten as:
By substituting the traction coefficient  , Fujii et al. further transformed Eq. (7.26) into a quadratic equation in terms of the axial force Fs in the following form:
In this quadratic equation, A, B, and C can be calculated if the CVT ratio and the input torque are given. As indicated in the paper series of Fujii et al., for the torque ratio range  and CVT ratio range
  , the solution to the axial force Fs from Eq. (7.27) should be
  . After the axial force Fs is solved, Eq. (7.25) is then used to determine the input pulley thrust Pin. The procedure to determine the thrusts and the thrust ratio follows three steps: (a) the output pulley thrust Pout is determined using Eq. (7.16) for a specified maximum input torque Tmax at a given CVT ratio icvt with the maximum friction coefficient; (b) the input torque Tin is calculated as (itTmax) with
  and is then plugged into Eqs (7.28) and (7.27) for the determination of the axial force Fs; and (c) the axial force Fs is then plugged into Eq. (7. 25) to determine the input pulley thrust Pin, and the thrust ratio is then calculated as
  . In summary, the thrust ratio ε is a bi‐variable function of the CVT ratio and the torque ratio, i.e.
  , as determined by these three steps. For illustration purposes, the curve describing the relation between the thrust ratio ε and the CVT ratio icvt obtained by Fujii et al.’s modified formulation is shown in Figure 7.13 when the torque ratio it is equal to 0.77.
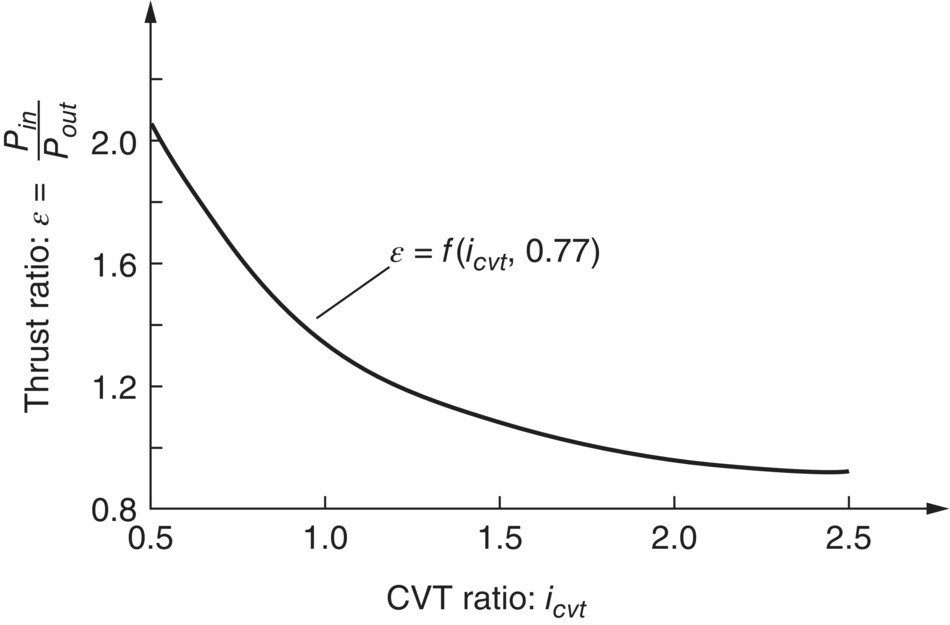
Figure 7.13 Typical thrust ratio plotted against CVT ratio.
As far as engineering application is concerned, experimental data represented in the paper series of Fujii et al. [19–22] have shown good agreement between the thrust ratios measured in testing and the thrust ratios that are calculated from the closed form formulation. The following summarizes the conclusions made in the paper series by Fujii et al. on the thrust ratio based on experimental data and analytical analysis:
- The thrust ratio at a specific CVT ratio icvt does not depend on the maximum transmittable torque defined by Eq. (7.16) and is only a function of the torque ratio it. Generally, the thrust ratio is a bi‐variable function of the CVT ratio and the torque ratio.
- The maximum transmittable input torque Tmax is proportional to the output pulley thrust Pout for a specified CVT ratio. Note that Tmax is the maximum input torque that is transmitted on the threshold of belt slippage when
 .
. - For any given CVT ratio, the thrust ratio is a near constant ε0 specific to the CVT ratio and is independent of the torque ratio it if
 . This means that the thrust ratio only depends on the torque load when it is light. If the input torque is higher than 0.4Tmax, it will not affect the thrust ratio significantly.
 - When
 , the near constant ε0 for thrust ratio mentioned above decreases as the CVT ratio increases. It remains higher than 1.0 and almost becomes equal to 1.0 when the CVT ratio is 2.0. This means that the input pulley thrust is always higher than the output pulley thrust when
  .
. - When
 , the thrust ratio is always higher than 1.0. This means that the input pulley thrust is always higher than the output pulley thrust for overdrive CVT operations.
 - The input pulley angular velocity has insignificant effect on the thrust ratio when the CVT ratio is above 1.0. At low CVT ratios, i.e.
 , the thrust ratio at low input pulley angular velocity is higher than the thrust ratio at high input pulley angular velocity.
7.3.7 Ratio Changing Mechanism
As discussed previously, when the CVT runs with a fixed ratio, the belt must be at dynamic equilibrium and the two pulling forces in Figure 7.12 must be equal, i.e.  . During a ratio changing process, this dynamic equilibrium must be broken so that the metal belt will move toward either the input or the output pulley as the metal blocks rise or fall in the pulley grooves. The motion of the belt assembly is complicated during ratio changes, but the motion of the belt mass center is constrained along the CVT center line O1O2 and is governed by the following equation:

where MB is the mass of the metal belt assembly and  is the acceleration of the belt mass center in the direction that coincides with the CVT center line O1O2 as shown in Figure 7.12. During a ratio change,
  and
and  . In an upshift, the belt moves with its mass center toward the input pulley as the pitch radius r1 increases and the pitch radius r2 decreases, and in a downshift, the belt moves toward the output pulley as the pitch radius r2 increases and the pitch radius r1 decreases. It is therefore apparent that the two pulling forces F1 and F2 must observe respectively the following qualitative relations during CVT fixed ratio operation, upshift process and downshift process:

As shown in Figure 7.11 and represented by Eqs (7.21) and (7.22), the two pulling forces are related to the contact forces on the input and output pulleys. The contact forces are related to the pulley thrusts which depend on the piston chamber hydraulic pressures as illustrated in Figure 7.3. As mentioned previously, the hydraulic pressure in the output pulley piston chamber is actively controlled to generate the required thrust force, which also generates the pulling force F2, and the hydraulic pressure in the input pulley piston chamber is generated as a reaction to resist the pulling of the metal belt by F2.
7.4 CVT Control System Design and Operation Control
This section represents the CVT control system designs that implement the mechanisms of CVT torque transmission and ratio change analysed in the previous section. There are two basic design architectures for belt CVT control: one uses two variable force solenoids (VFS) or variable bleed solenoids (VBS) to control separately the pressures in the piston chambers of the movable sheaves, as shown in Figure 7.14, and is hereafter termed a VBS based control system. The other uses a servo mechanism to control the pressure in the piston chambers, as shown in Figure 7.15 and is termed a servo mechanism control system. Both control system architectures share the same circuit designs for the line pressure control and the torque converter clutch control shown in Figure 7.14.
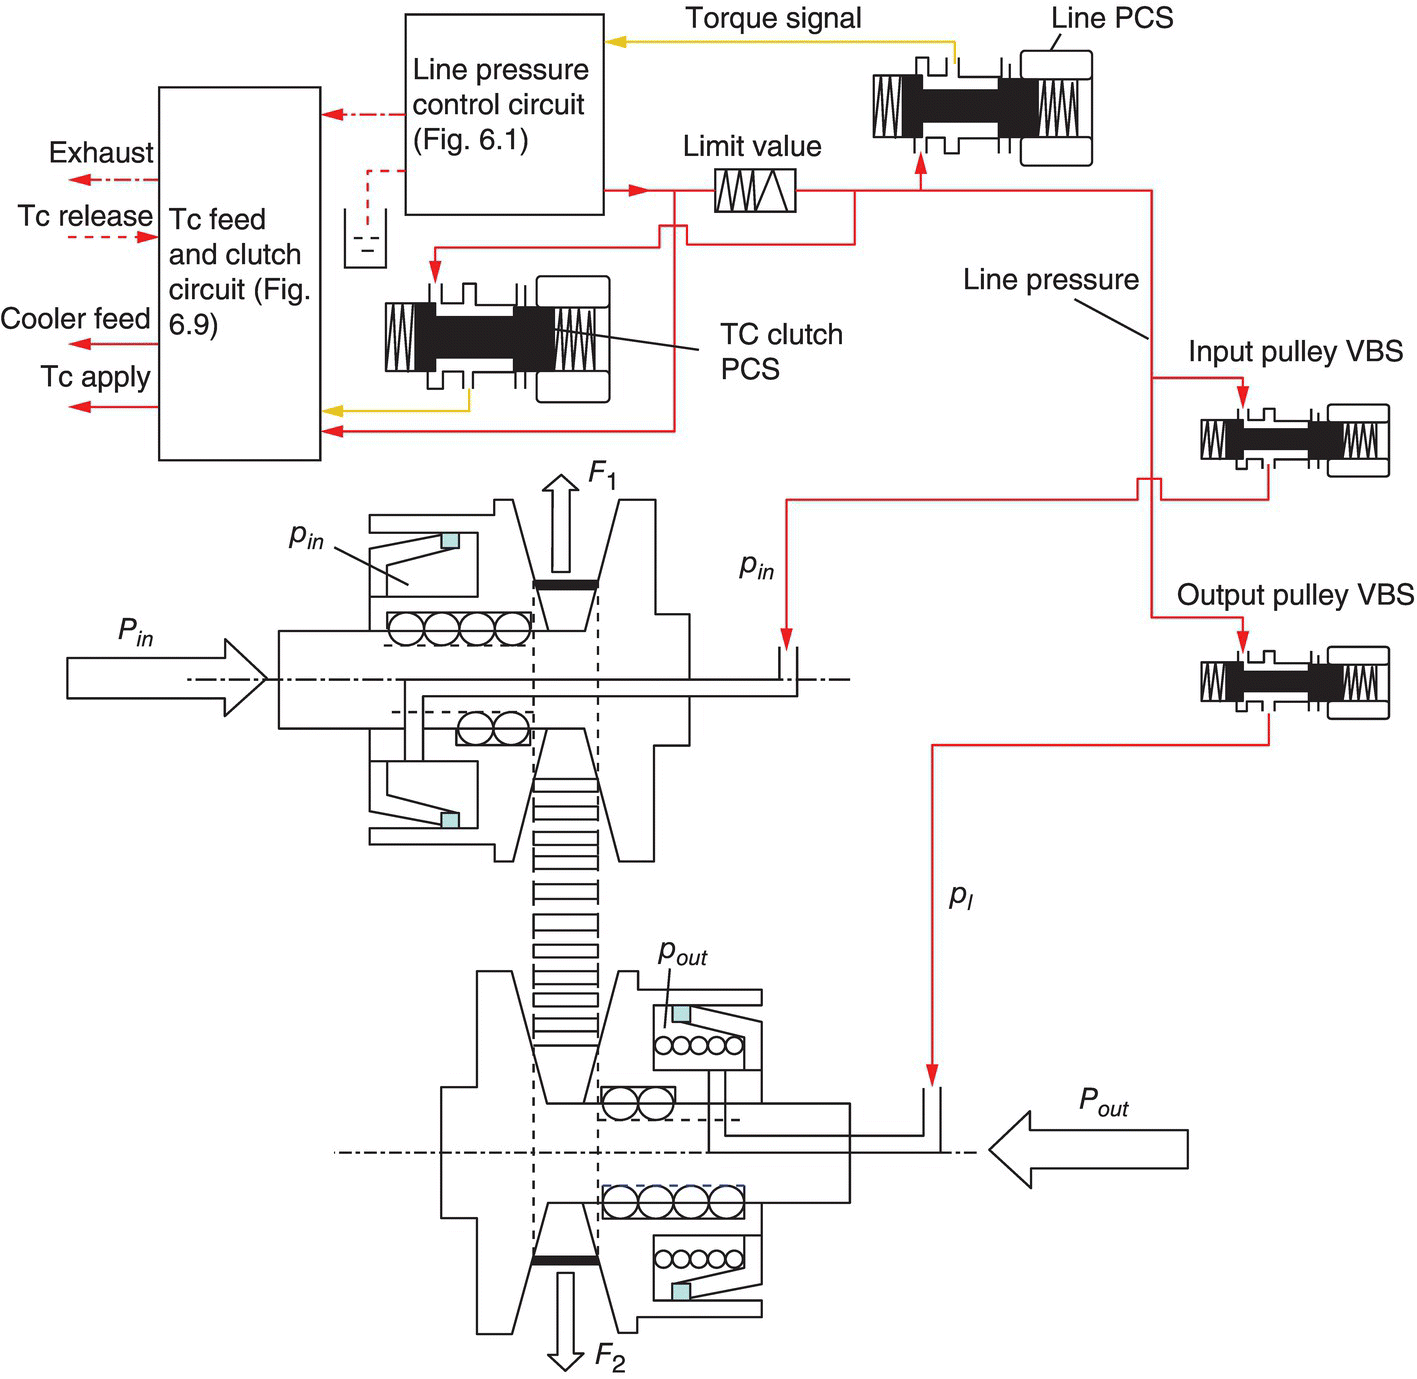
Figure 7.14 CVT VBS based control system design.
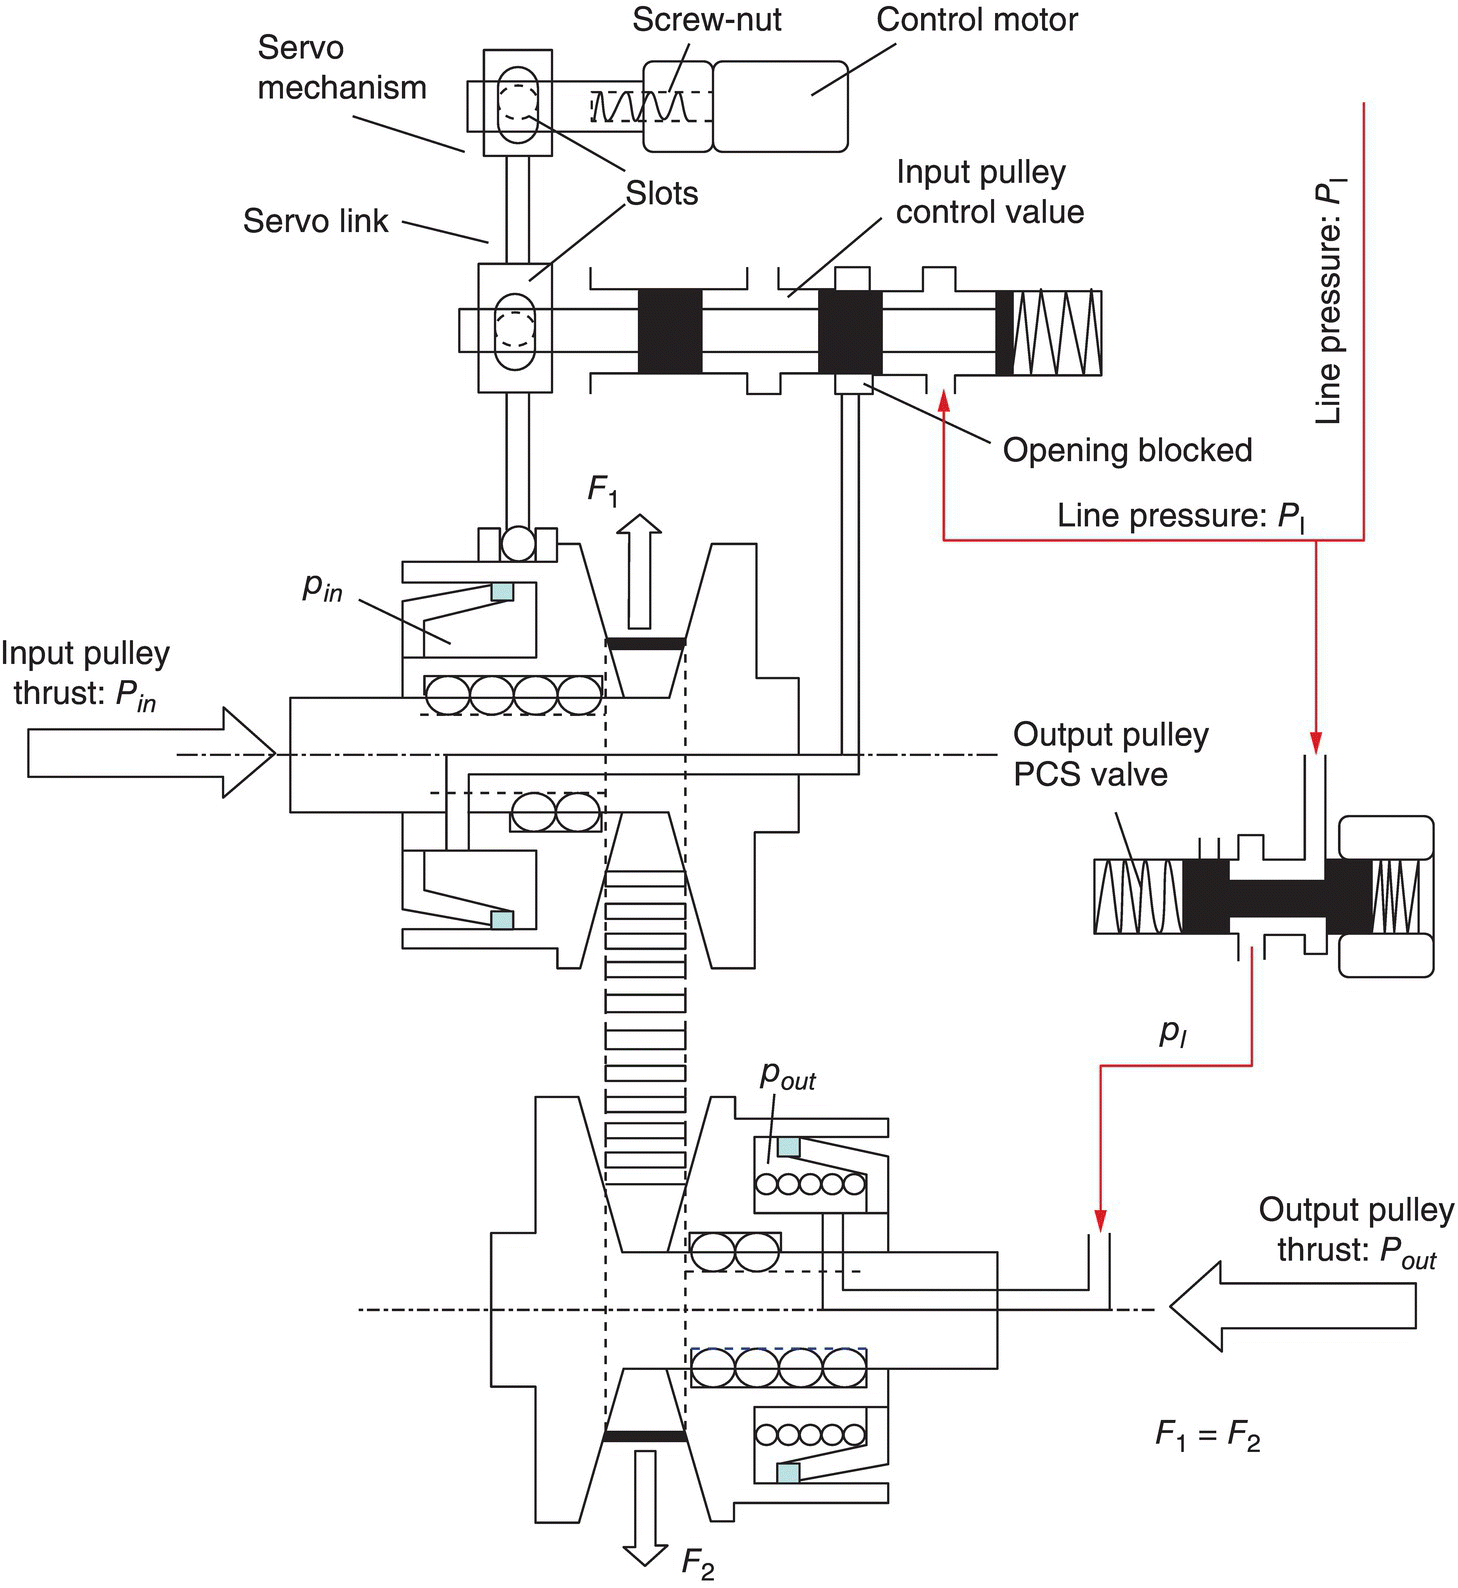
Figure 7.15 CVT servo mechanism control system design.
The hydraulic circuits for the control of system line pressure and the operation of the torque converter clutch were presented in detail in Chapter 6. These circuits are basically the same for CVT control systems and will not be repeated in this section.
7.4.1 VBS Based Control System
As shown in Figure 7.14, the pressure in the piston chamber of the input pulley movable chamber pin is controlled by the input pulley VBS, and the pressure in the piston chamber of the output pulley movable chamber pout is controlled by the output pulley VBS. Note that the input pulley VBS has a position that fully blocks the line pressure CVT fluid from entering the piston chamber, so that the CVT fluid trapped in the piston chamber will be isolated from the line pressure circuit. The operations of this control system is described in the following.
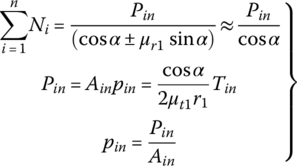
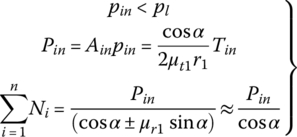
Fixed ratio operation: When the CVT operates with a fixed ratio, the input pulley VBS is controlled to be at the position that fully blocks the valve out‐port that is linked to the input piston chamber, meanwhile the output pulley VBS is controlled at the position that fully connects the line pressure circuit to the output piston chamber. Therefore, the hydraulic pressure in the output piston chamber, pout, is equal to the line pressure pl. The output pulley thrust Pout is actively generated by pressure pout and thus produces the resultant pulling force F2 that tends to pull the metal belt towards the output pulley, as formulated in Eqs (7.9) and (7.22). However, the CVT fluid trapped in the input piston chamber is incompressible and does not allow any axial displacement of the input pulley movable sheave. As a result, the metal belt is tightly pinched in the pulley grooves, creating the contact force between the input pulley and the metal blocks and the friction forces with it. Consequently, the input pulley thrust Pin is generated as a reaction. During fixed ratio operations, the following equations are observed:
where r1 is the input pulley pitch radius which corresponds to a specific CVT ratio icvt; Tin is the input torque that needs be transmitted; and Ain and Aout are respectively the effective piston area of the input pulley and the output pulley. Note here that the sum of the contact forces on the output pulley  can be determined by Eq. (7.31) if the line pressure pl is given, but the sum of contact forces on the input pulley
  cannot be determined by Eq. (7.33) unless the thrust ratio is otherwise determined, for example, by the function
  pertaining to Eqs (7.24) and (7.25).
Upshift operation: When the CVT is in the process of an upshift, the input pulley VBS is controlled to be at the position that partially opens the line pressure circuit to the input piston chamber, as shown in Figure 7.14. Meanwhile, the output pulley VBS is controlled at the position that bleeds the CVT fluid in the output piston chamber to the exhaust circuit. In this setup, the pressure in the input piston chamber pin increases, and the pressure in the output piston chamber pout decreases simultaneously, making F1 larger than F2. This breaks the dynamic equilibrium of the metal belt before the upshift is initiated, and the belt starts to move toward the input pulley because  . As the belt moves toward the input pulley, the CVT ratio decreases toward the target value, with input pulley pitch radius r1 increasing and output pulley pitch radius r2 decreasing. During the upshift process, both pressures pin and pout are controlled by the input pulley VBS and the output pulley VBS respectively based on the feedback on the real time CVT ratio, which is calculated via the input and output angular velocities measured by the respective speed sensors. As soon as the target CVT ratio is achieved, the input pulley VBS will be controlled at the position that fully blocks the valve out‐port linked to the input piston chamber and the output pulley VBS will be controlled at the position that fully connects the line pressure circuit to the output piston chamber. The CVT then operates with the target ratio. During upshift operations, the following equations are observed:


Downshift operation: When the CVT is in the process of a downshift, the output pulley VBS remains at the position that links the line pressure circuit to the output piston chamber, as shown in Figure 7.14. Meanwhile, the input pulley VBS is controlled at the position that bleeds the CVT fluid in input piston chamber to the exhaust circuit. In this setup, the pressure in the input piston chamber pin decreases and the pressure in the output piston chamber pout is almost the same as the line pressure, making F2 larger than F1. This breaks the dynamic equilibrium of the metal belt before the downshift is initiated, and the belt starts to move toward the output pulley because  . As the belt moves toward the output pulley, the CVT ratio increases toward the target value. During the downshift process, both pressures pin and pout are controlled by the input pulley VBS and the output pulley VBS respectively based on the feedback on the real time CVT ratio. As soon as the target CVT ratio is achieved, the input pulley VBS and the output pulley VBS will be controlled at the positions for fixed ratio CVT operation. The CVT then operates with the downshifted target ratio. During downshift operations, the following equations are observed:


7.4.2 Servo Mechanism Control System
Instead of using two variable bleed solenoids, the servo mechanism CVT control system uses two simpler valves for the control of input piston chamber pressure and the output piston chamber pressure. Figure 7.15 shows the structural layout of this control system. As shown in Figure 7.15, the output pulley pressure control valve (PCS) can be positioned to connect the line pressure with the output piston chamber or to bleed the CVT fluid in the output piston chamber to the exhaust circuit. The input pulley control valve has three positions: one fully blocks the port to the input piston chamber, the other connects the line pressure with the input piston chamber, and the third bleeds the CVT fluid in the input pulley piston chamber via the exhaust port. The valve body of the input pulley control valve is connected to the servo link by a pin‐slot joint. The screw‐nut converts the rotation of the control motor to a linear displacement at the top end of the servo link, also via a pin‐slot joint.
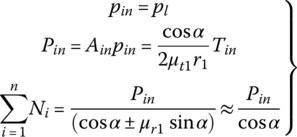
Fixed ratio operation: The positions of the input pulley control valve and the output pulley PCS valve are shown in Figure 7.15 when the CVT operates with a fixed ratio. The output pulley PCS valve directly connects the line pressure circuit to the output piston chamber, thus the hydraulic pressure in the output pulley piston is the same as the line pressure, i.e.  . The input pulley control valve is controlled at the position that fully blocks the valve port to the input piston chamber. The output pulley thrust Pout is actively generated by pressure pout and thus produces the resultant pulling force F2 which tends to pull the metal belt toward the output pulley, as formulated in Eqs (7.9) and (7.22). However, the CVT fluid trapped in the input piston chamber is incompressible and does not allow the any axial displacement of the input pulley movable sheave. As a result, the metal belt is tightly pinched in the pulley grooves, creating the contact force between the input pulley and the metal blocks and the friction forces with it. Consequently, the input pulley thrust Pin is generated as a reaction. Note that there is no difference in fixed ratio operations between the servo mechanism control system and the VBS based control system discussed previously. During fixed ratio operations, the following equations are observed, which are identical to Eqs (7.31), (7.32) and (7.33) and are repeated here for reader’s convenience:
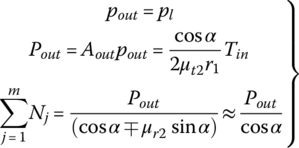

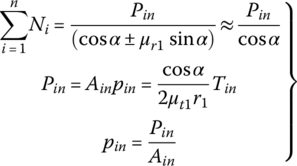
As shown by Eq. (7.16), the maximum input torque Tmax that can be transmitted for a given CVT ratio depends on the output thrust force Pout. Therefore, if the input torque Tin that needs to be transmitted under a specific CVT ratio icvt is given, then the output thrust force  and the corresponding line pressure
  that are required for the CVT to transmit the input torque at the belt slippage threshold, i.e. when
  , are determined as follows:
where μmax is the maximum friction coefficient between the metal belt and the pulley surface. If the line pressure pl is controlled at  determined by Eq. (7.43), the CVT can then barely transmit the input torque Tin; in other words, the torque ratio it would be 1.0. This would let the CVT operate under the slippage threshold. In CVT control practice, the line pressure pl should be controlled at a higher value so that the torque ratio it is in the range of 0.7
  0.9, as recommended by Fujii et al. [19–22] based on experimental data. The line pressure pl and the output pulley thrust force Pout are then determined by the following equations:
Upshift operation: When the CVT transmission control unit (TCU) decides to make an upshift, it will command the control motor to rotate and the motor rotation is converted to a linear displacement ΔM at the top end of the servo link, as shown in Figure 7.16. Consequently, the valve body of the input pulley control valve moves to the left with a displacement ΔV as the servo link pivots about the joint on the input pulley movable sheave. This opens up the valve port to the input piston chamber and increases the hydraulic pressure in it, pin, toward the line pressure pl. Meanwhile, the output pulley PCS is controlled at the position that connects the output piston chamber to the exhaust circuit as shown in the figure, decreasing the pressure in the output piston chamber, pout. This breaks the dynamic equilibrium of the metal belt before the upshift is initiated, both the input and output pulley movable sheaves move to the right and the belt starts to move toward the input pulley because  .
.
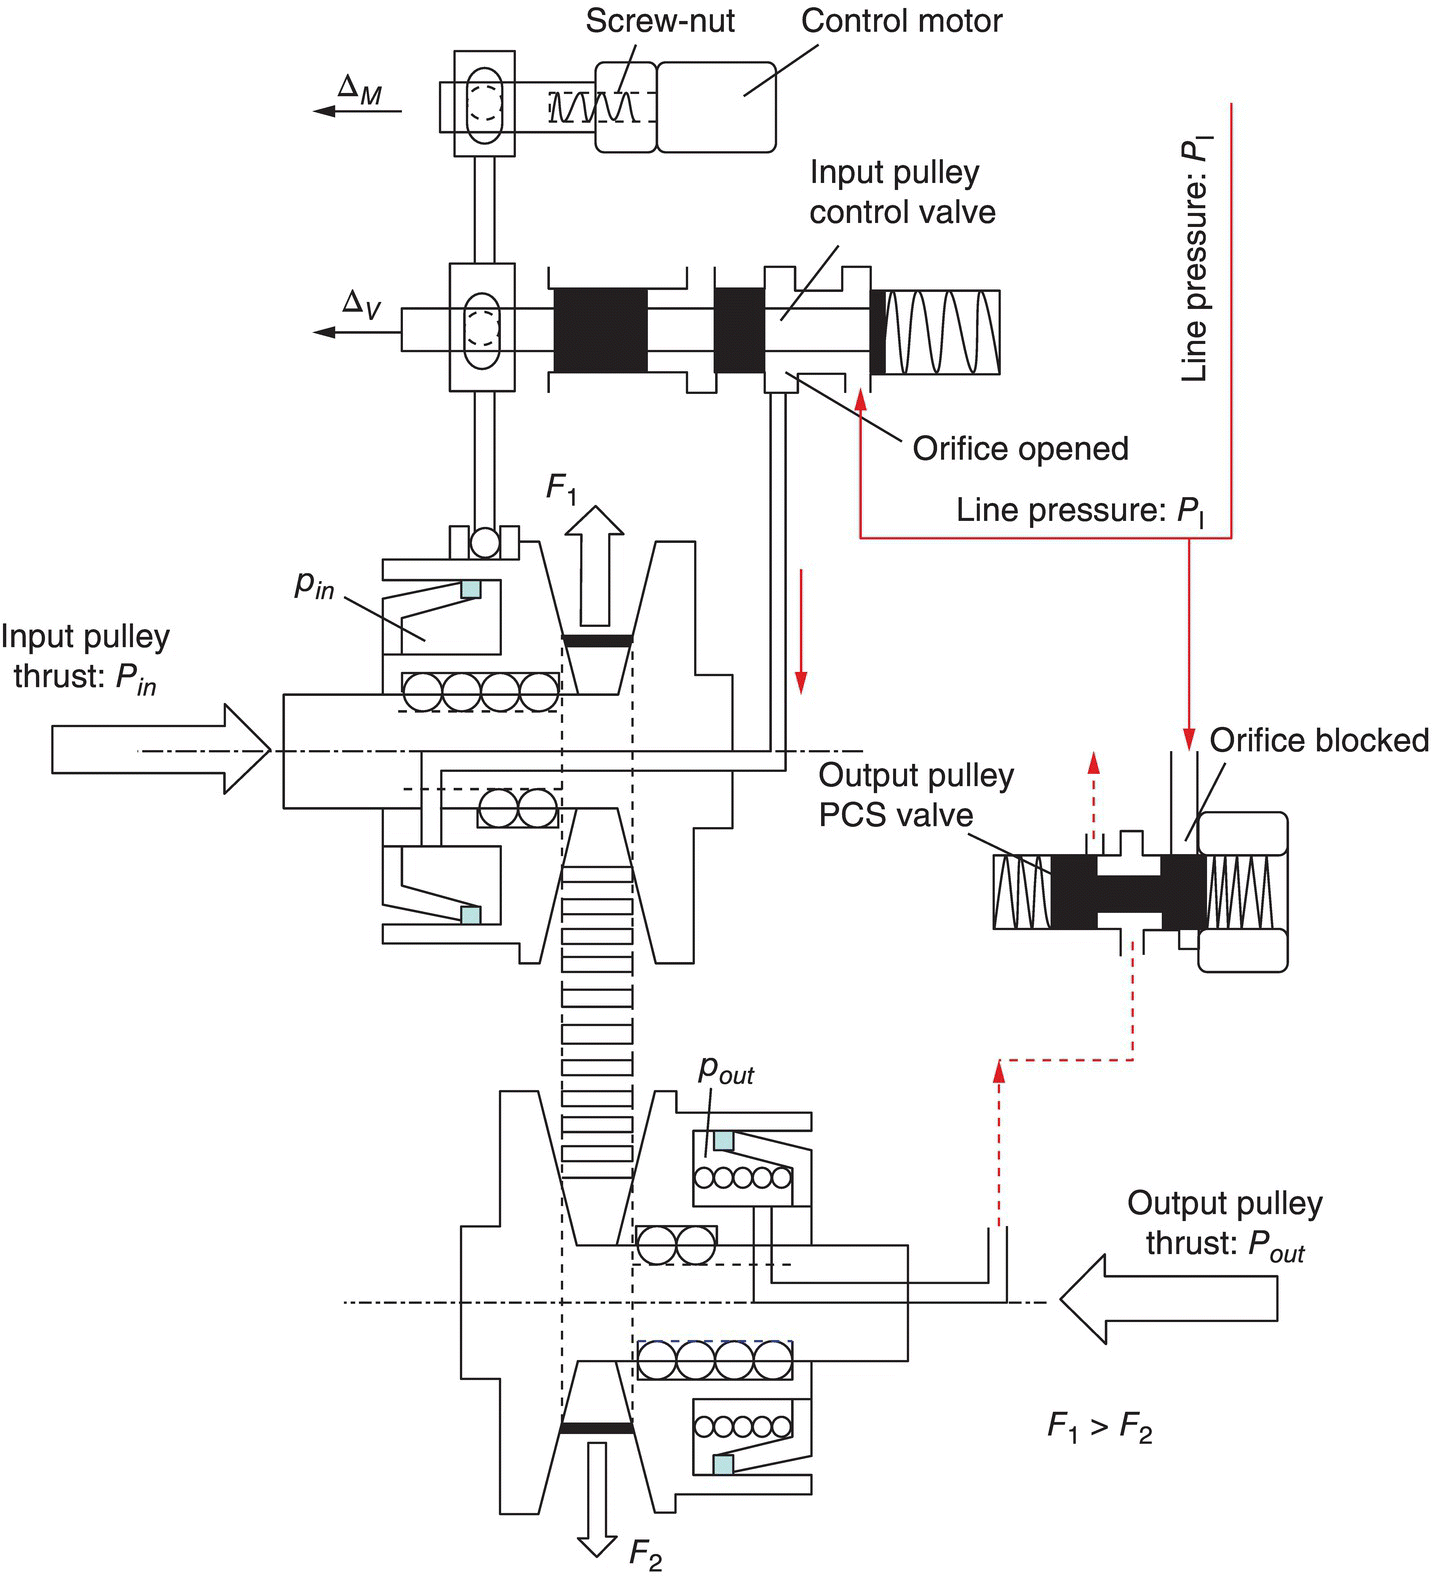
Figure 7.16 Initiation of upshifts in CVT servo mechanism control system.
As the belt moves toward the input side, pitch radius r1 increases and pitch radius r2 decreases, lowering the value of the CVT ratio icvt. Meanwhile, as the input pulley movable sheave moves to the right side with displacement Δs1, it carries the low end of the servo link with the same displacement, as shown in Figure 7.17. As can be observed from the figure, the displacement Δs1 causes the valve body to move to the right side via the servo link. This valve body movement is in the direction to close the valve port to the input piston chamber. Therefore, the control motor generates displacement ΔM that causes the valve body to move to the left and consequently opens up the valve port to the input piston chamber, forcing the input moveable sheave to move to the right with displacement Δs1. But the displacement Δs1 moves the valve body toward the closed position against the effect of displacement ΔM.
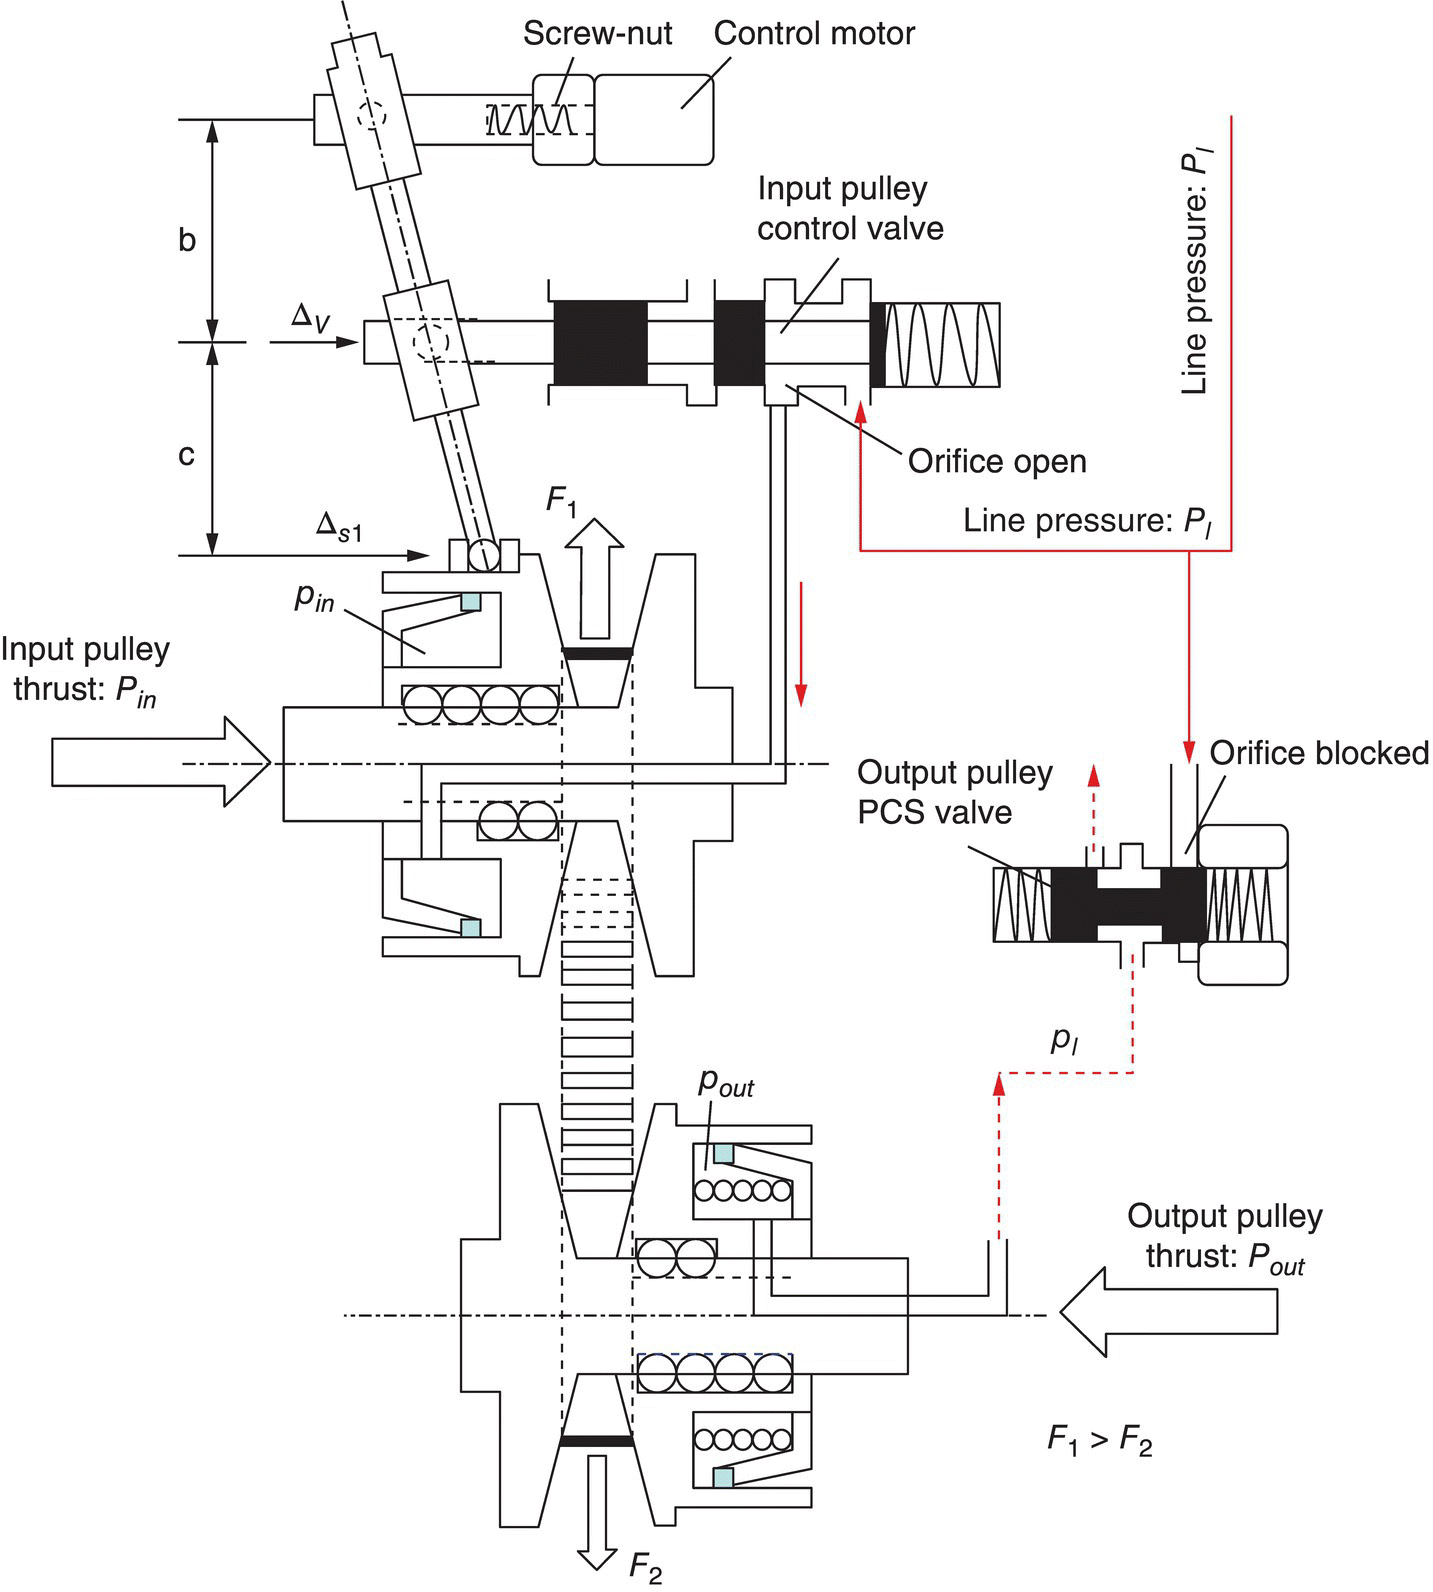
Figure 7.17 Operation of servo mechanism during upshifts.
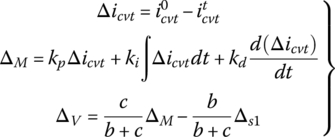
The three displacements of the servo mechanism are linearly related, with ΔM as the actuator. During an upshift, the motor rotation angle, i.e. displacement ΔM, can be controlled by a PID as given by:
where b and c are the proportion factors of the servo link as shown in Figure 7.17,  and
and  are the target CVT ratio and the real time CVT ratio calculated based on the speeds of the input and output pulleys measured by speed sensors, and kp, ki, and kd are respectively the proportional, integral, and differential factors of the PID controller.
During the upshift process, the pressure in the exhaust circuit is also controlled so that the pressure in the output piston chamber will be ramped down slowly. In addition, the speeds of both the input and output pulleys, as well as the pressures in the input and output piston chambers, are measured by the respective sensors on a real time basis. The data from these sensors are processed to determine the instantaneous CVT ratio and the likelihood of belt slippage during the shift process. Once slippage is deemed likely, the controller will signal the engine controller via the control area network (CAN) to reduce the engine output torque by spark retarding or other means. The following equations are observed during an upshift process:

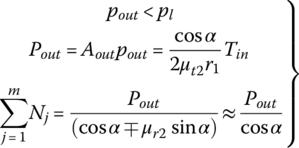
As can be observed from Eq. (7.46), if the line pressure pl and the input torque Tin are known, the thrust force on the input pulley Pin and the friction coefficient μt1 can be calculated by Eq. (7.46). The sum of contact forces on the input pulley  can also be calculated if the term (μr1 sin α) is neglected. To initiate the upshift responsively, the effective piston area of the input pulley should be designed larger than that of the output pulley, that is,
  , such that the hydraulic pressure in the input piston is lower than the line pressure when the CVT runs at the fixed ratio before the upshift is initiated. The ratio between the effective piston areas, i.e.
  , should be optimized according to the ratio between the thrust forces shown in Figure 7.13 for a given CVT design. During an upshift, the value of the tangential friction coefficient μt1 should be below the maximum friction coefficient μmax to avoid belt slippage on the input pulley, i.e.
  . This inequality is readily satisfied because the pressure in the input piston chamber pin is the line pressure pl during the upshift process, which is higher than the pressure in the piston chamber before the upshift is initiated. To avoid slippage on the output pulley, the tangential friction coefficient μt2 must also be lower than the maximum friction coefficient μmax, i.e.
  . This means that the CVT fluid in the output piston chamber must be controlled to bleed through the opening in the output pulley PCS valve, as shown in Figure 7.17, so that pressure pout drops gradually in small decrements. If necessary, the engine torque will be reduced during shifts to guarantee that there is no slippage on the output pulley, as mentioned previously.
As the input pulley movable sheave moves further to the right, the target CVT ratio  will be gradually reached. Meanwhile, the opening in the valve port to the input piston chamber diminishes and eventually closes. The CVT fluid in the input piston chamber is then blocked off from the line pressure. As soon as the input pulley control valve fully blocks the valve port to the input piston chamber, the output pulley PCS valve will be controlled to move to the position that connects the line pressure with the output piston chamber, as shown in Figure 7.18. This completes the upshift process and the CVT then runs at the target ratio
  .
.
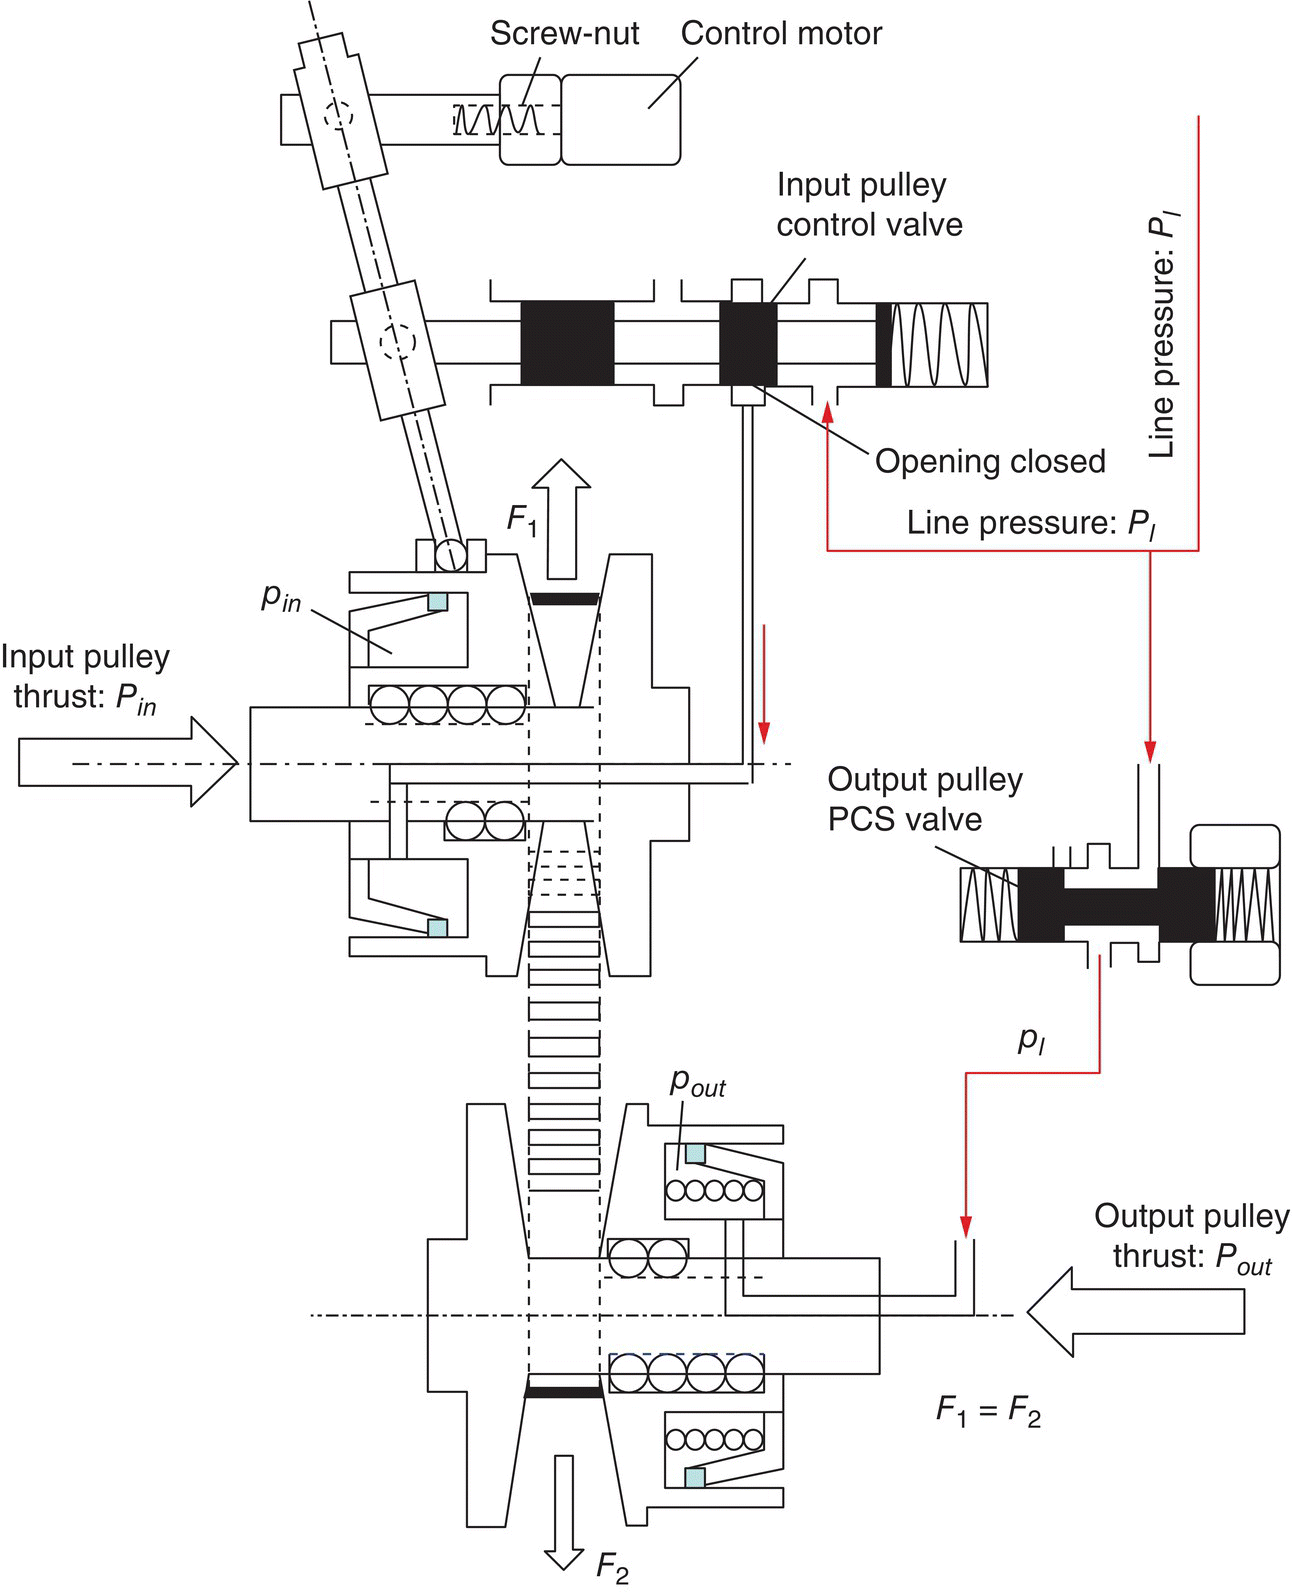
Figure 7.18 Completion of upshifts in CVT servo mechanism control system.
Downshift operation: When the CVT transmission control unit (TCU) decides to make a downshift, it will signal the control motor to rotate in the direction opposite to that for upshifts. The displacement ΔM at the top end of the servo link is then directed to the right, as shown in Figure 7.19. Consequently, the valve body of the input pulley control valve moves to the right with a displacement ΔV. This connects the input piston chamber with the exhaust circuit, while still blocking the line pressure from the input piston chamber, as shown in Figure 7.19. The output pulley PCS valve is still at the same position as in fixed ratio operation. Therefore, the hydraulic pressure in the input piston chamber, pin, decreases as CVT fluid bleeds through the valve opening to the exhaust circuit, and the hydraulic pressure in the output pulley pout remains to be equal to the line pressure pl. This breaks the dynamic equilibrium of the metal belt before the downshift is initiated, both the input and output pulley movable sheaves then move to the left and the belt starts to move toward the output pulley because  .
.
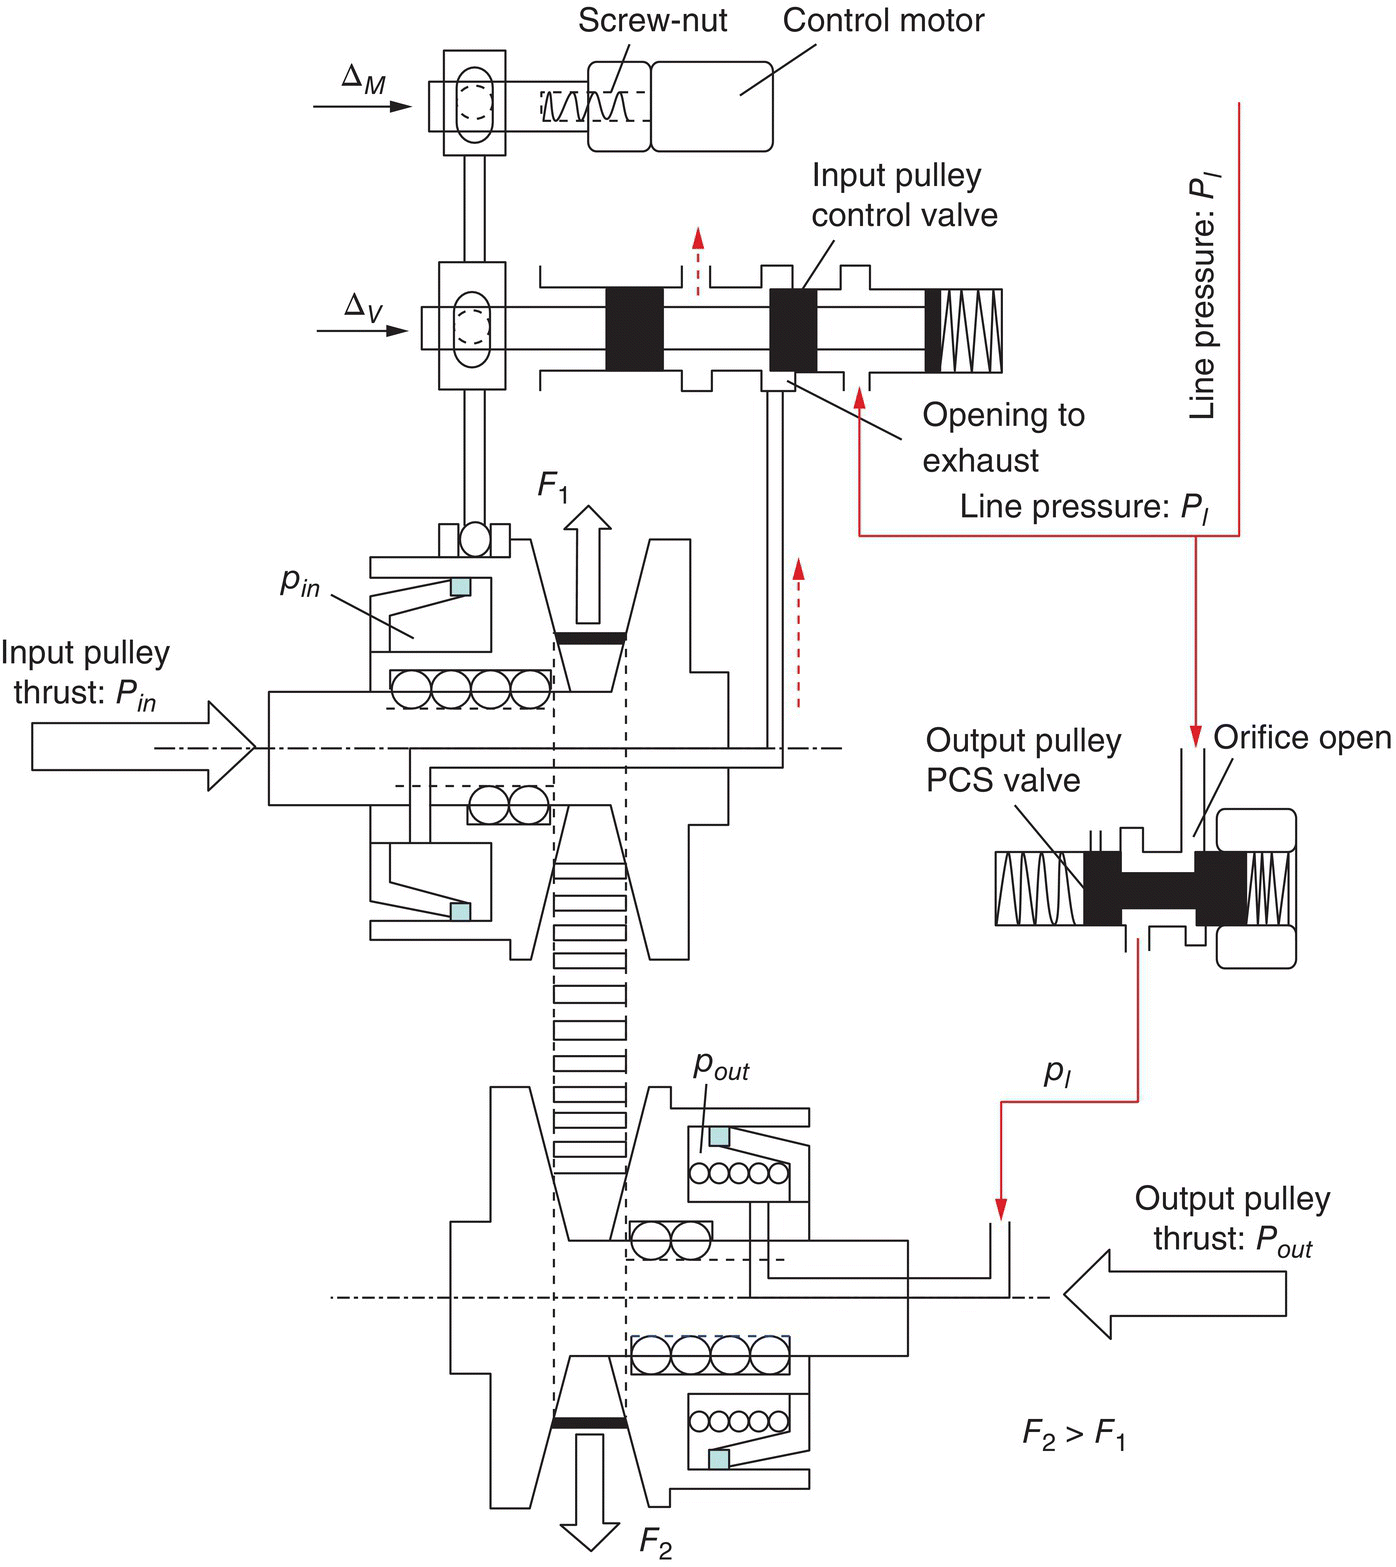
Figure 7.19 Initiation of downshifts in CVT servo mechanism control system.
As the belt moves toward the output side, pitch radius r2 increases and pitch radius r1 decreases, raising the value of the CVT ratio icvt. Meanwhile, as the input pulley movable sheave moves to the left side with displacement Δs1, it carries the low end of the servo link with the same displacement, as shown in Figure 7.20. As can be observed from the figure, the displacement Δs1 causes the valve body to move to the left side via the servo link. This valve body movement is in the direction to close the valve port to the input piston chamber. Therefore, the control motor generates displacement ΔM which causes the valve body move to the right and consequently links up the input piston chamber with the exhaust circuit via the valve port opening, forcing the input moveable sheave to move to the left with displacement Δs1. But the displacement Δs1 moves the valve body toward the position that blocks the valve port to the input piston chamber, against the effect of displacement ΔM.
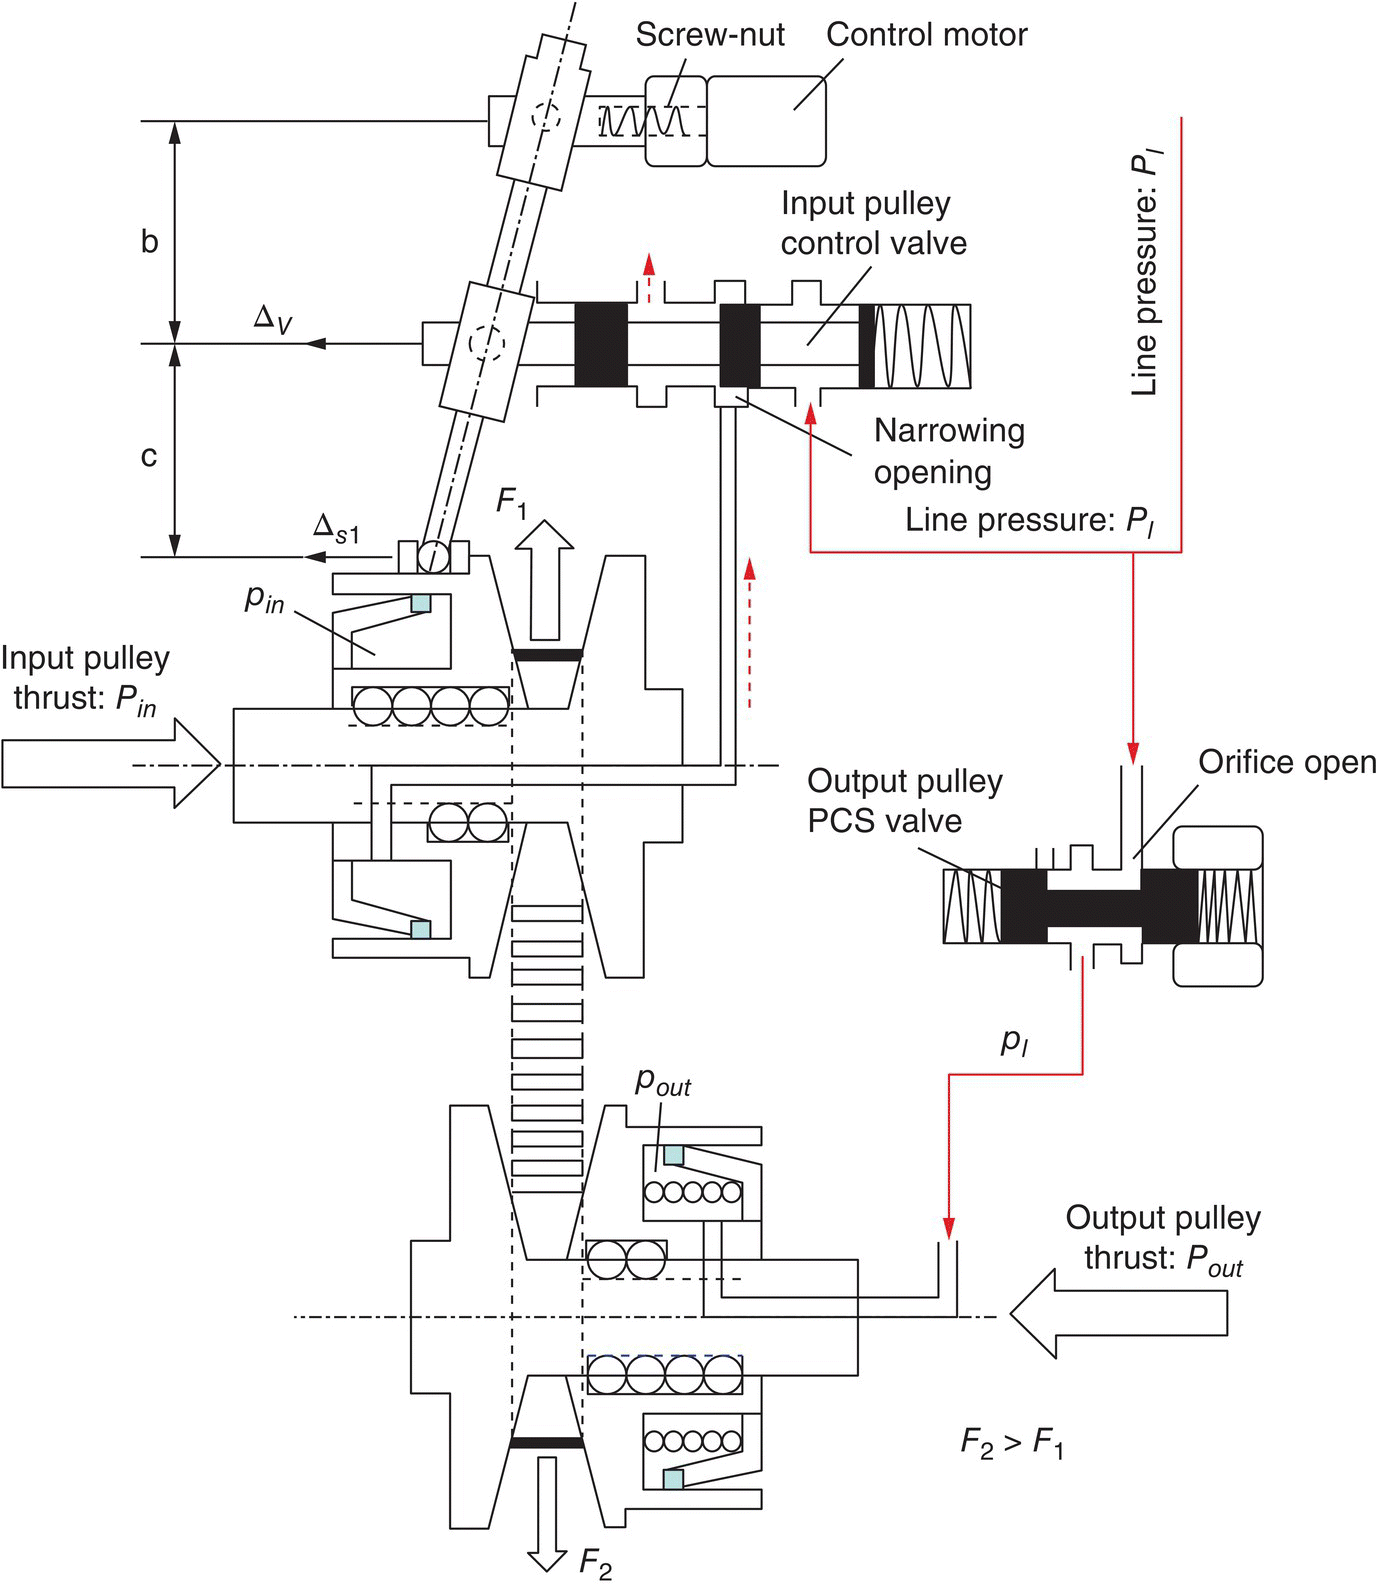
Figure 7.20 Operation of servo mechanism during downshifts.
For the downshift process, the relation between the three displacements of the servo mechanism and the PID controller for the motor rotation angle are similar to Eq. (7.45). During the downshift process, the pressure in the input piston chamber is controlled by the servo mechanism to decrease gradually. Similar to upshifts, the speeds of both the input and output pulleys, as well as the pressures in the input and output piston chambers, are measured by the respective sensors on a real time basis. The data from these sensors are processed to determine the instantaneous CVT ratio and the likelihood of belt slippage during the shift process. Once slippage is deemed likely, the controller will signal the engine controller via the CAN, to reduce the engine output torque by spark retarding or other means. The following equations are observed during a downshift process:


As can be observed from Eq. (7.49), if the line pressure pl and the input torque Tin to be transmitted are known, the thrust force on the output pulley Pout and the friction coefficient μt2 can be calculated by Eq. (7.49). The sum of contact forces on the output pulley  can also be calculated if the term (μr2 sin α) is neglected. Note that the dynamic equilibrium of the CVT belt is broken as soon as the downshift is initiated regardless of the value of the input piston chamber pressure. This is because the input piston chamber pressure that keeps the belt in dynamic equilibrium when the CVT runs at the fixed ratio before the downshift is lowered instantaneously, as soon as the piston chamber is connected to the exhaust circuit via the valve opening. During a downshift, the value of the tangential friction coefficient μt1 should be below the maximum friction coefficient μmax to avoid belt slippage on the input pulley, i.e.
  . This inequality is satisfied by controlling the pressure in the input piston chamber pin to be above what is required for input torque transmission. The slippage on the output pulley is readily avoided since the output piston chamber pressure pout is the same as the line pressure pl, which has been controlled to be high enough in the fixed ratio operation before the downshift. If necessary, the engine torque will be reduced during shifts to guarantee that there is no slippage on the input pulley, as mentioned previously.
As the input pulley movable sheave moves further to the left, the real time CVT ratio will gradually approach the target CVT ratio  . Meanwhile, the opening in the valve port to the input piston chamber diminishes and eventually closes due to the effect of the servo mechanism. The CVT fluid in the input piston chamber is then blocked from the line pressure. The downshift is thus completed as soon as the input pulley control valve fully blocks the valve port to the input piston chamber, as shown in Figure 7.21. The CVT then runs at the target ratio
  .
.
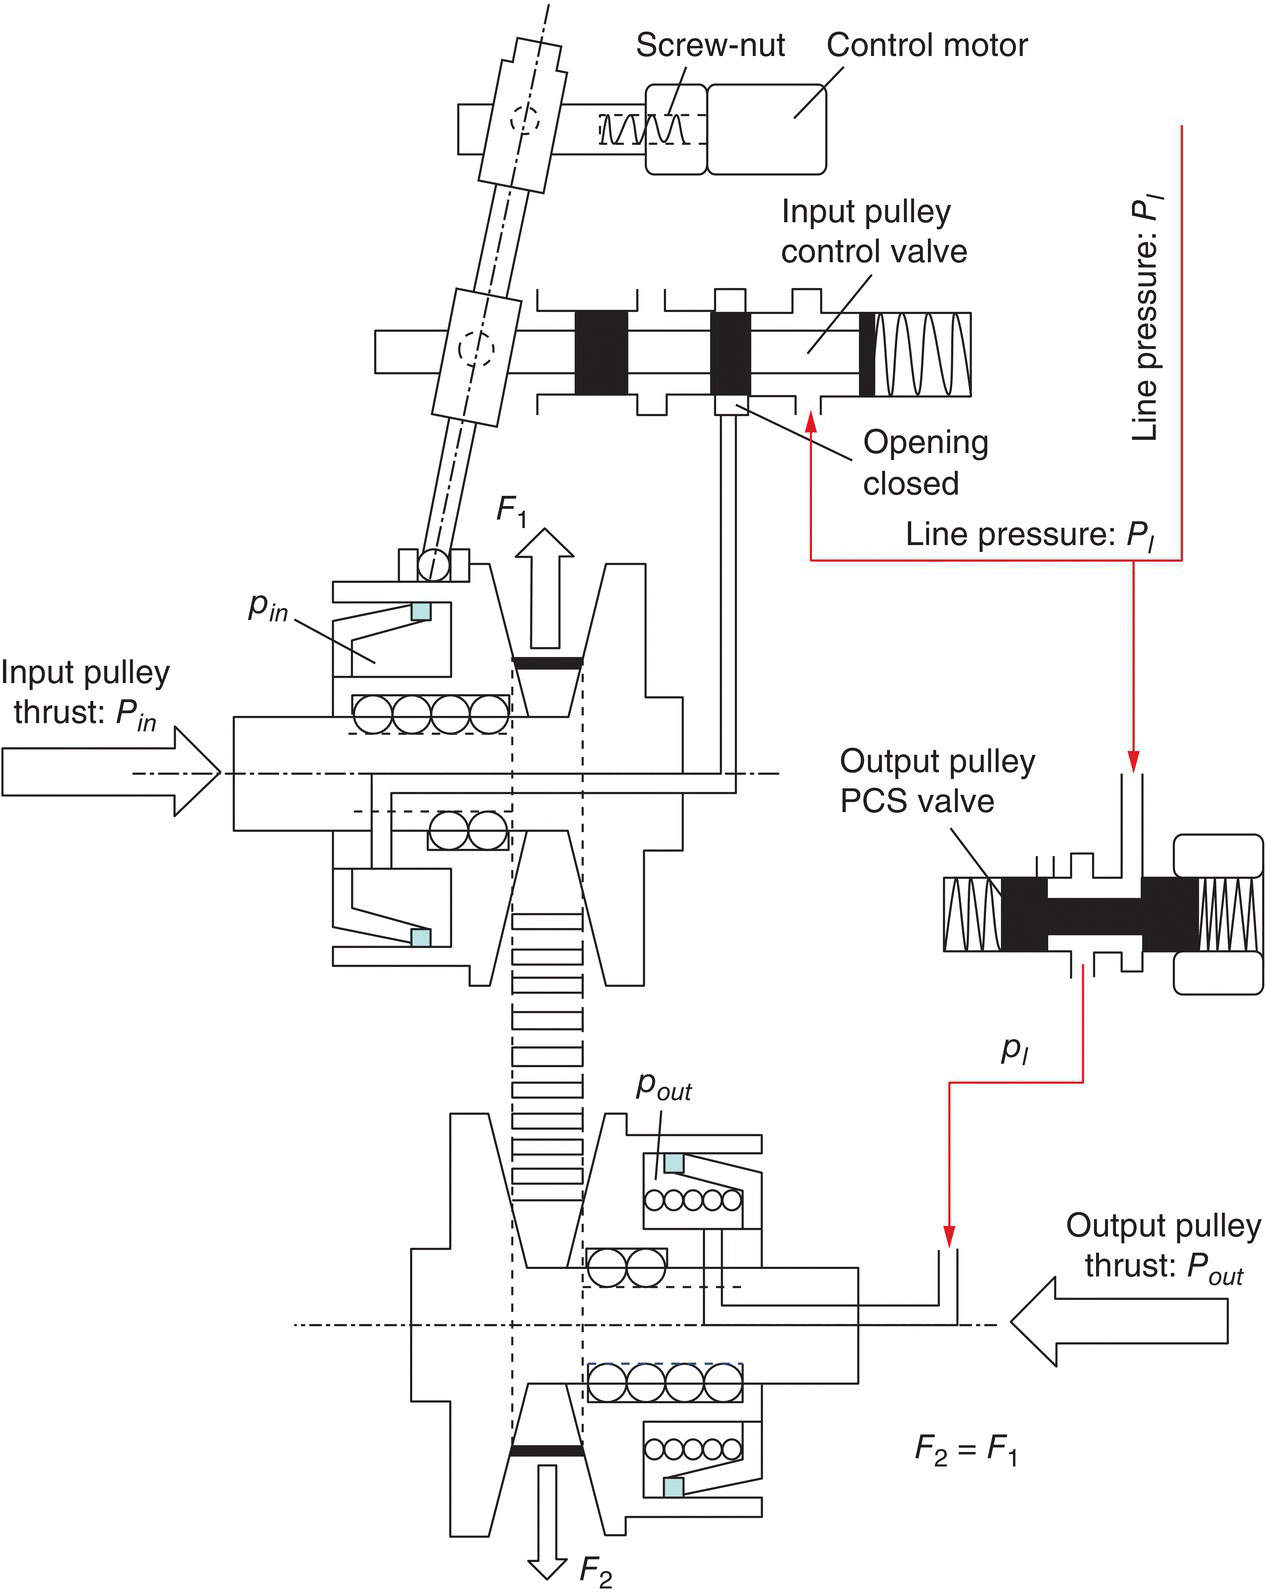
Figure 7.21 Completion of downshifts in CVT servo mechanism control.
7.4.3 Comparison of the Two Control System Designs
There is no fundamental difference in the operation principles of the two CVT control system designs, VBS based control system and servo mechanism control system, as detailed above. Both designs have the same hydraulic circuits and control methods for the system line pressure and for the torque converter clutch. In both designs, the input piston chamber is isolated from the line pressure circuit during fixed ratio operations, so that the input pulley thrust force is generated as a reaction to the action of the output pulley thrust force, which is controlled through control of the line pressure. The VBS based system has certain cost advantages in comparison, since it does not have the motor actuated servo mechanism. The servo mechanism system design features a negative feedback structurally on the control valve opening and thus possesses better stability for CVT shift operations. Most production CVTs today are controlled by the servo mechanism control system. With the availability of large volume multi‐port variable force solenoids (VFS) or variable bleed solenoids (VBS), it can be stated that the VBS or VFS based control system can be used for production CVTs as an alternate to the servo mechanism system.
7.5 CVT Control Strategy and Calibration
CVT control features several technical aspects in general: torque converter clutch control, line pressure control, shift process control and ratio control strategy. There are two ratio control strategies: continuous ratio control for which the CVT was originally invented, and stepped ratio control which emulates conventional transmissions. In CVT equipped powertrains, the torque converter is primarily used as the vehicle launcher. Therefore the converter is only able to function as a torque multiplier when the vehicle is being launched and to function as a fluid damper when the vehicle speed is low, as shown in Figure 7.26. The torque converter clutch is applied under all other operation conditions. The hydraulic circuit and control process for the torque converter clutch were presented in Chapter 6 for conventional ATs. CVT torque converter clutch control is similar to that for conventional ATs. The CVT shift process control was detailed in Section 7.4. This current section will focus on CVT line pressure control and ratio control strategy.
7.5.1 Line Pressure Control
The CVT line pressure control is crucial for both fixed ratio and shift operations. As detailed in Section 7.4, during fixed operations, the line pressure is directly applied to the output piston chamber for the generation of active thrust force on the output pulley. The line pressure defines the torque ratio for CVT fixed ratio operations and must be controlled accurately so that the output thrust force is just high enough for transmitting the input torque required for various operation conditions. During ratio changes, the line pressure is applied in the input piston chamber for upshifts and in the output piston chamber for downshifts. It is apparent that the line pressure control determines the effectiveness and efficiency of CVT torque transmission and the CVT shift responsiveness. The basic hydraulic circuit for CVT line pressure control is similar to that for conventional ATs shown in Figure 6.1 and the control block diagram is shown in Figure 7.22.

Figure 7.22 Block diagram of CVT line pressure control.
As shown in the block diagram, the target line pressure value for a driver selected mode, normal, economy, or sport, is determined according to the major sensor signals on engine RPM, engine throttle, and speeds of the input and output pulleys, and is modified according to the auxiliary sensor signals on the CVT range, CVT fluid temperature, converter lock status, and brake system signals. The engine output torque Te is interpolated from the engine map in terms of the engine RPM and the throttle opening. The torque that needs to be transmitted by CVT, Tin, is the engine output torque minus the loads from auxiliary systems, such as the air conditioner and the power steering pump. The instantaneous CVT ratio icvt is determined by the speeds of the input and the output pulleys. The target CVT ratio  is selected by the CVT controller for the vehicle performance and fuel economy priorities. As shown in Eqs (7.43) and (7.44), the target line pressure pl for fixed ratio operation is determined by:
where μmax is the maximum friction coefficient between the belt and the pulley, Aout is the output piston effective area, as mentioned previously, r1 is the input pulley pitch radius as defined by the CVT ratio icvt, and it is the torque ratio that can be selected in the range  . If the torque ratio is selected as 0.9, then the CVT transmits the input torque Tin with a 10% reservation on the capacity, i.e. it is 10% below the slippage threshold. It is apparent that the higher the torque ratio, the higher the power transmission efficiency. The target line pressure thus determined is used as the reference signal for the controller, which receives real time feedback on the pressures in the output piston chamber and the input piston chambers. The line pressure control strategy illustrated in Figure 7.22 is integrated into the CVT control system shown in Figure 7.23.
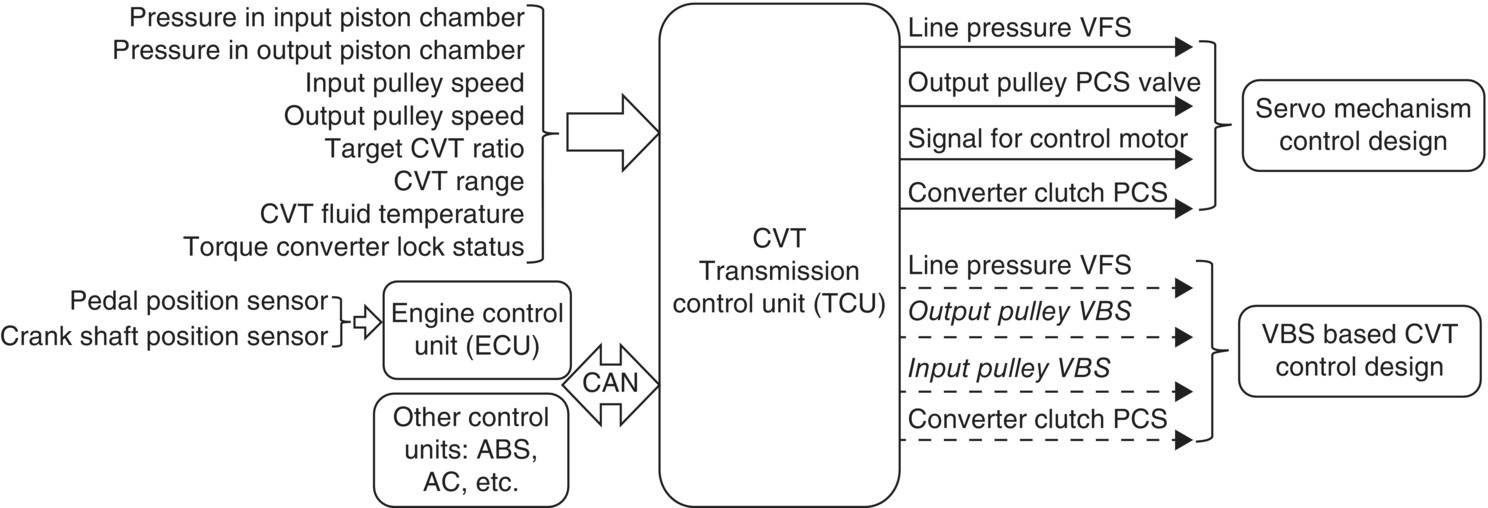
Figure 7.23 Block diagram of CVT control system.
The command signals from the TCU in Figure 7.23 are shown in solid lines with arrows for servo mechanism control design and in dashed lines with arrows for VBS based control design. The two designs share similar basic control logic with the same sensors for the controller inputs. Interactions between the CVT, engine, and other systems are via the CAN. As explained in Section 7. 4, engine output torque reduction may be introduced during CVT ratio changes via the interaction between the CVT TCU and the engine ECU.
7.5.2 Continuous Ratio Control Strategy
As discussed in Chapter 1, CVTs are the ideal transmission that in theory matches the engine output perfectly. For the perfect match, the CVT ratio must be controlled to vary continuously as it was originally designed to do. The objective of continuous ratio control is to optimize the engine operation status for dynamic performance and fuel economy under real world road conditions. In the engine fuel map, there is a so‐called optimal operating line that defines the most fuel efficient engine operation status, as shown in Figure 7.24. By controlling the CVT ratio continuously, the engine will run along the optimal operating line, also called steady state operation line [24], for the optimized trade‐off between performance and fuel economy. As mentioned in Section 7.1, this control strategy is realized by integrated engine–CVT control, in which the engine speed and the CVT ratio are controlled simultaneously [23,24].

Figure 7.24 CVT steady state operation line and transient operations.
The first step for continuous ratio control is to establish the optimal operating line or S‐S operation line from the engine fuel map. For a typical engine, there is a theoretical optimal operating line that passes the unstable engine operation area in the fuel map and lacks sufficient torque reserves for transient maneuvers. The S‐S line modifies the theoretical optimal operating line to avoid the unstable area for better vehicle drivability, as shown in Figure 7.24. The CVT ratio is thereby controlled continuously so that the engine runs along the S‐S operation line which optimizes drivability without significant fuel economy penalty.
There are various control modes for transient operations along the S‐S operation line, depending on how the driver’s priorities are interpreted by the CVT controller. A transient operation defines how the engine–CVT joint operation will be shifted from a current point to the next point on the S‐S operation line, for example, from point A to point B, as shown in Figure 7.24. The following gives details of two control modes – economy mode and performance mode [24] – for transient operations. Clearly the economy mode is selected with a priority on fuel economy and the other with a priority on power or performance.
Economy mode: Suppose the vehicle is running at point A on the S‐S operation line at a certain power level that can be determined based on road load or from the engine operation status. To accelerate the vehicle to a higher speed, the driver depresses the accelerator pedal and the pedal depression is interpreted by the CVT controller (TCU) as the driver’s intention to increase the engine power to a higher level, at 46.8 kW for example. This elevated power level uniquely defines a point on the S‐S operation line, i.e. point B, as shown in Figure 7.24. There is a unique torque curve that contains curve segment HB, corresponding to an engine throttle opening of 40%, shown as an example in the Fig. 7.24. This throttle opening percentage can be found in general by interpolating the engine output map. In the economy mode, the vehicle operation status will be transferred from point A to point B along the 40% throttle line. As soon as the driver depresses the accelerator pedal, the throttle opening is increased to be at 40% instantaneously by electronic throttle control. The CVT ratio and the engine operation are then controlled jointly so that the engine speed traces the 40% throttle torque curve, until steady‐state vehicle operation status is reached at point B. For simplicity, the following assumptions are made in the formulation of the CVT powertrain dynamics during the transition from point A to point B:
- Engine transients are not considered. That means that the engine throttle is instantaneously controlled at point H and the engine also reaches steady state instantaneously. The engine RPM at point H is the same as at point A based on this assumption.
- Powertrain component inertias are not considered in the formulation.
- Powertrain efficiency η is considered to be constant.
Since A and B are both on the S‐S operation line, dynamic equilibrium is achieved by the vehicle powertrain system and the following equations define the steady state at both points:

where ωe and (RPM)e are the engine angular velocity and RPM respectively. V is the vehicle speed, Rt is the vehicle tire radius, icvt and ia are the CVT ratio and the final drive ratio, W is the vehicle weight, and Pe is the engine power at either point A or point B. It is apparent that the CVT ratio at target point B can be determined by Eq. (7.52), where G is the slope grade number and Cc is the vehicle air drag constant as represented by Eq. (1.14) in Chapter 1. During the transition from point A to point B along the 40% throttle line, the vehicle motion is governed by the following equation:
where  is the vehicle acceleration and Te(ωe) is the engine output torque as a function of engine angular velocity. Note that the vehicle acceleration at both points A and B is equal to zero since the two points are on the S‐S operation line. The vehicle acceleration at point H is not equal to zero, but can be determined by Eq. (7.54) using the engine torque found on the 40% throttle torque curve corresponding the engine RPM at point A.
Performance mode: This mode is used for the quickest transition from a current point to the target point on the S‐S operation line, for example, from point C to point B, as shown in Figure 7.24. Similar to the economy mode, the pedal depression by the driver at point C is interpreted as an intention to increase the engine power to the level at point B, at which the 46.8 kW constant power line intersects the S‐S operation line. In performance mode, the engine throttle opening is instantaneously increased to the percentage corresponding to point D on the 46.8 kW constant power line by electronic throttle control. The CVT and engine operations are then controlled jointly for the engine to run along the 46.8 kW constant power line from point D to the steady state point B. The performance mode can also be implemented for the transition from point A to point B. In this case, the engine throttle opening at point A will be increased instantaneously to WOT opening at point F, the CVT and the engine will then be jointly controlled so that the engine runs from point F to point G along the WOT torque curve and then from point G to point B along the 46.8 kW constant power line. Along the line of constant power Pe, i.e. line GB as shown in Figure 7.24, the following equations govern the motion of the vehicle powertrain system:

As already mentioned, the engine and the CVT must be jointly controlled for the engine to run along the steady state operation line. The two control modes described above are used to make the transition from one power level to another. The CVT–engine joint control during the transition operations is based on the logic illustrated by the block diagram of Figure 7.25[24]:

Figure 7.25 CVT‐engine joint control block diagram.
Figure 7.25 contains two control loops, one for the engine throttle and another for the engine speed. The value of θt is the driver accelerator depression, which is interpreted by the TCU as the intention to increase the engine power to the value Pw, while θti is the engine throttle opening interpolated from the engine map according the selected transition mode. For example, if the economy mode is selected, θti is 40% for the transition from point A to point B, as shown in Figure 7.24. If the performance mode is selected, θti then needs to be interpolated from the engine map in terms of the target power and the engine speed. Then ωei is the engine angular velocity at the next steady state point when the transition is completed, for example, at point B, as shown in Figure 7.24, and icvt is the CVT ratio which is controlled by the methods discussed in Section 7.4, while  is the time derivative of the CVT ratio.
7.5.3 Stepped Ratio Control Strategy
Continuous ratio control discussed above takes full advantage of CVTs and theoretically offers the optimal powertrain fuel efficiency. However, it has drawbacks in drivability in comparison to vehicles equipped with conventional ATs. For drivers who are accustomed to driving conventional AT vehicles, CVT vehicles with continuous ratio control give a sloppy or unresponsive driving feel. Therefore, most production CVT vehicles today are controlled by the stepped ratio strategy. As the name indicates, a stepped ratios strategy controls the CVT with multiple stepped gear ratios that emulate a conventional automatic transmission. Usually, the CVT is controlled with six to eight stepped gear ratios in this strategy, although more ratios are possible if necessary. Note that, unlike conventional ATs, each of the multiple gear ratios of the CVT controlled with this strategy may not always be a constant but may be controlled at different values to best fit the vehicle operation condition. For example, the engine speed and the vehicle speed are shown in Figure 7.26 for a CVT vehicle controlled with six gear ratios. As shown in the figure, the first and sixth gear ratios are not held constant. This is because both the low CVT ratio and the overdrive CVT ratio are achieved with the smallest contact angle, as defined in Figure 7.5 either in the input pulley or in the output pulley. For loading and strength considerations, it is beneficial to avoid running the CVT in these two extreme positions at high engine RPM and high vehicle speed.
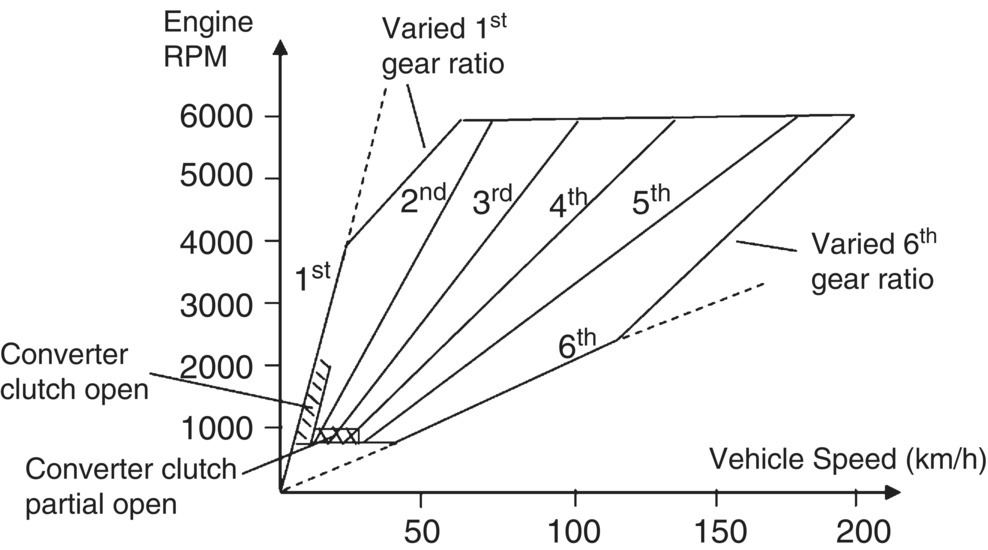
Figure 7.26 CVT stepped gear ratios and ratio variations.
A transmission shift schedule similar to Figure 6.17 must be established to implement a CVT stepped ratio control strategy. The attributes of conventional automatic transmission shift schedules, and guidelines to establish them, were presented in Section 6.4. The shift schedule for a CVT controlled with stepped ratios has similar attributes and can be established similarly. Since the number of gears and the gear ratio in each gear can be flexible, the CVT shift schedule naturally can be designed to better fit the engine output to vehicle operation conditions. Similar to the shift schedule of multiple ratio conventional ATs, a CVT shift schedule can also be designed with different shift modes, such as normal, economy, and sport. The driver can choose a mode for different priority at the convenience of pushing a button or turning a knob. As mentioned previously, the torque converter is primarily used as the vehicle launcher in CVT vehicles and is partially locked up to dampen powertrain transients at low vehicle speed, as shown in Figure 7.26. For efficiency considerations, the torque converter is locked up by the converter clutch and just behaves as a mechanical couple under all other operation conditions. Because of the CVT shifting mechanism discussed in Section 7.4, ratio changes can be completed smoothly without the torque converter functioning as a fluid damper in the process.
Similar to conventional ATs, the CVT is controlled to operate either in a fixed ratio or to implement a shift according to the shift schedule based on the inputs from the speed sensor and throttle position sensor. CVT control during fixed ratio operation and shift operations were detailed in Section 7.4.
7.5.4 CVT Control Calibration
Calibration for automatic transmission control was discussed in Section 6.5 on both component and system levels. In principle, CVT control calibration is similar to conventional ATs. As detailed in Sections 7.4 and 7.5, line pressure control is the most critical for both CVT fixed ratio operation and shifting operations. In fixed ratio operation, the line pressure is directly applied in the output piston chamber and should be controlled just above the value required to transmit the torque required for vehicle operation so that the CVT runs most efficiently. During ratio changes, the line pressure is applied on either the input piston chamber or the output piston chamber to actuate the axial motions of the movable sheaves of the input and output pulleys. For a CVT that is controlled with n gear ratios, there are n upshift threshold lines and n downshift threshold lines, as illustrated in Figure 7.27. Both the engine throttle opening and the engine output speed vary along a threshold line. The engine torque to be transmitted by CVT is determined by the engine throttle opening, which is the vertical axis in the shift schedule, as shown in Figure 7.27, and the engine output speed that can be determined from the CVT ratio and the vehicle speed, which is the horizontal axis of the shifting schedule. A huge number of line pressure values would be required to optimize the CVT operation in the whole drive range, but this cannot be implemented for practical CVT control. Therefore, a number of points are chosen along an upshift threshold line to define the CVT–engine operation status, as shown in the 1–2 upshift line in Figure 7.27. At each such point, the corresponding engine output torque, i.e. the CVT input torque that needs to be transmitted, is determined by interpolation from the engine map. If 10 points are chosen on the 1–2 upshift line, there will be 10 CVT input torque values, and these 10 torque values will then be used to determine the line pressure values according Eq. 7.52, as previously described in line pressure control. A number of these line pressure values can then be used as the reference for line pressure control when the CVT runs with the first gear. For the whole drive range, there will be 50 different line pressure values if 10 points are chosen on each of the five upshift lines. A database can be built for the line pressure values for the CVT input torque in terms of throttle opening, gear ratio, and vehicle speed. The real time line pressure during CVT operation is interpolated from the database to best fit the vehicle operation condition. As a general guideline, the line pressure can be selected and calibrated in the following steps:
- Select a number of points along each upshift line. These points should reflect the most frequent vehicle operation conditions in daily traffic. Experiences and data on existing vehicles provide a good reference on the selection of these points.
- At each point mentioned above, the engine torque is determined from the engine map since throttle opening, vehicle speed, and CVT ratio are known at the point. The CVT input torque is then found by subtracting the loads on auxiliary systems, such as the load from the air conditioner and the power steering pump.
- The line pressure value is then determined by Eq. (7.52) for the particular point. This line pressure allows the CVT to transmit the input torque with a torque ratio of about 0.9. This line pressure is about 10% higher than is needed to transmit the required input torque with a 10% margin below the belt slippage threshold.
- A database is established for the line pressure values determined as above for all points along each upshift line and for all the five upshift lines shown in Figure 7.27.
- Before an upshift, the CVT will be controlled at line pressure determined at the point along the upshift line that is the closest to the engine–CVT operation status, or at a line pressure value determined by interpolating the points on the upshift line. After the upshift, the CVT will be controlled at the line pressure found at the next upshift line corresponding to the particular engine throttle opening. The line pressure values before and after a downshift are determined similarly.
- The vehicle prototype is controlled on a testing rig to operate with the line pressure values determined above under driving conditions that emulate daily traffic; for example, the standard EPA drive ranges can be used to control the operation of the prototype vehicle on the testing rig. Data from these tests are used to validate line pressure control strategy, to modify control variables, and to adjust the line pressure values themselves for CVT operation optimization.
- Road tests are then performed to fine tune the line pressure values and related control variables under real world traffic conditions.
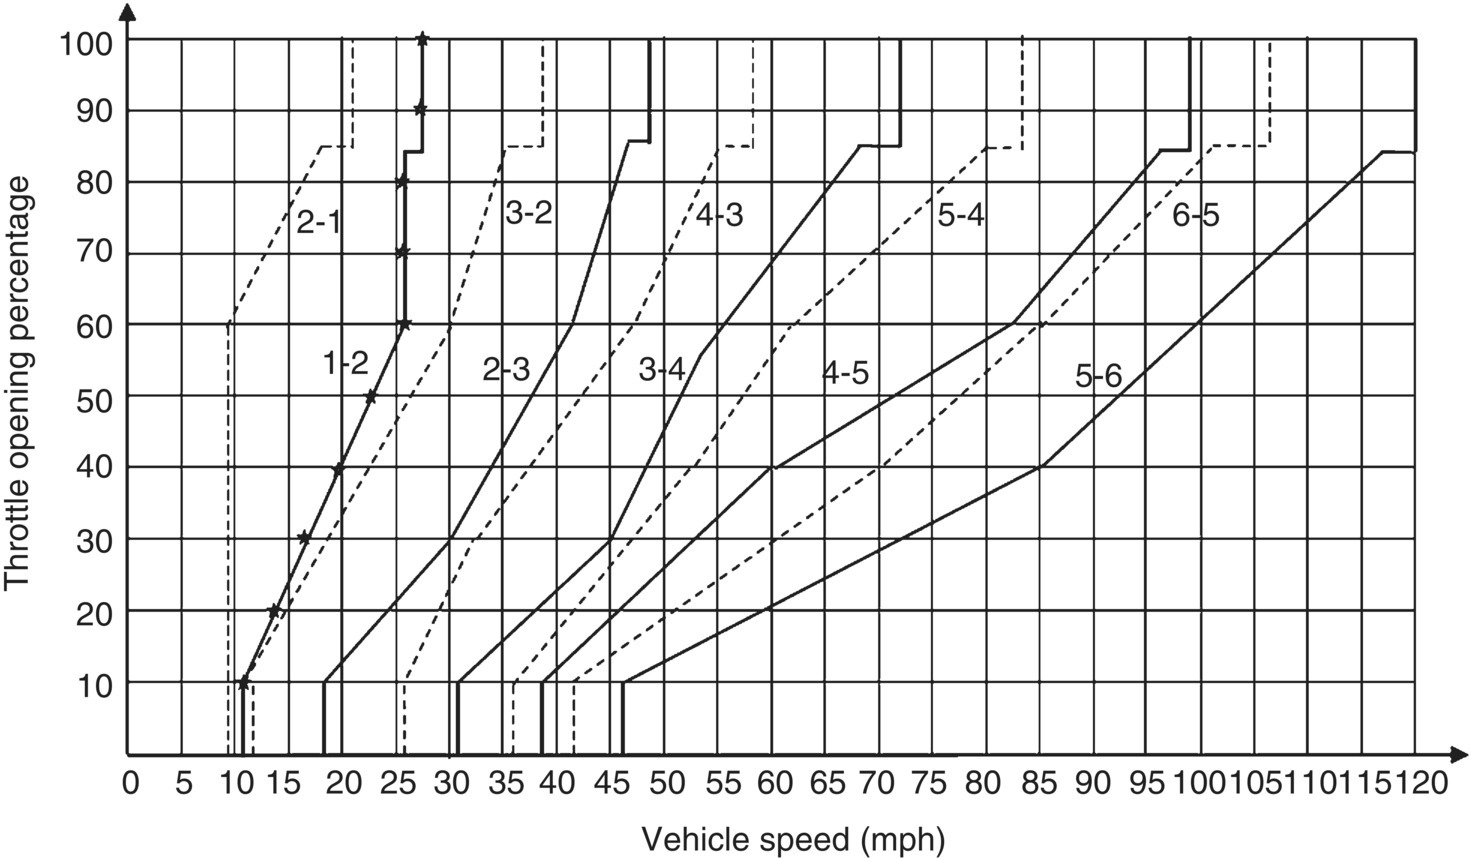
Figure 7.27 Shift lines for a CVT controlled with six stepped gear ratios.
References
- 1 Continuously variable transmission – Wikipedia https://en.wikipedia.org/wiki/Continuously_variable_transmission
- 2 DAF 600 – Wikipedia: https://en.wikipedia.org/wiki/DAF_600.
- 3 Subaru Justy – Wikipedia: https://en.wikipedia.org/wiki/Subaru_Justy.
- 4 Srivastava, N. and Haque, I.: A Review on Belt and Chain Continuously Variable Transmissions (CVT): Dynamics and Control, Mechanism and Machine Theory, 44 (2009), pp. 19–41.
- 5 Gerbert, G.: Belt Slip – A Unified Approach, ASME Journal of Mechanical Design, 1996, Vol. 118, No. 3, pp. 432–438.
- 6 Gerbert, G.: Metal V‐belt Mechanics, ASME Design Automation Conference, ASME Paper No. 84‐DET‐227, Boston, MA, 1984.
- 7 Miloiu, G.: Die Druckkraft in Stufenlosen Getrieben II, Antriebstechnik, Vol. 13, No. 1, 1969, pp. 450–467.
- 8 Worley, W.S. and Dolan, J.P.: Closed‐Form Approximations to the Solution of V‐Belt Force and Slip Equations, ASME Journal of Mechanical Design, 1985, Vol. 107, No. 2, pp. 292–300.
- 9 Worley, W.S.: Designing Adjustable‐Speed V‐belt Drives for Farm Implements, SAE Transaction, Vol. 63, 1955, pp. 321–323.
- 10 Srivastava, N. and Haque, I.: On the Transient Dynamics of a Metal Pushing at High Speed, International Journal of Vehicle Design, Vol. 37, No. 1, 2005, pp. 46–66.
- 11 Srivastava, N. and Haque, I.: Transient Dynamics of Metal V‐belt CVT: Effects of Pulley Flexibility and Friction Characteristics, ASME Journal of Computation and Nonlinear Dynamics, Vol. 2, No. 1, 2007, pp. 86–97.
- 12 Srivastava, N. and Haque, I.: Transient Dynamics of Metal V‐belt CVT: Effects of Band Pack Slip and Friction Characteristics, Mechanism and Machine Theory, Vol. 43, No. 4, 2008, pp. 459–479.
- 13 Carbone, G., Mangialardi, L., and Mantriota, G.: Theoretical Model of Metal V‐belt Drives During Ratio Changing Speed, ASME Journal of Mechanical Design, Vol. 123, No. 1, 2000, pp. 111–117.
- 14 Carbone, G., Mangialardi, L., and Mantriota, G.: Influence of Clearance between Plates in Metal Pushing V‐belt Dynamics, ASME Journal of Mechanical Design, Vol. 124, No. 3, 2002, pp. 543–557.
- 15 Carbone, G., Mangialardi, L., Mantriota, G.: EHL Visco‐plastic Friction Model in CVT Shifting Behaviour, International Journal of Vehicle Design, Vol. 32, No. 3/4, 2003, pp. 333–357.
- 16 Micklem, J.D., Longmore, D.K., and Burrows, C.R.: Modelling of the Steel Pushing V‐belt Continuously Variable Transmission, Proceedings of the Institute of Mechanical Engineers, Part C: Journal of Mechanical Engineering Science, Vol. 208, No. 1, 1994, pp. 13–27.
- 17 Pfeiffer, F. and Sedlmayr, M.: Spatial Contact Mechanics of CVT Chain Drives, Proceedings of ASME 2001 Design Engineering Technical Conference, Paper No. DETC2001/VIB‐21511, Pittsburgh, USA, Vol. 6B, Sept. 2001, pp. 1789–1795.
- 18 Pfeiffer, F. and Sedlmayr, M.: Force Reduction in CVT Chains, International Journal of Vehicle Design, Vol. 32, No. 3/4, 2003, pp. 290–303.
- 19 Fujii, T., Kurokawa, T., and Kanehara, S.: A Study of a Metal Pushing V‐belt Type CVT – Part 1: Relation between Transmitted Torque and Pulley Thrust, SAE Paper # 930666, 1993.
- 20 Fujii, T., Kurokawa, T., and Kanehara, S.: A Study of a Metal Pushing V‐belt Type CVT – Part 2: Compression Force between Metal Blocks and Ring Tension, SAE Paper # 930667, 1993.
- 21 Kurokawa, T., Fujii, T., Kurokawa, T., and Kanehara, S.: A Study of a Metal Pushing V‐belt Type CVT – Part 3: What Forces Act on Metal Blocks, SAE Paper # 950671, 1995.
- 22 Takash, K., Fujii, T., and Kanehara, S.: A Study of a Metal Pushing V‐belt Type CVT – Part 4: Forces Act on Metal Blocks When the Speed Ratio Is Changing, SAE Paper # 940735, 1994.
- 23 Sakagachi, S., Kimula, E., and Yamamoto, K.: Development of an Engine – CVT Integrated Control System, SAE Paper # 1999–01‐0754, 1999.
- 24 Vahabzadeh, H. and Linzell, M., Modelling, Simulation and Control Implementation for a Split‐Torque, Geared Neutral, Infinitely Variable Transmission, SAE Paper No. 910409, 1991.
- 25 Tanaka, H. and Ishihara, T: Electro‐Hydraulic Digital Control of Cone‐Roller Toroidal Traction Drive Automatic Power Transmission, ASME Journal of Dynamic System and Measurement, Vol. 106, pp. 305–310.
- 26 Tanaka, H.: Power Transmission of a Cone Roller Toroidal Traction Drive, JSME Int. J., Series III, Vol. 32, No. 1, pp. 82–90, 1989.
- 27 Zhang, Y., Zhang, X., and Tobler, W.: A Systematic Model for the Analysis of Contact, Side Slip and Traction of Toroidal Drives, ASME Journal of Mechanical Design, Vol. 122, No. 4, pp. 523–528, 2000.
- 28 Zou, Z., Zhang, Y., Zhang, X., and Tobler, W.: Modelling and Simulation of Traction Drive Dynamics and Control, ASME Journal of Mechanical Design, Vol. 123, No. 4, pp. 556–561, 2001.
Problems
- A belt CVT has the following design data: pulley center distance E = 185 mm; Belt length L = 720 mm; pulley groove angle: 11°. The piston effective areas are 160 and 130 cm2 for the primary pulley and secondary pulley respectively. The CVT ratio range is [0.4, 2.3]. The static tangential friction coefficient is 0.1 for both pulleys. The final drive ratio is 6.12. The efficiency before the primary pulley is considered to be 1.0. The driveline efficiency is 0.82 after all extra engine loads and losses are considered. The CVT vehicle data and the engine fuel map are provided as shown.
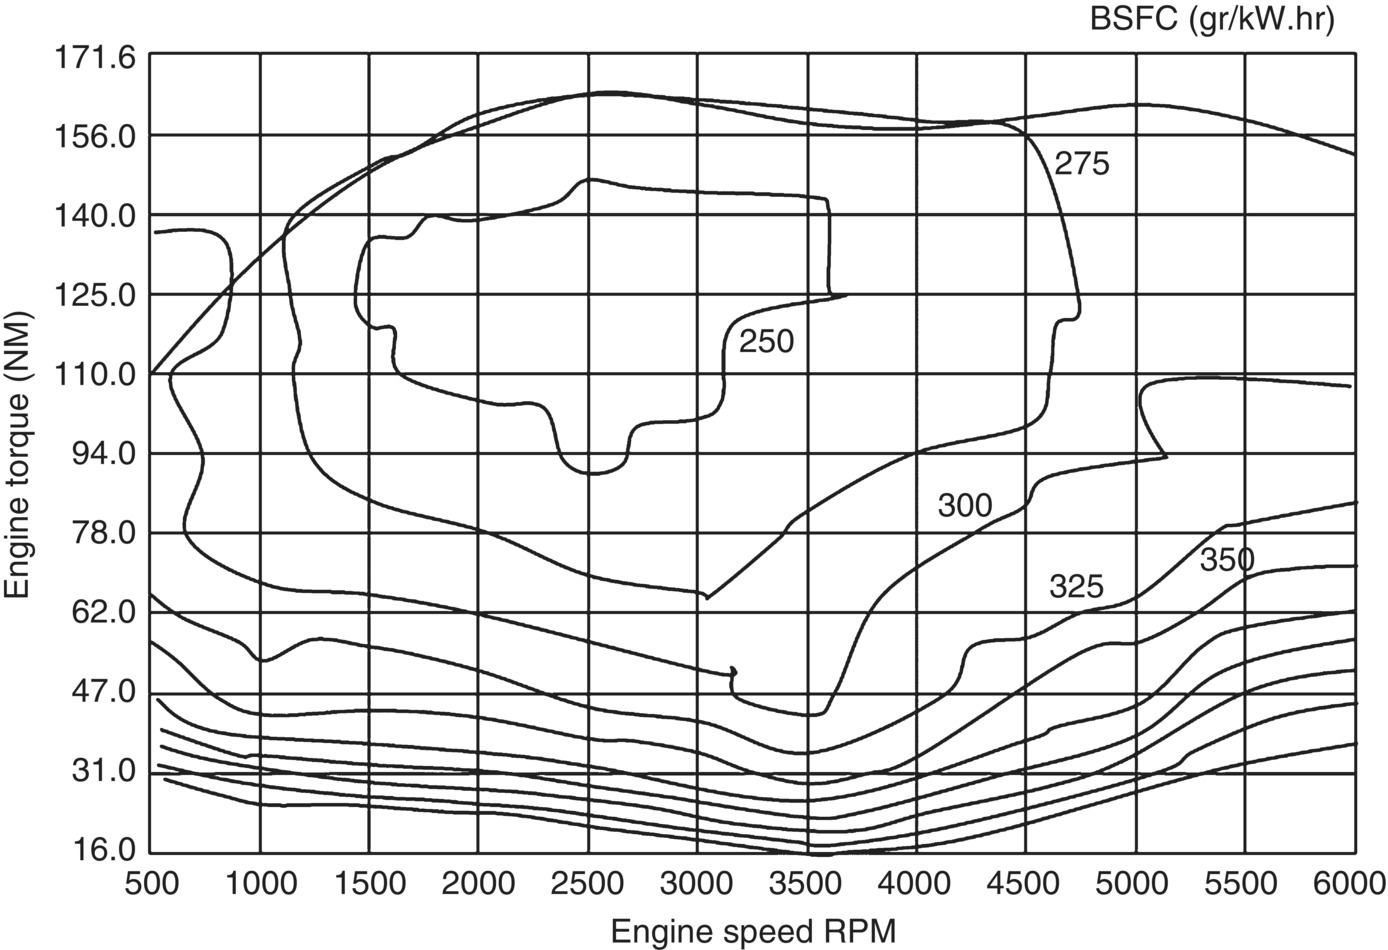
- The CVT is required to be capable of transmitting a maximum input torque on the primary pulley of 160 Nm with the CVT ratio equal to 2.3 when the torque converter is locked. With a safety factor of 1.1, what should be the line pressure in Bar (note: 1 Bar = 10 N/cm2) that is directly applied to the secondary piston chamber?
- What should be the pressure in the primary piston chamber if the same safety factor of 1.1 is required for the input side when the CVT is operating under the condition in (a).
- When the vehicle is cruising at a constant speed of 110 km/h on level ground, the engine torque is controlled at 78 Nm. What is the CVT ratio and the fuel economy in liter/100 km. Note: gas density is 750gram/liter. Show how data are taken from the fuel map.
Air drag coefficient: 
Vehicle Mass = 1200 kg Tire radius: R = 0.28 m Rolling coefficient: 0.2 Final drive ratio: 
Final drive efficiency: 0.97 Frontal projected area: 
- A CVT is used for a vehicle with data shown below. The engine map, the steady state operating line, the constant power lines at 25 kW, 34 kW, and 45 kW, and the constant throttle line are shown in the figure. The torque converter is locked and all losses are neglected (i.e.
 ). Points A, B, and C are on the steady‐state operating line.
- Determine the vehicle speed and CVT ratio at A, B, and C respectively.
- At a point of time during the transition from A to B in economy mode, the vehicle speed sensor reads a vehicle speed of 108 km/h and the engine tachometer reads an engine speed of 2300 RPM. Determine the vehicle acceleration at this point.
- The performance mode is used for the transition from C to B. Determine the vehicle acceleration at the beginning of the transition.
- At a point of time during the transition from C to B in performance mode, the speed sensor reads a speed of 118 km/h and the CVT ratio is 1.1. Determine the vehicle acceleration at this point.
Cd = 0.28 (air drag coefficient) A = 2.15 m2 (front projected area) m = 1250 kg (vehicle mass),  m (tire radius)
 (rolling coefficient)
 (final drive ratio)


