Remember back at the start of this book, when I was telling you about how I asked my students to rate people they knew on wealth and happiness? After we looked at whether the students saw a correlation between the two, I asked them to think about the people they had given their highest and lowest happiness ratings to. What was it that made them seem so happy or unhappy?
The students came up with all sorts of replies – to do with health, family relationships, how hard people work, helping others, the ability to travel, social circles and so on. Some responses were about personalities – whether people are optimistic and whether they feel gratitude and appreciation.
As the students called out their replies, I wrote them on the blackboard in two lists. At the end, I asked why I had some replies in one list, and some in the other. Someone always realised quite quickly. The items in the shorter list cost money. The items in the longer list did not. It became pretty clear that money doesn’t seem to be the main source of contentment.
We then looked at another pair of lists, as compiled by Nick Powdthavee in The Happiness Equation, as follows:
• Jobs with the lowest job satisfaction: roofers, waiters/servers, labourers (except construction), bartenders, hand packers and packagers etc.
• Jobs with the highest job satisfaction: clergy, physiotherapists, firefighters, education administrators, painters and sculptors etc, teachers, authors, psychologists, special education teachers, operating engineers.
‘What can we learn from this?’ I asked the students. Once again, a bright spark worked it out. Most of the highly satisfying jobs involved creativity or significant interactions with people. What they didn’t involve was particularly high pay. Where were the doctors, lawyers, accountants and chief executives?
The students and I also discussed research on big winners in lotteries. While some winners seemed to be happy, others were miserable. How could you trust the sincerity of any new friend you made? For many winners, a year later they were about as happy or unhappy as they had been before their big win. As Powdthavee said, people tend to adapt to good and bad things – getting married, or the death of a loved one – faster than they expect to.
Then we turned to spending, and research that finds you’re likely to be happier if you:
• Buy experiences instead of things. Things get old, but experiences – concerts and shows, being out in the wilderness, travel, or just spending time with friends – stay shiny in your memory.
• Buy many small pleasures instead of a few big ones.
• Pay now and consume later. Anticipation is part of happiness. Also, you enjoy it more when you know the bill is already paid.
• Spend on others instead of yourself.
I’ve got no idea how many of the students were convinced by their reading and the discussion. But I like to think they walked away at least pondering whether the common drive to accumulate more wealth is what life is all about.
Recent research by Andrew T. Jebb, Louis Tay, Ed Diener & Shigehiro Oishi, published in 2018 in the journal Nature Human Behaviour, finds that – on average – happiness seems to actually decline beyond a certain income.
The study was based on a global survey of 1.7 million people. The researchers looked at what they called ‘subjective wellbeing’, which is made up of:
• Life evaluation. Participants were asked to imagine a ladder with steps labelled 0 to 10. Zero represents the ‘worst possible life’, and 10 is the ‘best possible life’. They had to decide which step they personally stand on at the present time.
• Affective wellbeing. People were asked whether they had experienced certain emotional states for much of the day yesterday. For ‘positive affect’, the emotional states were happiness, enjoyment and smiling/laughter. For ‘negative affect’, the emotional states were stress, worry and sadness.
Results differed for different regions. The income level at which life evaluation peaked in Australia and New Zealand was about NZ$184,000 for a single-income household – and higher for larger households.
But turning to affective wellbeing, the peak income level for our region was much lower – around NZ$73,000.
It’s hard to know what to make of that big difference – which applied across all regions. Rather than dwelling on the details, let’s just say that getting richer could in some cases be harmful to your happiness.
The researchers made two particularly interesting observations. The first was that if the income of a person earning at the peak level – say $73,000 – was suddenly doubled, they might well feel happier at first. That’s not what the research is about. Rather, it’s showing that ‘groups at the higher income are no happier than groups at the lower initial income’.
The fact that higher-income people in fact seemed somewhat less happy ‘may speak to the reality of the “hedonic treadmill” – the well-studied phenomenon that happiness levels tend to return to a relatively constant baseline amidst various life events and circumstances’.
See what I said above about lottery winners!
It’s important to note, too, that the research is looking at averages. Some individuals will be happier as their income climbs to billions of dollars, while others need little money to be very happy.
The second observation made by the researchers was that presumably it’s not the higher incomes themselves that make people less happy, ‘but the costs associated with them. High incomes are usually accompanied by high demands (time, workload, responsibility and so on) that might also limit opportunities for positive experiences (for example, leisure activities).
‘Additional factors may play a role as well, such as an increase in materialistic values, additional material aspirations that may go unfulfilled, increased social comparisons or other life changes in reaction to greater income (for example, more children or living in more expensive neighbourhoods). Importantly, the ill effects of the highest incomes may not just be present when one’s maximum income is finally reached, but could also occur in the process of its attainment.’
It’s worth pondering.
What makes New Zealanders happy?
Over several years, up until 2014, the market research company UMR did research on what makes New Zealanders aged 18 and older happy. The findings were fairly similar year after year, so I suppose we can expect they would be much the same now.
Around 30% of the population gave themselves 9 out of 10 or 10 out of 10 for happiness. The scores were somewhat higher for women than men.
But the clearest difference was age. Our graph shows a strong trend. People become less and less happy as they head into their forties and fifties, but then a miracle occurs! They get markedly happier from then on, with the 75-plusers being happiest of all.
It was funny when I showed Figure 19 to my university students, most of whom were in their late teens. They expected people to get less and less happy as they got older, perhaps because they watched their parents wilt as mortgages and difficult teens – the students themselves! – took their toll.
Figure 19: Age and happiness
Percentage of ‘very happy’ people in each age group
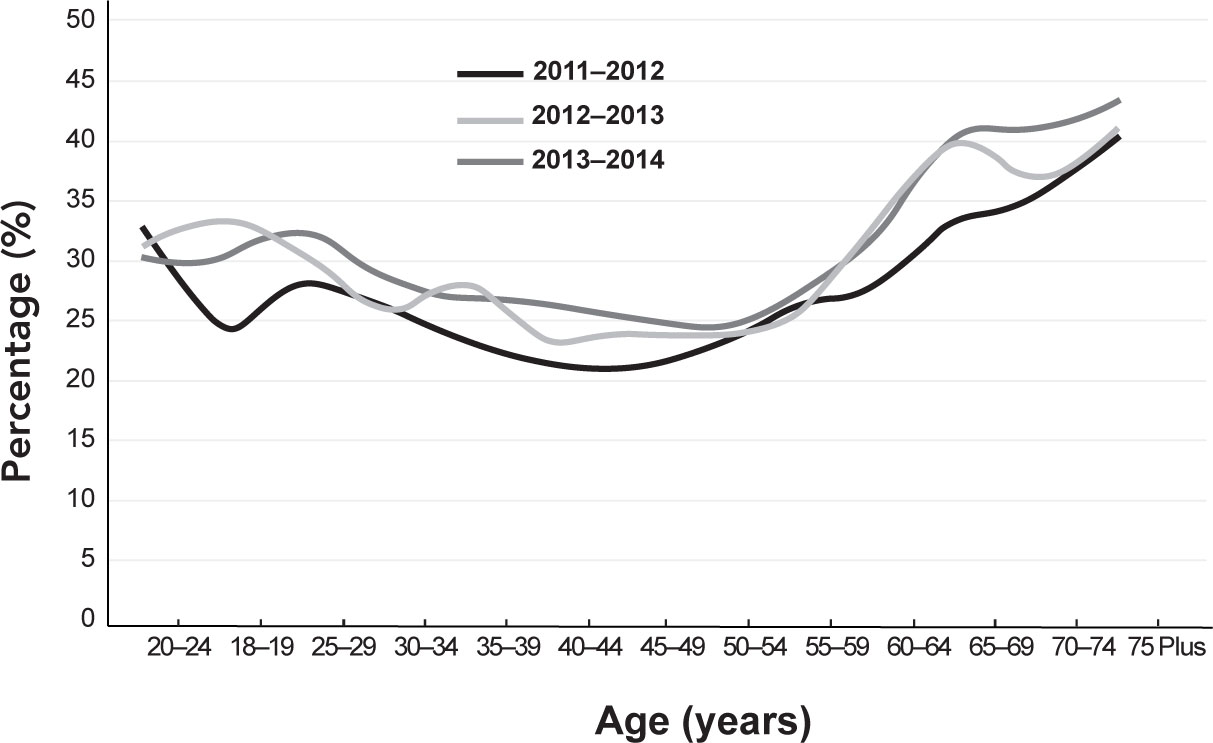
Source: UMR research
But the students thought old people would be unhappier still. I just smiled.
The survey’s findings on income are puzzling. They seem to contradict other research to some extent, in that the group with the highest happiness score was the highest income group. But those on low incomes came second, being happier than those in the middle. Maybe age is what’s really driving those results. Older people tend to be on higher incomes, and younger people on lower incomes.
One striking – and encouraging – result was New Zealanders’ responses to the question: ‘Is your job something you do to pay the bills and you would take another one if the pay was better, or is your job more of a calling that you really enjoy and feel is important?’ Nearly two-thirds – 65% – said their job was a calling, with only 30% saying they worked just to pay the bills.
What else? The five factors most strongly associated with high scores for happiness were:
• being very satisfied with your work–life balance (55% of this group are very happy);
• being very satisfied with your achievements in life (53%);
• being very involved in the community (42%);
• being very satisfied with your physical fitness (41%);
• being politically on what the survey called the ‘firm right’ (40%).
Other factors with some correlation to happiness were:
• feeling that you have excellent control over your life;
• being very satisfied with your weight;
• knowing your neighbours very well.
What can we learn from this? You can’t do much about your age or gender. But if your job is not your calling, you might want to change that.
Other steps you might want to consider include: changing your work–life balance, increasing your community involvement and neighbourliness, or working on your fitness and weight. I’m not sure, though, that an artificially imposed move to the right wing of politics would work!
The joys of spring
Does your happiness change with the seasons? UMR looked at this over several years and found that happiness rises from the start of the year until March, and then falls to its lowest point in July, in the depths of winter.
But as July ends, our happiness swings back up, reaching its highest point of the year in September. It stays about the same through spring, but falls slightly heading into December and the Christmas rush. All quite predictable when you come to think about it.
Money, couples and family relationships
One thing that wasn’t covered in the UMR surveys, but came up frequently when the students talked about why they scored people as happy or unhappy, was relationships between couples and among family members. And money certainly plays a role in this, although more money doesn’t necessarily mean more harmony.
Relationship Services reports that financial differences are the biggest reason for relationship breakdown. They recommend that couples talk about their attitudes to money, preferably before problems arise. But if they’ve already arisen in your relationship, it’s not too late! Start by asking one another how money was dealt with when each of you was growing up.
The experts point out that sometimes a relationship difficulty is not really so much about money as about how financial decisions are made. It’s a good idea to agree on this.
Often problems surface around shopping. Note that research at Stanford University found that ‘contrary to popular opinion, nearly as many men as women experience compulsive buying disorder, a condition marked by binge buying and subsequent financial hardship’.
Moving beyond couples to the broader family, if parents are giving more financial support to one adult child than to his or her siblings, it’s often a good idea to discuss this with the others to avoid accusations of favouritism. The siblings may agree that one of them needs extra help, perhaps because of bad luck or ill health. One possible solution: uneven treatment may be evened up later with provisions in a will.
Happier than most other countries
How do New Zealanders compare with the rest of the developed world on happiness?
The OECD (Organisation for Economic Co-operation and Development), which has 38 member countries including us, puts together a Better Life Index, which is a bit of an eye-opener.
Key message: It seems that New Zealanders’ happiness might be less tied up with income than in many other countries.
The OECD looks at 11 wellbeing factors. New Zealand’s highest score is for health (we’re first out of 38, with a score of 9.6 on a scale of 1 to 10), and our second highest score is for our general satisfaction with life (9.1).
Meanwhile, our lowest score is for income (3.5). We have below average household disposable (after-tax) income, and below average household wealth.
Other findings:
• We get a high score for community (95% of people believe that they know someone they could rely on in a time of need, compared with 89% across the OECD).
• We also do well on environmental quality (which measures air pollution, water quality and so on).
• We’re pretty good on jobs, but not so good on work– life balance.
• We’re above average for civic engagement (voter turnout etc), housing, education and skills.
• But – somewhat surprisingly – we’re below average for personal security (feeling safe walking alone at night, and the murder rate).
To check out this fascinating research, and to see where New Zealand ranks compared with any other country or all of them, go to www.oecdbetterlifeindex.org. You can also create your own index on this intriguing website, giving more importance to some factors and less to others, and check out gender differences.
Where do you rank on the world’s rich list?
Feeling hard done by? Go to www.globalrichlist.com. By answering a couple of questions about your income, or your wealth, you can find out roughly where you rank in the world. You might be surprised.
The Harvard Business Review put it this way: ‘People who make progress every day toward something they care about report being satisfied and fulfilled.’
American broadcaster Andy Rooney put it this way: ‘Everyone wants to live on top of the mountain, but all the happiness and growth occurs while you’re climbing it.’
And Chris Anderson, head of TED, wrote in his book TED Talks, The Official TED Guide to Public Speaking: ‘We’re strange creatures, we humans. At one level we just want to eat, drink, play, and acquire more stuff. But life on the hedonic treadmill is ultimately dissatisfying. A beautiful remedy is to hop off it and instead begin pursuing an idea that’s bigger than you are.’
Meanwhile, the UK Government’s Foresight Programme offers these Five Pointers for Lifelong Wellbeing:
1. Connect with people around you.
2. Be active – do physical activity that suits you.
3. Be curious – watch for the beautiful or unusual.
4. Keep learning – anything. It might be a musical instrument, or how to cook.
5. Give – to a friend or a stranger. Volunteer.
What’s not on the list?