For generating the Proc Means of basketball by Height, we specified that we wanted the Means statistic but still got the number of observations and the minimum, maximum, and standard deviation in the output. In the rest of the Proc Tabulate outputs discussed till now, we have seen the reporting of the number of observations and the sum of observations. We can use the following code to specify the statistics required:
Proc Tabulate Data=Dealership;
  Class Car;
  Var Avg_Price;
  Table Avg_Price*Car*(Sum Mean StdDev);
Run;
This produces the following output:
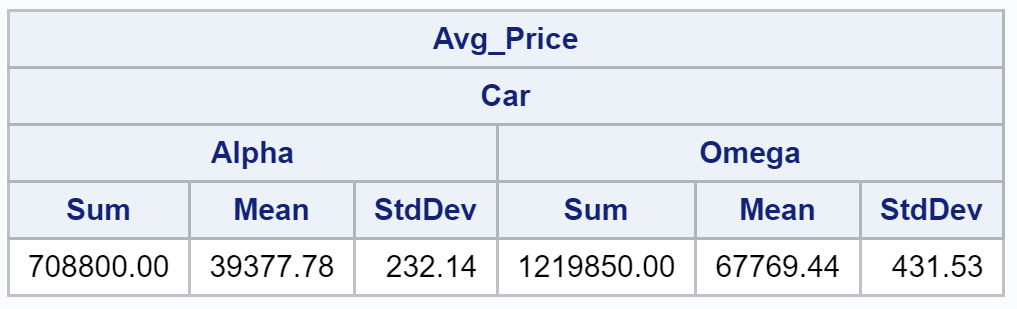
The parentheses used in the code to produce this output was done to simplify understanding the code as it clubbed variables with the same data treatment.
The alternative to the parentheses would use the following code:
Proc Tabulate Data=Dealership;
  Class Car;
  Var Avg_Price;
  Table Avg_Price*Car*Sum Avg_Price*Car*Mean
  Avg_Price*Car*StdDev;
Run;
The Table statement looks more complicated in this instance compared to the statement that produced the preceding output. The complicated version of the code produces the following output:
