Till now, we have focused on one-dimensional Proc Tabulate output. We will use a new dataset to look at the two-dimensional output:
Data Sales;
  Input Country $7. Segment $11. Type $ Product $ Amt;
  Datalines;
US      Retail     Software A 23
US      Retail     Software B 11
US      Retail     Hardware A 8
US      Retail     Hardware B 10
US      Commercial Software A 45
US      Commercial Software B 46
US      Commercial Hardware A 4
US      Commercial Hardware B 11
Germany Retail     Software A 12
Germany Retail     Software B 15
Germany Commercial Software A 55
Germany Commercial Software B 67
Germany Commercial Hardware A 23
Germany Commercial Hardware B 25
;
The code generates the following table, which is the Sales dataset:

We want the output that calculates the mean of hardware and software sales amount for each country, segment, and product. Let's use the following code to do so:
Proc Tabulate Data=Sales;
  Class Country Segment Type Product;
  Var Amt;
  Table Country*Segment*Product,Amt*Type*Mean;
Run;
This gives the following table as the output:
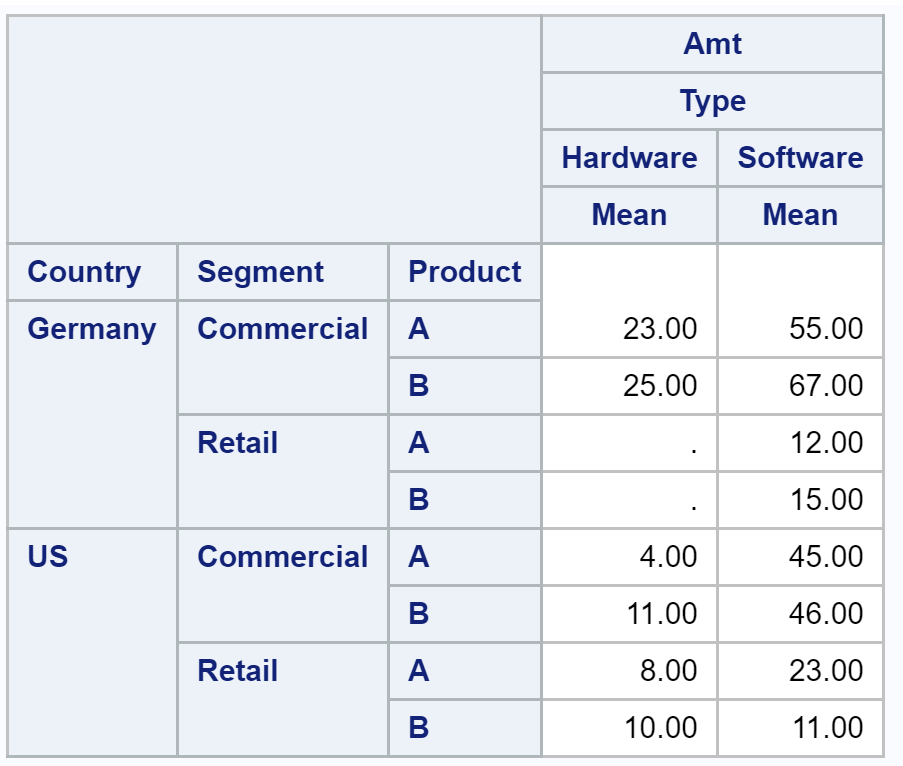
This is a two-dimensional Proc Tabulate output.