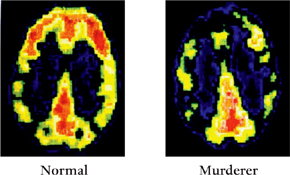
FIGURE 3.1: Positron-emission tomography (PET) scans showing a bird’s-eye view of reduced prefrontal functioning in murderers (top of scan) compared with controls. Red and yellow indicate higher brain functioning.

FIGURE 3.2: Bird’s-eye view of PET scans showing reduced orbitofrontal activation (very top of scan) in the impulsive murderer Antonio Bustamante compared with a normal control

FIGURE 3.3: Bird’s-eye view of functional brain scans (PET scans) of a normal control (bottom left), serial killer Randy Kraft (middle), a onetime impulsive murderer (right), and the author (top)
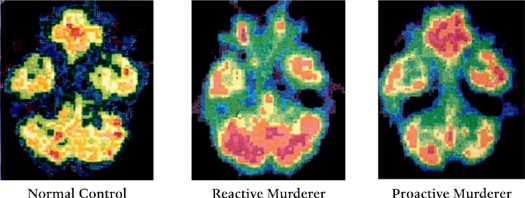
FIGURE 3.4: Bird’s-eye view showing reduced prefrontal functioning (top of PET scan), specifically in a reactive murderer compared with a proactive murderer and a normal control. Red and yellow indicate higher brain functioning.
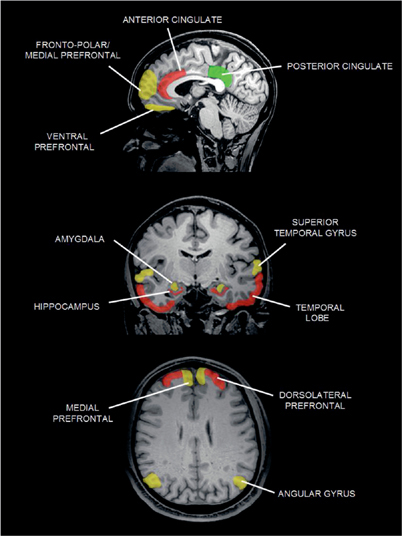
FIGURE 3.5: Side view (top), head-on view (middle), and bird’s-eye view (bottom) of MRI slices showing brain regions associated only with moral decision-making (green), only with violence (red), and areas associated with both violence and moral decision-making (yellow)
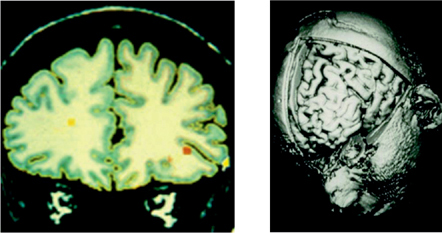
FIGURE 5.1: Structural MRI scan exposing the prefrontal cortex (right), and on the left a prefrontal head-on slice showing separation of neuronal matter (green) from axonal white matter
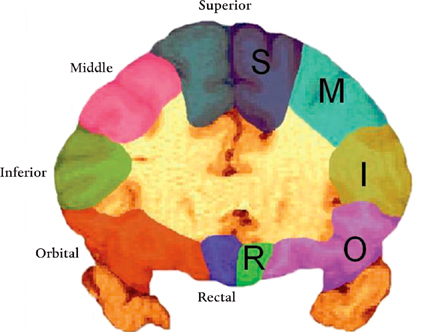
FIGURE 5.4: Head-on view of the brain showing segmentation of the prefrontal cortex into gyral sectors to calculate brain volumes in those with antisocial personality disorder
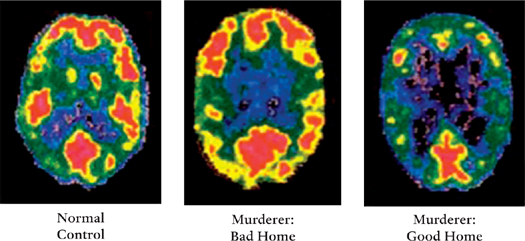
FIGURE 8.4: Bird’s-eye view of PET scans showing reduced prefrontal functioning (top of scan) in murderers from good homes. Red and yellow indicate higher brain functioning.

FIGURE 10.1: PET scans showing reduced ventral prefrontal functioning in the murderer Donta Page compared with normal controls. The right column shows a bird’s-eye view. In the left column, you are looking head-on and slightly up at the brain.