Introduction
Steelmaking is energy and carbon intensive. While the average energy intensity of steelmaking has decreased by half since 1960 [1], the average carbon intensity of steelmaking is currently approximately 1.9 tonne CO 2 per tonne crude steel cast [2]. Given the high total production rate of steel the result is that steel production is the source of around 6.7% of anthropogenic CO 2 [1].
To assess possible further process improvements, global data—as collected by the World Steel Association [1, 2]—must be supplemented with data at the plant and process level. The “roundup” data collected and reported by several technical committees of the Association for Iron and Steel Technology (AIST) provide valuable process information, including plant capacities and equipment size, and consumption rates of raw materials and electricity [3]. The roundups do not explicitly report carbon emissions, and one of the purposes of the present work was to test whether emission data could be reasonably inferred from the reported process details.
Explicit information on emissions in the U.S.A. is provided by the Greenhouse Gases Reporting Program of the Environmental Protection Agency (EPA). Rule 98, published by the EPA in October 2009, mandates reporting of emissions from stationary sources in the United States of more than 25,000 tonnes annually of carbon dioxide equivalent [4, 5]. All details of the rule, including calculation methods and tables of useful information such as CO 2 emission values of fuels, calorific values of fuels, and unit conversions, are published in the Electronic Code of Federal Regulations, Title 40, Part 98 [5]. Emissions are reported by the owners and operators of facilities; data are currently available for the years 2010–2016 (the deadline for reporting 2017 emissions is April 2, 2018). The reported data are available online for each reporting facility [6]. For 2016, the number of reporting metals facilities was 295, with a total of 84 million tonnes of CO 2 emitted (of which 69 million tonnes was from iron and steel production). Steelmaking accounted for 2.4% of the total reported emissions of 2,711 million tonnes for 2016. The largest proportion (69%) of the total emissions was from power generation.
At first glance, the figure of 69 million tonnes carbon dioxide from iron and steel production appears low, given that the U.S.A. produced 78.5 million tonnes of crude steel in 2016 [7], and that the CO 2 intensity of steelmaking in the U.S.A. is around 1.7 tons CO 2 per ton crude steel [8]. However, the emissions are reported by source, and so do not include carbon dioxide that is associated with electricity consumption. Since approximately two-thirds of crude steel production in the U.S.A. is by electric arc furnaces [7], emissions related to electricity consumption by steelmaking are significant. For 2016, the U.S.A. average carbon intensity of electricity was 0.47 kg/kWh [9]. For the electric furnaces included in the analysis presented below, the average electricity consumption (weighted by furnace capacity) was 412 kWh/tonne. This means that off-site production of electricity would have added at least 0.2 tonne CO 2 per tonne steel , for electric furnace steelmaking .
In the analysis presented here, the emissions listed under the Greenhouse Gases Reported Program were compared with the consumption figures available from the AIST Roundup for the same year. Two arbitrarily chosen facilities were considered, an integrated steelmaking facility (including a coke oven battery, blast furnace and oxygen converters), and an electric furnace facility. A principle behind Rule 98 is that emissions are counted at the point of release, for example at the stack of a blast furnace stove or of a coke oven battery. The emissions can either be measured directly, or calculated with a mass balance using a measured fuel rate and composition. In the case of an integrated steel plant a less onerous procedure would have been a simple overall plant carbon balance, as described by Rohaus et al. [10]—little carbon leaves an integrated steel plant in any form other than carbon dioxide, but there are numerous combustion facilities within an integrated plant.
Calculation Principles
Total CO 2 emissions from blast furnace ironmaking, as reflected in the Greenhouse Gas Reporting Program data for 2016, for the AK Steel Middletown furnace . Values are for combustion units that list blast furnace gas as fuel, plus the off-gas from oxygen steel making. (BF = blast furnace ; BOF = basic oxygen furnace ). Numbers in bold were calculated in this work
CO 2 (tonnes) | |||
|---|---|---|---|
Unit | Per unit | Subtotal | Percentage |
No. 1 BF Stove | 188,923 | ||
No. 2 BF Stove | 180,605 | ||
No. 3 BF Stove | 39,383 | ||
No. 4 BF Stove | 184,431 | 593,342 | 19.6% |
No. 1 Boiler | 269,798 | ||
No. 2 Boiler | 253,975 | ||
No. 3 Boiler | 253,345 | ||
No. 4 Boiler | 275,304 | 1,052,421 | 34.7% |
Blast furnace flare | 1,099,348 | 1,099,348 | 36.3% |
BOF Vessel No. 16 | 127,088 | ||
BOF Vessel No. 15 | 160,473 | 287,561 | 9.5% |
Total | 3,032,671 | ||
Calculated CO 2 emissions from the AK Steel Middletown furnace , based on the 2017 AIST Blast Furnace Roundup. Numbers in bold were calculated or assumed in this work
Coke rate | 392 | kg/THM | Assumed %C = | 85 |
Natural gas | 104 | kg/THM | Assumed %C = | 75 |
Total carbon intensity | 411.2 | kg/THM | ||
Production | 2,017,040 | Tonnes of hot metal (THM) | ||
Total carbon used | 829,407 | Tonnes | ||
Total CO 2 | 3,041,158 | Tonnes | ||
Comparison of CO 2 emissions directly from the electric furnace , as reflected in the Greenhouse Gas Reporting Program data for 2016, with estimated carbon emission from combustion within the furnace based on the 2017 AIST Electric Furnace Roundup. Values are for the SSAB Iowa plant. The CO 2 intensity of electricity is the average for Iowa in 2016 [9]. Numbers in bold were calculated or assumed in this work
Carbon intensity from Greenhouse Gas Reporting Program | ||
CO 2 emissions from EAF | 183,533 | Tonnes |
Carbon intensity deduced from Electric Furnace Roundup | ||
Capacity | 1.134 | Million tonnes per year |
Oxygen | 40 | Nm3/tonne |
CO produced | 80 | Nm3/tonne |
CO 2 produced | 80 | Nm3/tonne |
CO 2 intensity at furnace | 157 | kg/tonne |
Total CO 2 | 178,099 | Tonnes |
Other consumption figures | ||
Electric power | 407 | kWh/tonne |
Natural gas | 9.5 | Nm3/tonne |
CO 2 intensity of electricity | 0.554 | kg/kWh |
CO 2 intensity of steel , due to electricity use | 226 | kg/tonne |
Blast Furnace
The integrated plant that was analyzed is the AK Steel Middletown Plant, with a focus on the carbon intensity of blast furnace ironmaking, directly caused by the use of carbonaceous fuels. (That is, carbon dioxide emissions related to upstream processes such as cokemaking and pellet production were not considered, nor was the carbon dioxide related to the electrical energy used to produce oxygen for enrichment of the blast air.) This total is calculated readily from the reported fuel rates; see Table 2. The actual emissions occur at numerous places, listed in Table 1 (based on the data reported to the EPA): the blast furnace top gas is used as fuel in the blast furnace stoves and in several boilers, and some is flared. These emission points and rates are obtained readily from the data reports available in FLIGHT. Each report lists the process units, and the fuel type and emissions for each unit.
While most of the carbon that enters the blast furnace as fuel leaves as blast furnace gas, some also leaves as dust within this gas, and as dissolved carbon in the hot metal. Dust was not considered in this analysis. Dissolved carbon in the hot metal is largely oxidized away (and removed as off-gas) in the oxygen converters (or Basic Oxygen Furnaces, “BOF” in Table 1). These emissions are available in the FLIGHT reports, and are included in Table 1. The table shows that the CO 2 emissions at the oxygen converters account for about 10% of the total emissions that can be traced back to ironmaking fuels. This is a reasonable number: the total carbon rate in fuel was estimated to be 411 kg carbon per tonne of hot metal (THM), and the hot metal typically contains around 4.5% dissolved carbon (45 kg C/THM). Nearly all of this dissolved carbon is removed at the converters, so the expected percentage of the carbon from blast furnace fuel that is emitted at the converters is around 45/411 = 11%, close to the value of 10% in Table 1.
Electric Arc Furnace
Carbon dioxide emissions in the off-gas from an electric furnace is caused by oxidation of carbonaceous material in scrap, of electrodes, and of injected carbonaceous fuels (such as coal and natural gas ). The sources of oxygen are “false air” sucked into the furnace by the action of the off-gas system, and intentionally injected oxygen [11]. Reaction of oxygen with carbonaceous fuels and dissolved carbon in the furnace forms carbon monoxide as one of the main products, and benefits steelmaking : The CO bubbles foam the slag (resulting in higher energy efficiency ) and generation of CO within the metal bath flushes out nitrogen (and also limits nitrogen pick-up) [12].
The consumption rates of fuels other than natural gas are not reported in the AIST Electric Arc Furnace Roundup. The approach that was tested here was to assume that injected oxygen (and not false air) is the main source of oxygen in the furnace , and that combustion within the furnace only proceeds as far as CO and H2. Under this assumption, the molar rate of CO emission from the furnace (which is equal to the molar flow rate of CO 2 out of the furnace off-gas system) is exactly twice the molar injection rate of O2.
Justification for this assumption is that modern electric arc furnaces do feature high rates of oxygen injection (likely higher than the rates of false-air entrainment), and that the effect of oxygen on electrical energy consumption appears compatible with CO (rather than CO 2 or H2O) being the main combustion product. More detailed analysis of these points is as follows.
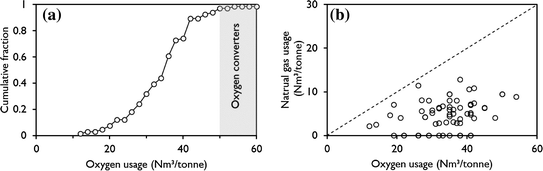
Oxygen and natural gas consumption in selected U.S. electric arc steelmaking furnaces in 2017, drawn using the 2018 AIST Electric Arc Furnace Roundup [3]. a Number-based distribution of the oxygen usage per tonne of steel . b Comparison of injection rates of natural gas and oxygen; the broken line is the stoichiometric oxygen requirement
The C:O molar ratio in the off-gas is the other major part of the assumption, and was taken to be 1. Combustion of carbon to CO releases much less energy than does combustion to CO 2. A simply energy balance shows that combustion of pure carbon with pure oxygen, both initially at 298 K, would yield 1.46 kWh per Nm3 of oxygen if the product is CO , but 3.85 kWh per Nm3 of oxygen for complete combustion of carbon to CO 2 (both values are for an off-gas temperature of 1873 K). The values were used for comparison with the actual energy consumption of the set of furnaces. A complication is that natural gas injection through well-designed burners (with associated oxygen injection) significantly increases heat input into the furnace (that is, it decreases the electrical energy consumption). An approximate correction was made by adding a value equal to 8MG to the reported electrical energy consumption (in kWh/tonne), where MG is the natural gas rate in Nm3/tonne. The value of 8 (units: kWh/Nm3) is from the correlation of Kleimt et al. [14]. Adding this term gives an estimate of what the energy consumption would have been in the absence of natural gas injection.
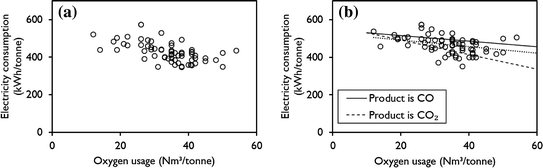
Oxygen usage and electrical energy consumption in selected U.S. electric arc steelmaking furnaces in 2017, drawn using the 2018 AIST Electric Arc Furnace Roundup [3]. a Gives the original data. In b the estimated effect of natural gas injection on energy consumption has been removed. The lines give the expected effect of oxygen injection on electrical energy requirement if cold carbon is combusted with cold oxygen to CO or CO 2 at 1873 K, and all else remains equal. The dotted line is a fitted linear trendline
A final assumption which had to be made in calculating the CO 2 emissions from the roundup data is that the production rate of the furnace was taken to be equal to its nominal capacity.
Discussion of Results
The main result is that the CO 2 emissions calculated from the AIST Roundup data are very close to the emissions reported to the EPA: for both approaches, the value for the AK Steel Middletown blast furnace is 3.0 million tonnes of CO 2. Similarly, for the SSAB Iowa electric furnace the emissions total is 0.18 million tonnes CO 2 for both approaches. It will be of interest to expand this analysis to a much larger set of furnaces.
The relatively low CO 2 emission from the electric furnace is a result of three factors: its lower production rate (1.1 million tonnes of steel per year; in contrast, the blast furnace produced 2.0 million THM in 2016), the inherently lower carbon intensity of electric furnace steelmaking compared with blast furnace ironmaking, and the absence of carbon emissions from electricity generation in this comparison. As Table 3 shows, the estimated total CO 2 from combustion in the furnace was approximately 0.16 ton CO 2 per ton steel , whereas that due to furnace electricity consumption was 0.23 ton CO 2 per ton steel —that is, about 60% of the furnace -related CO 2 emissions occurred during generation of electrical power outside the steel plant.
Conclusion
Detailed information on iron and steelmaking processes in the U.S.A. and their emissions is contained in data collected and published by the Association for Iron and Steelmaking Technology and the Environmental Protection Agency. The initial test that is reported here indicates that the two data sets are compatible, and can be used to identify trends in steelmaking operations, and the possibilities and impacts of future changes.
Acknowledgements
I am grateful for support of this work by the industrial members of the Center for Iron and Steelmaking Research. An initial version of calculation was an exercise for students in a Processing Design class at Carnegie Mellon University; their interest and industry are acknowledged.