Chapter 5
Presenting Data in a Report
IN THIS CHAPTER
 Creating a new report
 Opening a report
 Changing the look of a report
The prettiest way to present data in a database table or query is to present it in a report. Even people who are allergic to databases can put up with database material in a report. Reports are easy to read and understand. They succinctly present the data so that you and others can interpret it. This brief chapter explains how to create reports, open them, and edit them.
Creating a Report
Access comes with all kinds of complicated tools for fashioning your own report — for laying out the pages in different ways and making data fields show up in different parts of the page. If ever a task called for relying on a wizard, creating a report is it. You can save yourself a lot of trouble, and fashion sophisticated-looking reports as well, by dispensing with the fancy report-making tools and letting the wizard do the job.
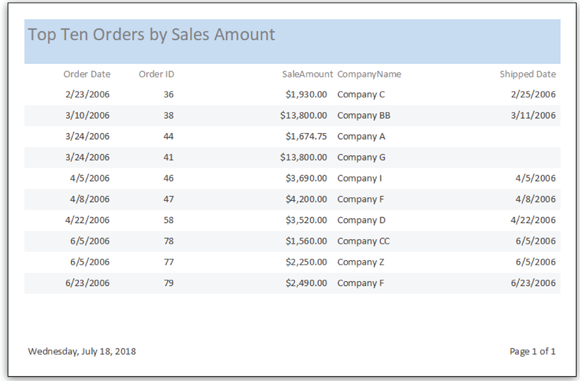
Figure 5-1 shows a report created with the Report Wizard. To create a report with the Report Wizard, go to the Create tab and click the Report Wizard button. You see the first of several Report Wizard dialog boxes. Negotiate the dialog boxes as follows, clicking the Next button as you go along:
- Tables/Queries: Open the Table/Queries drop-down list and choose the query where the information in the report will come from. A list of fields in the query appears in the Available Fields box.
- Available Fields and Selected Fields: Select the fields whose data you want in the report by selecting the fields one at a time and clicking the > button. Doing so moves field names from the Available Fields box to the Selected Fields box. Add all the fields by clicking the >> button.
- Do You Want to Add Any Grouping Levels?: Include subheadings in your report by selecting a field name and clicking the > button to make it a subheading. If you're building your report on a query that includes related tables, the Report Wizard automatically adds subheadings.
- What Sort Order Do You Want?: Select up to four fields to sort the data in your report. Even if you sort the fields in a query, the report handles sorting on its own. If you include grouping levels, the report already sorts on these fields.
- How Would You Like to Lay Out Your Report?: Experiment with the options, and watch the Preview box, to choose a layout for your report. If your report has a lot of fields, you may want to print it in Landscape view.
- What Title Do You Want for Your Report?: Enter a descriptive title. The name you choose appears in the Reports group in the Navigation pane. From there, you double-click the name when you want to see the report.
- Preview the Report: Select this option button and click Finish.

FIGURE 5-1: An example of a report.
The report appears in the Preview window. How do you like it? Later in this chapter, “Tweaking a Report” offers some tips for making a report look spiffier.
Opening and Viewing Reports
If you’ve spent any time whatsoever in Access, you know the drill for opening a so-called object. Follow these steps to open a report:
In the Navigation pane, select the Reports group.
You see the names of reports you created.
Double-click a report name or right-click a name and choose Open from the shortcut menu.
The report appears in Report view.
Tweaking a Report
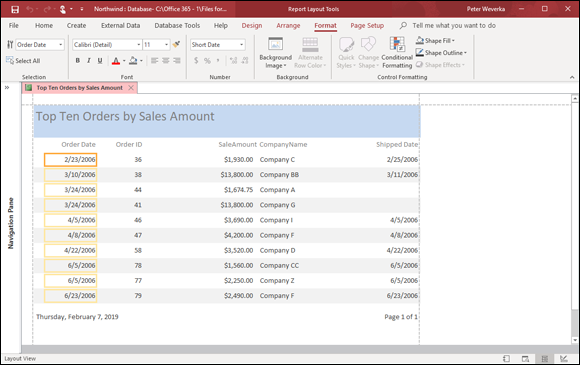
As I mention at the start of this chapter, Access offers a bunch of complex tools for changing the layout and appearance of a report. If you’re courageous and have lots of time on your hands, you’re invited to take these tools in hand and go to it. In the Reports group of the Navigation pane, right-click a report and choose Layout View on the shortcut menu. Your report appears in Layout view, as shown in Figure 5-2. In this view, using tools on the Report Layout Tools tabs, you can tweak your report’s appearance.

FIGURE 5-2: The report in Figure 5-1 in Layout view.
I tell you how to create a report with the Report Wizard in order to avoid your having to visit this imposing window. However, you can change a report’s appearance in Layout view without going to very much trouble if you follow these instructions:
- Choosing a new layout: On the (Report Layout Tools) Arrange tab, click the Stacked or Tabular button, or click the Gridlines button and choose an option on the drop-down list, to change your report’s layout.
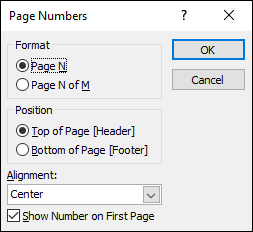
- Including page numbers: To include page numbers on the report, go the (Report Layout Tools) Design tab and click the Page Numbers button. You see the Page Numbers dialog box shown in Figure 5-3. Choose the Page N option button to display a page number only, or select the Page N of M option button to display a page number as well as the total number of pages in the report (as in “Page 2 of 4”). Choose Position and Alignment options to describe where on the page to put the page number.
- Changing the margins: On the (Report Layout Tools) Page Setup tab, click the Margins button and select Normal, Wide, or Narrow on the drop-down list.

FIGURE 5-3: Putting on the page numbers.
 What’s more, the easiest and best way to make a report is to base your report on a query. As part of fashioning a report with a wizard, you can tell Access which database tables and which fields to get the data from. In other words, you can query your database from inside the Report Wizard. However, doing that requires turning somersaults and cartwheels. Far easier is to run a query to produce the results you want in your report, save your query, and then fashion a report from the query results.