Chapter 1
Creating a Chart
IN THIS CHAPTER
 Creating a chart
Positioning a chart in Excel, Word, and PowerPoint
Changing the appearance of a chart
Exploring some fancy-schmancy chart tricks
Nothing is more persuasive than a chart. The bars, pie slices, lines, or columns show immediately whether production is up or down, cats are better than dogs or dogs better than cats, or catsup tastes better than ketchup. Fans of charts and graphs will be glad to know that putting a chart in a Word document, Excel worksheet, or PowerPoint slide is fairly easy.
This chapter explains how to create a chart. It looks at which charts are best for presenting different kinds of data, how to change a chart’s appearance, and how to save charts in a template that you can use again. You discover some nice chart tricks, including how to make a picture the backdrop for a chart and how to annotate a chart. This chapter also addresses common chart problems.
The Basics: Creating a Chart
Throughout this chapter, I explain the whys, wherefores, and whatnots of creating a chart. Before going into details, here are the basic steps that everyone needs to know to create a chart in Word, Excel, and PowerPoint:
- Go to the Insert tab.
If you’re working in Excel, select the data you’ll use to generate the chart (in Word and PowerPoint, skip to Step 3).
In Excel, you select the data on a worksheet before creating the chart, but in Word and PowerPoint, you enter the data for the chart after you create the chart.
Select the kind of chart you want.
How you select a chart type depends on which program you’re working in:
- Excel: On the Insert tab, open the drop-down list on one of the buttons in the Charts group (Column, Bar, and so on) and select a chart type; or click the Recommended Charts button or Charts group button to open the Insert Chart dialog box and select a chart there. As shown in Figure 1-1, the Insert Chart dialog box shows all the kinds of charts you can create. Go to the Recommended Charts tab to see which charts Excel recommends.
- Word and PowerPoint: Click the Chart button. You see the Insert Chart dialog box shown in Figure 1-1. Select a chart type, select a variation, and click OK. A data grid opens on your screen. (In PowerPoint, you can also click the Chart icon on a placeholder frame to open the Insert Chart dialog box.)
The next topic in this chapter, “Choosing the Right Chart,” describes all the charts types and advises you which to choose.
In Word and PowerPoint, replace the sample data in the data grid with the data you need for generating your chart.
Later in this chapter, “Providing the Raw Data for Your Chart” explains how to enter data in the data grid, and the sidebar “Getting chart data from a table (Word and PowerPoint)” explains how to copy the data from a table.
After you finish entering the data, click the Close button in the data grid.
Modify your chart, if you desire.
The Chart Tools tabs and buttons to the right of the chart offer commands for making a chart look just-so (see “Changing a Chart’s Appearance,” later in this chapter).
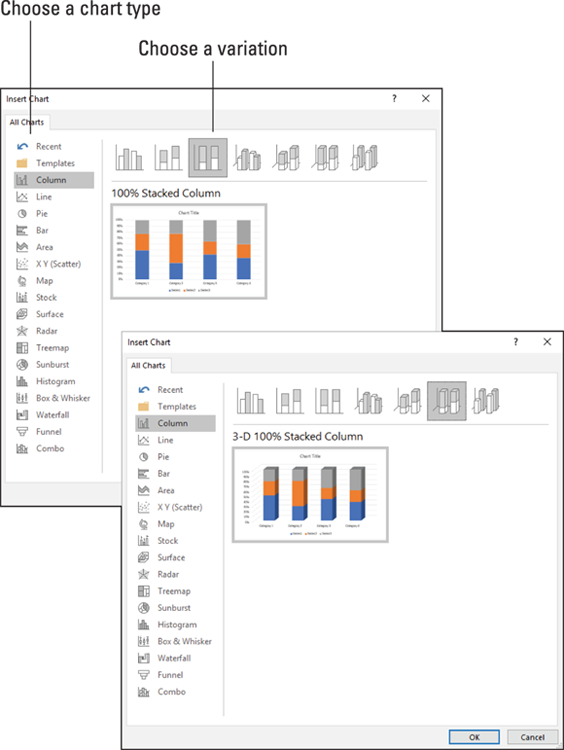
FIGURE 1-1: Which chart do you want?
 Click the Recent button in the Insert Chart dialog box to see all the charts you examined in your search for the right chart.
And if you decide to delete the chart you created? Click its perimeter to select it and then press the Delete key.
Choosing the Right Chart
If you’re a fan of charts, the huge selection of charts can make you feel like a kid in a candy store, but if charts aren’t your forté, the wealth of charts you can choose from can be daunting. You can choose among charts in 17 categories (refer to Figure 1-1). Which chart is best? The golden rule for choosing a chart type is to choose the one that presents information in the brightest possible light. The purpose of a chart is to compare information across different categories. Select a chart that draws out the comparison so that others can clearly make comparisons. Table 1-1 describes the 17 chart types and explains in brief when to use each type of chart.
TABLE 1-1 Chart Types
Chart Type |
Best Use/Description |
Area |
Examine how values in different categories fluctuate over time, and see the cumulative change in values. (Same as a line chart except that the area between trend lines is colored in.) |
Bar |
Compare values in different categories against one another, usually over time. Data is displayed in horizontal bars. (Same as a column chart except that the bars are horizontal.) |
Box & Whisker |
Examine how data is distributed (the whiskers define the range of data and the boxes define the median). |
Column |
Compare values in different categories against one another, usually over time. Data is displayed in vertical columns. (Same as a bar chart except that the bars are vertical.) |
Combo |
Contrast two sets of data, with one chart overlying the other to draw out the contrast. Data is displayed in lines, bars, and stacks. |
Funnel |
Compare data items as the proportion of a whole. Data is displayed in bars of progressively decreasing size. This chart is used to show data loss at each stage of a process. |
Histogram |
Measure the frequency of data. Data is displayed in bars, with the width of each bar representing a data range and the height of each bar representing the frequency of data within the range. |
Line |
Examine how values fluctuate over time. Data is displayed in a set of points connected by a line. |
Map |
Compare data across geographical regions. One data axis must contain countries, regions, or postal codes that Office recognizes as geographical regions. |
Pie |
See how values compare as percentages of a whole. Data from categories is displayed as a percentage of a whole. |
Radar |
Examine data as it relates to one central point. Data is plotted on radial points from the central point. This kind of chart is used to make subjective performance analyses. |
Stock |
See how the value of an item fluctuates as well as its daily, weekly, or yearly high, low, and closing price. This chart is used to track stock prices, but it can also be used to track air temperature and other variable quantities. |
Surface |
Examine color-coded data on a 3-D surface to explore relationships between data values. |
Sunburst |
Compare values at different levels of a hierarchy. This chart is a stacked, or multilevel, pie chart. |
Treemap |
Evaluate data in nested rectangles that show the relative size of data and the relationship between data items. |
Waterfall |
See how positive and negative values contribute to a cumulative value. |
XY (Scatter) |
Compare different numeric data point sets in space to reveal patterns and trends in data. (Similar to a bubble chart except that the data appears as points instead of bubbles.) |
Providing the Raw Data for Your Chart
Every chart is constructed from raw data — the numbers and labels you select in an Excel worksheet (in Excel) or enter in the data grid (in Word and PowerPoint). If you’re operating in Word or PowerPoint, you see, in the data grid, sample data in a data range, as shown in Figure 1-2. The information inside the data range is used to generate the chart. You can tell where the data range begins and ends because it is enclosed in a blue border. Your job is to replace the sample data in the data range with data of your own. As you enter your data, the chart on your slide or page takes shape.
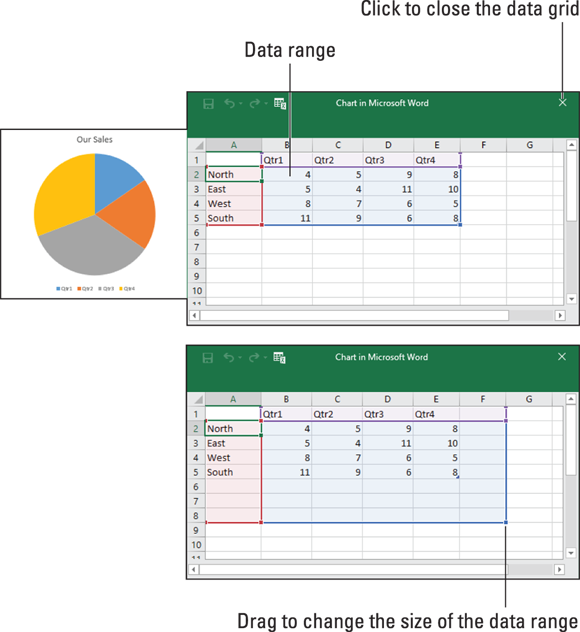
FIGURE 1-2: To create a chart in Word or PowerPoint, enter data in the data grid.
As you enter numbers and labels in the data grid, watch your chart take shape. Here are the basics of entering data in the data grid:
- Entering the data in a cell: A cell is the box in a data grid where a column and row intersect; each cell can contain one data item. To enter data in a cell, click the cell and start typing. When you’re finished, press Enter, press Tab, or click a different cell.
- Deleting the data in a cell: To delete the data in a cell, including the sample data, click the cell and press Delete.
 Displaying the numbers: When a number is too large to fit in a cell, the number is displayed in scientific notation (you can double-click the number to enlarge the cell in which it is located). Don’t worry — the number is still recorded and is used to generate your chart. You can display large numbers by widening the columns in which the numbers are found. Move the pointer between column letters (A, B, and so on at the top of the worksheet) and when you see the double-headed arrow, click and drag to the right.
- Changing the size of the data range: To enclose more or fewer cells in the data range, move the pointer to the lower-right corner of the data range, and when the pointer changes into a two-headed arrow, click and drag so that the blue box encloses only the data you want for your chart (refer to Figure 1-2).
The data grid offers the Edit Data in Microsoft Excel button in case you want to enter data for your chart in Excel. Click this button and enter data in Excel if you’re comfortable working there.
In Word and PowerPoint, click the Edit Data button on the (Chart Tools) Design tab at any time to open the data grid and fiddle with the numbers and data from which your chart is generated.
Positioning Your Chart in a Workbook, Page, or Slide
To change the position of a chart, click to select it, click its perimeter, and when you see the four-headed arrow, start dragging. Otherwise, follow these instructions to land your chart where you want it to be:
- Excel: To move your chart to a different worksheet or create a new worksheet to hold your chart, go to the (Chart Tools) Design tab and click the Move Chart button. You see the Move Chart dialog box.
- To move your chart to a different worksheet, click the Object In option button, choose the worksheet in the drop-down list, and click OK.
- To create a new worksheet for a chart, click the New Sheet option button, enter a name for the new worksheet, and click OK.
Word: Starting in Print Layout view, select your chart, and in the Layout or (Chart Tools) Format tab, click the Position button (you may have to click the Arrange button first, depending on the size of your screen). You see a drop-down list with text-wrapping options. Choose the option that describes how you want surrounding text to behave when it crashes into your chart. Book 2, Chapter 6 looks in detail at wrapping text around charts and other objects in Word.
You can also position a chart by selecting it, clicking the Layout Options button, and choosing an option on the Layout Options drop-down menu. The Layout Options button appears to the right of a chart after you select a chart.- PowerPoint: Select the chart and drag it on the slide to the right position.
Changing a Chart’s Appearance
Charts are awfully nice already, but perhaps you want to redesign one. Perhaps you’re an interior decorator type and you want to give charts your own personal touch. Office presents many different ways to refine a chart. As shown in Figure 1-3, you can click one of the three buttons — Chart Elements, Chart Styles, or Chart Filters — that appear beside a chart when you select it. You can also go to (Chart Tools) Design tab and the (Chart Tools) Format tab. Your opportunities for tinkering with a chart are many.
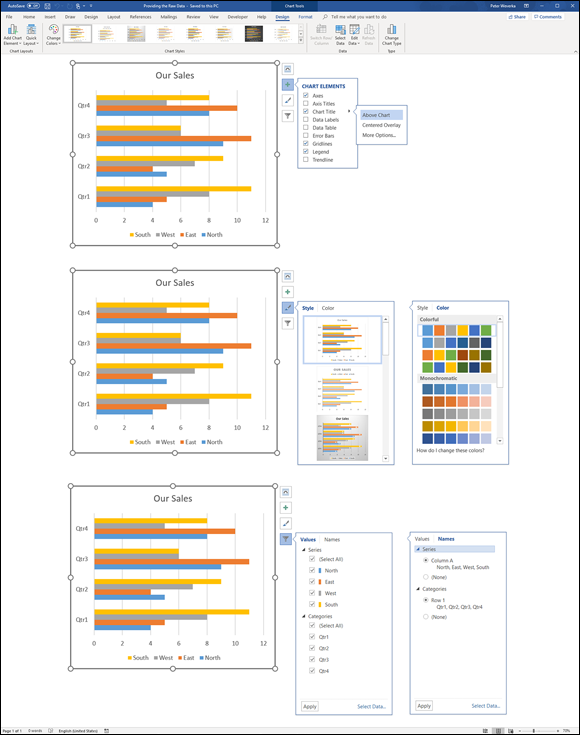
FIGURE 1-3: Click a button to the right of a chart or go to the (Chart Tools) Design or Format tab to change the look of a chart.
These pages explain how to change a chart’s appearance and layout, starting with the biggest change you can make — exchanging one type of chart for another.
Changing the chart type
The biggest way to overhaul a chart is to ditch it in favor of a different chart type. Luckily for you, Office makes this task simple. I wish that changing jobs was this easy. Follow these steps to change a pumpkin into a carriage or an existing chart into a different kind of chart:
- Click your chart to select it.
On the (Chart Tools) Design tab, click the Change Chart Type button, or right-click your chart and choose Change Chart Type on the shortcut menu.
The Change Chart Type dialog box appears. Does it look familiar? This is the same dialog box you used to create your chart in the first place.
Select a new chart type and click OK.
Not all chart types can be converted successfully to other chart types. You may well have created a monster, in which case go back to Step 1 and start all over or click the Undo button.
Changing the size and shape of a chart
To make a chart taller or wider, follow these instructions:
- Click the perimeter of the chart to select it and then drag a handle on the side to make it wider, or a handle on the top or bottom to make it taller.
- Go to the (Chart Tools) Format tab and enter measurements in the Height and Width boxes. You can find these boxes in the Size group (you may have to click the Size button to see them, depending on the size of your screen).
Choosing a new look for your chart
Select your chart and experiment with these different ways to change its look:
- Select a chart style: On the (Chart Tools) Design tab, choose an option in the Chart Styles gallery. Or click the Chart Styles button and select a style on the drop-down menu (refer to Figure 1-3).These gallery options are quite sophisticated. You would have a hard time fashioning these charts on your own.
- Change the color scheme: On the (Chart Tools) Design tab, click the Change Colors button and select a color on the drop-down list. Or click the Chart Styles button and select a color on the drop-down menu (refer to Figure 1-3).
Later in this chapter, “Changing a chart element’s color, font, or other particular” explains how to dig down deep and change one particular aspect of a chart — its legend, plot area, or vertical axis, for example.
 If your file includes more than one chart, make the charts consistent with one another. Give them a similar appearance so that your file doesn’t turn into a chart fashion show. You can make charts consistent with one another by choosing similar options for charts in the Chart Styles gallery.
Changing the layout of a chart
Charts are composed of different elements — the legend, the labels, and the titles. Figure 1-4 identifies chart elements. Where these elements appear is up to you. Whether to include them is up to you as well. You can, for example, place the legend on the right side of your chart or go without a legend. By choosing which elements to include and where to put elements, you fashion a layout for your chart.

FIGURE 1-4: The layout elements of a chart.
Select your chart and experiment with these techniques to decide on a layout:
- On the (Chart Tools) Design tab, click the Quick Layout button and select an option in the gallery.
- On the (Chart Tools) Design tab, click the Add Chart Element button. Then choose an element on the drop-down list, and on the submenu, choose whether to place the element (the None option) or where to place it.
- Click the Chart Elements button, choose an element on the drop-down menu, and choose whether to place it (the None option) or where to place it. Figure 1-5, for example, shows how to choose where to place the legend.
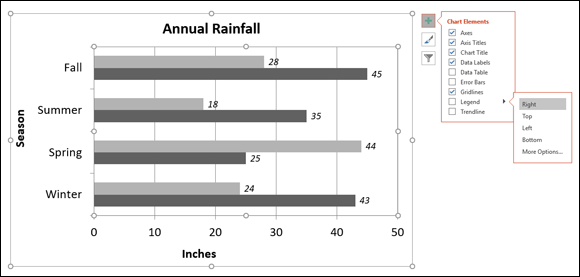
FIGURE 1-5: Clicking the Chart Elements button is one way to handle chart layouts.
Hover the pointer over the options on the Chart Elements menus and glance at your chart. You can see right away what each option does to your chart.
To remove series or category names from a chart, click the Chart Filters button and, on the drop-down menu, deselect a column or row option button (see Figure 1-3).
Handling the gridlines
Gridlines are lines that cross a chart and indicate value measurements. Most charts include major gridlines to show where bars or columns meet or surpass a major unit of measurement, and you can also include fainter, minor gridlines that mark less significant measurements.
Use these techniques to handle gridlines:
- On the (Chart Tools) Design tab, click the Add Chart Element button, choose Gridlines on the drop-down list, and select or deselect an option on the submenu.
- Click the Chart Elements button, choose Gridlines, and select or deselect a check box on the submenu, as shown in Figure 1-6.
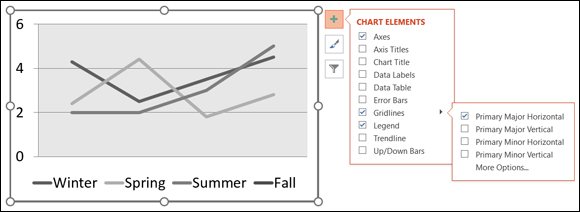
FIGURE 1-6: Choosing a Gridlines option by way of the Chart Elements button.
Deselecting all the gridline options removes the gridlines from a chart. Choose More Options on the submenu to open the Format Major Gridlines task pane, where you can change the color of gridlines, make gridlines semitransparent, and make gridlines wider or narrower.
Gridlines are essential for helping read charts, but be very, very careful about displaying minor gridlines on charts. These lines can make your chart unreadable. They can turn a perfectly good chart into a gaudy pinstripe suit.
Changing a chart element’s color, font, or other particular
The (Chart Tools) Format tab is the place to go to change the color, line width, font, or font size of a chart element. Go to the (Chart Tools) Format tab, for example, to change the color of the bars in a bar chart, the color of text, or the chart background color.
Follow these basic steps to change a color, line width, font, or font size in part of a chart:
- Go to the (Chart Tools) Format tab.
In the Chart Elements drop-down list, select the chart element that needs a facelift.
You can find this list in the upper-left corner of the screen, as shown in Figure 1-7.
Click the Format Selection button.
The Format task pane opens (see Figure 1-7).
Format the chart element you selected.
In the Format task pane, you can find all the tools you need to change the color, outline, and size of a chart element. These tools are explained in detail in Chapter 4 of this minibook.
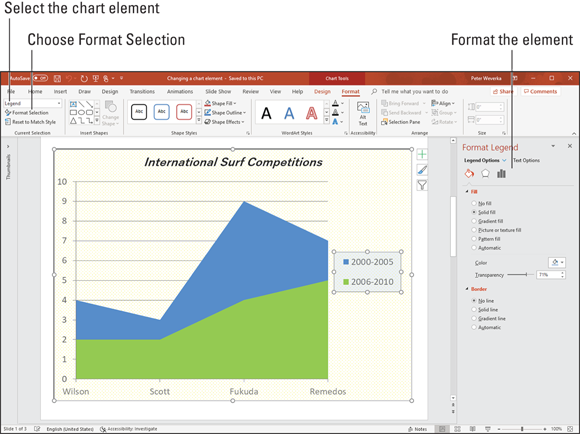
FIGURE 1-7: Choose what you want to format on the Chart Elements drop-down list.
If your experiments with retouching a chart go awry and you want to start over, click the Reset to Match Style button on the (Chart Tools) Format tab.
Saving a Chart as a Template So That You Can Use It Again
If you go to the significant trouble of redecorating a chart and you expect to do it again the same way in the future, save your chart as a template. This way, you can call on the template in the future to create the same chart and not have to decorate it again. Perhaps you’ve created charts with your company’s colors or you’ve created a chart that you’re especially proud of. Save it as a template to spare yourself the work of reconstructing it.
A chart template holds data series colors, gridline settings, plot area colors, font settings, and the like. It doesn’t hold data. These pages explain how to save a chart as a template and how to create a chart with a template you created.
Saving a chart as a template
Follow these steps to make a template out of a chart:
- Save your file to make sure the chart settings are saved on your computer.
- Select your chart.
Right-click your chart and choose Save As Template on the shortcut menu.
You see the Save Chart Template dialog box.
Enter a descriptive name for the template and click the Save button.
Include the type of chart you’re dealing with in the name. This will help you understand which template you’re selecting when the time comes to choose a chart template.
 By default, chart templates are saved in this folder:
 C:\Users\Username\AppData\Roaming\Microsoft\Templates\Charts. The templates have the .ctrx extension. If you want to delete or rename a template, open the Charts folder in File Explorer and do your deleting and renaming there. You can open the Charts folder very quickly by clicking the Manage Templates button in the Insert Chart dialog box (this button appears after you choose the Templates category).
Creating a chart from a template
To create a chart from your own customized template, open the Create Chart dialog box (click the Chart button) and go to the Templates category. The dialog box shows a list of templates you created. Move the pointer over a template to read its name in a pop-up box. Select a template and click OK.
Chart Tricks for the Daring and Heroic
This chapter wouldn’t be complete without a handful of chart tricks to impress your friends and intimidate your enemies. In the pages that follow, you discover how to make charts roll over and play dead. You also find out how to decorate a chart with a picture, annotate a chart, display worksheet data alongside a chart, and create a combo chart.
Decorating a chart with a picture
As shown in Figure 1-8, a picture looks mighty nice on the plot area of a chart — especially a column chart. If you have a picture in your computer that would serve well to decorate a chart, you are hereby encouraged to start decorating. Follow these steps to place a picture in the plot area of a chart:
- Select your chart.
- On the (Chart Tools) Format tab, open the Chart Elements drop-down list and choose Plot Area.
Click the Format Selection button.
The Format Plot Area task pane opens.
- If necessary, click Fill & Line to display the Fill and Border options, and under Fill, click the Picture or Texture Fill option button.
Click the File button.
You see the Insert Picture dialog box.
Locate the picture you need and select it.
Try to select a light-colored picture that will serve as a background. Chapter 3 of this minibook explains how you can recolor a picture to make it lighter.Click the Insert button.
The picture lands in your chart.
You may need to change the color of the data markers — the columns, bars, lines, or pie slices — on your chart to make them stand out against the picture. See “Changing a chart element’s color, font, or other particular,” earlier in this chapter.
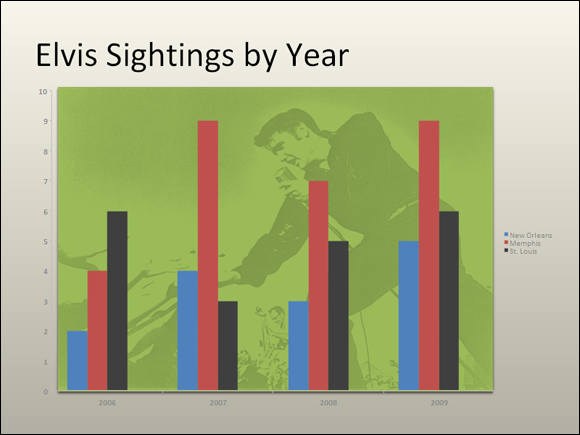
FIGURE 1-8: Using a picture as the backdrop of a chart.
Annotating a chart
To highlight part of a chart — an especially large pie slice, a tall column, or a bar showing miniscule sales figures — annotate it with a callout text box and place the text box beside the pie slice, column, or bar. Figure 1-9 shows an example of an annotated chart. The annotation tells you that one sector isn’t performing especially well and somebody ought to get on the ball.
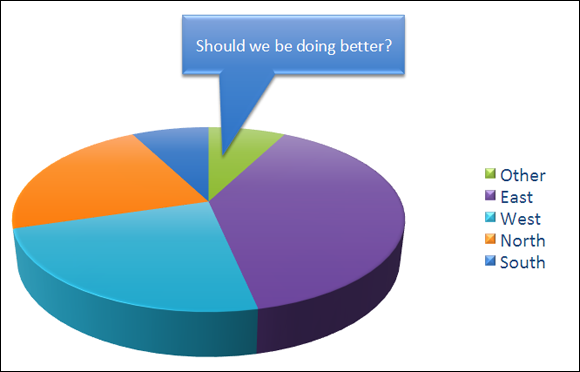
FIGURE 1-9: Annotations point out a chart’s salient features.
To annotate a chart, select a callout shape, enter text in the callout shape, and connect the shape to part of your chart. Follow these steps to annotate a chart:
- Select your chart and go to the (Chart Tools) Format tab.
Open the Shapes gallery, scroll to the Callouts section of the drop-down list, and choose a callout.
Depending on the size of your screen, you may have to click the Insert button to get to the Shapes button.
Drag on the page or slide to draw the callout shape.
Chapter 4 of this minibook explains drawing shapes in gory detail.
Type the annotation inside the callout shape.
After you type the text, you can select it, go to the Home tab, and choose a font and font size for it.
- Resize the callout shape as necessary to make it fit with the chart.
Drag the orange circle on the callout shape to attach the callout to the chart.
You probably have to do some interior decorating to make the callout color fit with the chart. Chapter 4 of this minibook explains how to change an object’s color.
Displaying the raw data alongside the chart
Showing the worksheet data used to produce a chart is sort of like showing the cops your ID. It proves you’re the real thing. It makes your chart more authentic. If yours is a simple pie chart or other chart that wasn’t generated with a large amount of raw data, you can display the data alongside your chart in a data table. Anyone who sees the table knows you’re not kidding or fudging the numbers.
To place a table with the raw data below your chart, go to the (Chart Tools) Design tab, open the Quick Layout gallery, and select a layout that includes a data table.
To format a data table, go to the (Chart Tools) Format tab, open the Chart Element drop-down list, and choose Data Table. Then click the Format Selection button. You see the Format Data Table task pane, where you can fill the table with color and choose colors for the lines in the table.
Placing a trendline on a chart
Especially on column charts, a trendline can help viewers more clearly see changes in data. Viewers can see, for example, that sales are going up or down, income is rising or falling, or annual rainfall is increasing or decreasing. Figure 1-10 shows an example of a trendline on a chart. In this case, the trendline shows that the deer population in Sacramento County is rising.
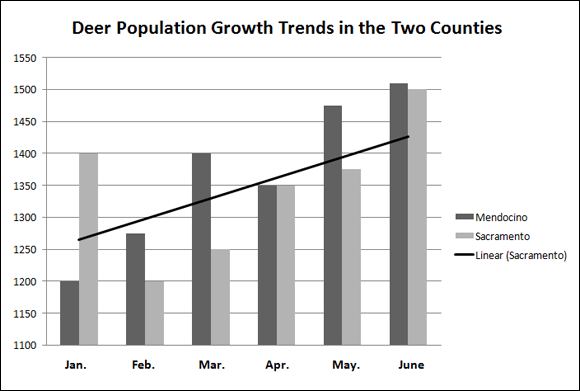
FIGURE 1-10: A trendline helps viewers recognize changes in data.
Follow these steps to put a trendline on a chart:
- On the (Chart Tools) Design tab, click the Add Chart Element button.
Choose Trendline on the drop-down list and select a trendline option on the submenu.
The Add Trendline dialog box appears.
- Choose the data series that you want to highlight with a trendline and click OK.
To remove a trendline from a chart, go to the (Chart Tools) Design tab, click the Add Chart Element button, choose Trendline on the drop-down list, and choose None on the submenu.
Troubleshooting a Chart
Sometimes tinkering with a chart opens a Pandora’s Box of problems. You find yourself having to correct little errors that appear in charts. Here are some shorthand instructions for fixing common chart problems:
- The dates in the chart aren’t formatted right. To change the way in which dates are formatted on a chart, go to the (Chart Tools) Format tab, open the Chart Elements drop-down list, and choose Horizontal (Value) Axis or Vertical (Value) Axis. Then click the Format Selection button, and in the Format Axis task pane, go to the Number category, select Date in the Category menu, and choose a date format.
- The numbers in the chart aren’t formatted right. To change the number of decimal places, include comma separators in numbers, display currency symbols, or do all else that pertains to numbers, go to the (Chart Tools) Format tab, open the Chart Elements drop-down list, and choose Horizontal (Value) Axis or Vertical (Value) Axis. Then click the Format Selection button. You see the Format Axis task pane. Visit the Number category and select options for displaying numbers.
- “Category 1” or “Series 1” appears in the chart legend. To direct you to the right place to enter data in the data grid, phantom names such as “Category 1” and “Series 1” appear in worksheets. Sometimes these phantoms wind up in chart legends as well. To remove them, go to the (Chart Tools) Design tab and click the Edit Data button. You see the data grid, where the data range used to generate the chart is enclosed in a blue box. Drag the lower-right corner of the box so that the box encloses only the data you want for your chart.
- In 3-D charts, small markers are obscured by large markers in the foreground. For all the data markers to be shown in a 3-D chart, the smaller ones have to be in the foreground. To rearrange data markers, go to the (Chart Tools) Design tab and click the Select Data button to open the Select Data Source dialog box. Then select a series and click the Up or Down button to rearrange the series in your chart. Series that are high on the list go to the back of the chart; series that are low on the list go to the front.
- The chart doesn’t gather all data from the worksheet. On the (Chart Tools) Design tab, click the Edit Data button, and in the data grid that stores data for your chart, enlarge the blue data-range box so that it encloses all your data. You can enlarge the box by dragging its lower-right corner.