On 3rd and 4th December 1790, the first ever map auction took place at Christie’s in London’s Pall Mall. The lots included a map of London at the time of Queen Elizabeth, many privately-commissioned surveys of the English counties, recent coastal maps of North America, twenty-odd maps of Scotland (including several unfinished manuscript proofs), and seventy-eight sheets of the Cassini family’s map of France. The sale also included a valuable selection of books: a good smattering of travel writing, including recent volumes on the interior of Africa and Captain Cook’s last voyage towards the South Pole, and an extensive range of specialist books about mathematics and surveying, many of them published in France the decade before, including Cassini de Thury’s Description Géométrique de la France and Cagnoli’s Traite de Trigonometrie.
And then there was what the auction catalogue called ‘A Capital Collection’ of engineering and measuring instruments, which was also a great rarity for an auction house at this time (Mr Christie, as the sale catalogue had him, had only established his business in the 1760s). The lots suggested a life of curiosity and adventure: there were many quadrants, sextants, compasses and barometers, there were theodolites and telescopes, ‘a four eye glass perspective’ and a four-foot achromatic telescope made by the optics dynasty of John and Peter Dollond (150 years before they met Aitchison; Admiral Nelson also owned a Dolland). Then there were delineators, thermometers, plotting scales, a portable camera obscura, a Gunter’s chain and something listed as ‘a small electrical machine’, whose purpose was unknown.

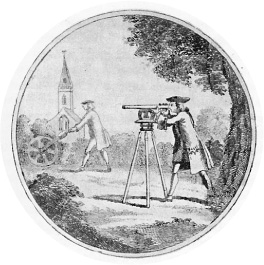
Every tool but the Gunter’s Chain: theodolite and waywiser at work in the eighteenth century.
But who once owned these things?
They were the property of General William Roy, who had died five months before, and were the tools of the trade of the man who effectively invented the Ordnance Survey. The project he inspired mapped not only the entire contents of Great Britain – every orchard, each bracket, every saltmarsh and saltings, at a scale and thoroughness hitherto thought impossible – but also reshaped British understanding and appreciation of its landscape, its property boundaries, its urban and rural planning, engineering, archaeology, district and tax laws. The mapping of Great Britain was, initially, a project of more than sixty years, and it resulted in, effectively, a cartographic Domesday Book. It almost defined Britain and – just before the birth of the railways, and long before the BBC and the National Health – it became the envy of the world.
Does it continue to be indispensable? Stuck out on a Peak District promontory in all weathers you may still think there is nothing like it on God’s blue-green planet. And you would be right.
j
The great Trigonometrical Survey of the Board of Ordnance began officially in June 1791. Prior to this date it is sometimes imagined that the country was hardly mapped properly at all, a blur of ploughed field and wayside inns broken by early stirrings of industrial sprawl. In fact, the opposite was the case – though compared to the rigour of the OS, it was cartographic anarchy.
By the dawn of the eighteenth century, the London survey and country strip maps made by John Ogilby were long out of date – and the county maps of Christopher Saxton and John Speed even more so. But Britain had become obsessed by mapping. From the 1750s on, a great many people were out at all hours with their Gunter’s chains and their eyepieces, creating maps for commercial or land interests, or assessing tax liabilities (‘cadastral’ maps). Prominent (and accurate) county surveys were also conducted by expert plotters such as Carrington Bowles, Robert Sayer and John Cary. But each of these maps was particular to the demands of its patrons. Many of the maps were symbols of influence, coverage was patchy, and there was no agreement over what was included or ignored. Nor was there any standardisation of scale or symbols (though a church was denoted by a spire, and one horizontal bar signified a parish church, two an abbey, three an archbishopric).
The shift to national mapping was driven by one principal concern: military defence. In Scotland, the Jacobite Uprising of 1745 alerted troops loyal to the British government of the need for accurate mapping of Highland terrain far beyond the previous concentration on castles and other fortresses. And thus, under the leadership of a lieutenant-colonel named David Watson, General William Roy began a new survey of Scotland from 1747 to 1755, creating maps on a scale of 1000 yards to an inch, something he later considered ‘a magnificent military sketch [rather] than a very accurate map of a country.’ Much of it, indeed, was conducted from observations on horseback, and although there had been considerable improvements in measuring instruments (not least telescopes and theodolites made in England and Germany), it was still far from the rigorous mapping that Roy would advocate in the years to come.
His inspiration for such systematised mapping came from France. Beginning in 1733, the great national French survey took twelve years to produce a set of maps which, if not the most decorative to have emerged from Europe in this period (Prussia under Frederick the Great may stake a claim to that), was an exemplar that would soon have an impact as far away as India and America. The cost (labour, administration and printing) was almost certainly the greatest ever for a national mapping project, but its value exceeded it.
The 182-sheet Carte de France (78 sheets of which would sell at Roy’s auction) was first published in 1745. It was the work of the Cassini family, backed by Louis XV, and majestic in scale. The maps could be pasted together to form a collage with a width and length of some 11.5 metres (they were also available as a bound atlas). The survey played an important role in establishing a fiscal framework for the new French state, and – improved by four generations of Cassinis up until 1815 – provided something of a topographic constitution during the country’s endless European wars. It would be easy now to regard such a thing as an obvious step in a nation’s cartographic progress, but at the time it was a geographic miracle. As the American cartographic historian Matthew Edney puts it, ‘Such high-quality surveys were the period’s equivalent of atomic science.’
The first of the great map surveys – the Cassini family’s Carte de France, created between 1733 and 1815.
Certainly, the Ordnance Survey owes its French relative an immeasurable debt. The Carte de France was based upon an enhanced system of triangulation, the system of calculation that determines distance by establishing two angles measured from a fixed baseline. The method was popularised in the sixteenth century by the Dutch cartographer Gemma Frisius, although it is a theory that would not have been unfamiliar to Pythagoras.
The British Ordnance Survey would rely on triangulation for all its work until GPS took over almost two hundred years later. William Roy first championed it in 1763, when, in his role as Deputy Quartermaster-General, he proposed a triangulation of the whole country at one inch to the mile. He made a similar proposal two years later when he became an inspector of coasts for the Board of Ordnance, a branch of the military based at the Tower of London that was concerned with armament supply and other logistics (including maps) to the army and navy. Roy argued for more detailed maps to protect the south coast, although he also wrote about how such a plan could be extended with a meridian line ‘thro’ the whole extent of the island, marked by Obelisks … like that thro’ France.’ His plans were dismissed on the grounds of time, labour and cost.
Roy finally got his chance, however, in 1784, when he was commissioned by George III and the Royal Society to conduct a triangulation to link the observatories in Greenwich and Paris (the initial impetus came from the Cassini family). It took three years to cross the Channel from Dover, the project delayed by what appears to have been the procrastination of the chief London instrument maker Jesse Ramsden. It was Ramsden’s three-foot-high ‘Great Theodolite’ that was key to the accuracy of the work, but according to the historian R.A. Skelton, Roy became so irritated by Ramsden’s deliberating over measurements that he damned him in his official report – expletives that were removed before printing.
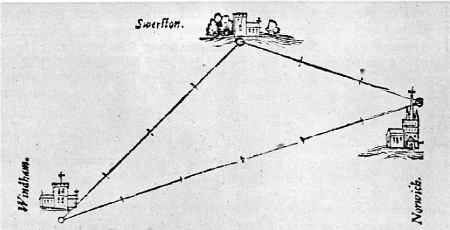
An early illustration of triangulation from the 1550s
Notwithstanding, the work was deemed a success, and a triumph for triangulation. Roy had again written of his ambitions for a national survey in two reports for the Royal Society, the last composed a few weeks before he died in 1790. Around this time he also wrote to one of his principal supporters, the Duke of Richmond, the Master General of the Ordnance, and it was the Duke who commissioned what we now recognise as the Ordnance Survey the following year.
The fact that French troops were gathering strength in Europe certainly helped his case for surveying the coasts. But in Roy’s words, the plan was to use ‘the great triangles’ to survey not only vulnerable areas or ‘Forests, Woods, Heaths, Commons or Marshes,’ but also ‘in the enclosed parts … all the Hedges, and other Boundaries of Fields’. Roy believed that this could not be achieved on a scale of less than two inches to a mile, although they could be reduced when printed to one inch to a mile ‘for the Island In general.’
The first part of the island to be measured was the base at Hounslow Heath that General Roy had used for the Anglo-French work (a location near what was to become Heathrow Airport). This then extended to Surrey, West Sussex, Hampshire, the Isle of Wight and Kent. As with so many great ideas, it would be fair to assume that all who pored over it in the weeks and months that followed must have wondered why no one had thought of making such a thing before.
j
The Ordnance Survey arrived in Ireland in the autumn of 1824, and immediately ran into a problem: impenetrable fog. In England, mists that were present at dawn were usually gone by mid-morning, but this was not the case in Donegal, Mayo and Derry. The Irish survey began as a systematic attempt to reform the Irish taxation system by measuring the boundaries of some 60,000 rural ‘townlands’, but it soon developed into a scheme that mapped the country from north to south at six inches to the mile. An astonishing amount of men were employed in this exercise – more than two thousand at its peak in the 1830s – but there was one man who made their employment feasible, their output prodigious and their visibility possible, and like William Roy he was a Scot.
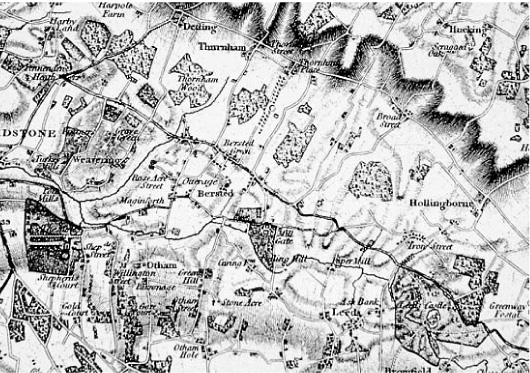
One of the original Ordnance Survey maps – Kent, mapped at one inch to the mile, published in 1801
Thomas Drummond was born in Edinburgh and attended the university, but his formative education took place at the Royal Military Academy at Woolwich. He was proficient at mathematics and engineering, and Thomas Colby, director of the Ordnance Survey, enlisted him as a lieutenant on the mapping of the English countryside, and a few years later as his deputy in Ireland. Drummond was a practical man, and from his base in Dublin he began improving the technology of mapping at a rate that brought him to the attention of the Royal Society, who asked him to demonstrate his inventions before Michael Faraday, an event that Drummond recalled as the proudest of his life.
Much of the minutely detailed Irish survey was conducted with chains, but the goal of a ‘full face portrait of the land’ required a full arsenal of new sights. Drummond had made small improvements to the barometer, the photometer and an optical device known as the aethroscope, but it was his portable enhancement of the heliostat that garnered particular attention, a mirror that deflected the sun’s rays towards a particular distant target. But what could be done after sunset, or on those frequent days when there was sleet, haze, smog and murk? Drummond found that the solution to the pea-souper was the ‘pea-light’, a small pellet of lime (calcium oxide) that, when burned with an oxy-hydrogen flame, produced a light hugely more powerful than either a burning torch, the popular Argand oil lamp or nascent gaslight. The intensity greatly increased the distance possible between trig points; in bad light or snow a signal could now be seen up to a hundred miles away.
And in this way did ‘limelight’ enter the vocabulary. It wasn’t Drummond’s invention (the first oxy-hydrogen blowtorch was developed by the Cornish scientist Goldsworthy Gurney a few years before), but he gave it its first great application and, in harnessing its use in lanterns, significantly refined its safety and glow-time. When the ‘Drummond Light’ was used with the ‘Drummond Baseline’ (a measuring technique involving metal bars), a highly accurate survey of the whole of Ireland was carried out in just twenty-one years. Many decades later, when they re-measured the baseline which had been set up in the 1820s, they found that it was accurate to within one inch in eight miles.
And across the Irish Sea, London’s theatre goers also had cause to be grateful to Drummond. The first use of limelight onstage is believed to have been at the Theatre Royal, Covent Garden, in 1837, for the musical farce Peeping Tom of Coventry, when limelight complemented gaslight and was used primarily to focus on the star performer or a dramatic epiphany. Dan Leno, Marie Lloyd and Little Titch all flourished in the limelight, and the fading of the light at the turn of the century – when electricity took over – ran parallel with the slow demise of the music hall.
j
Great British colonial surveys extended far beyond Ireland. In fact, the greatest of them all extended to the highest point on earth. At the beginning of 1856, the tallest mountain in the world was known as many things, including Deodhunga, Bhairavathan, Chomolungma and Peak XV. At the end of 1856 it was known as Mount Everest.
It was a strange choice of name. George Everest, by all accounts a domineering and ruthlessly exacting man, was the Surveyor General of India from 1830 to 1843. Yet he had almost certainly never seen the mountain, and he suggested that the locals would have trouble pronouncing it (as do we: he called himself Eev-rest rather than Ever-rest). But the imperial British were doing what they did rather well in the middle of the nineteenth century – putting their names on places on the map over which they had no dominion. Despite local objections, the name stuck, a small but telling by-product of the arrival in India of the new science of surveying from the mother country.
The Great Trigonometrical Survey of India – conceived in 1799, commenced in 1802, but only officially titled in 1818 – was a close cousin of the Ordnance Survey, and was almost as transformative as its British counterpart. It marked the switch from broad Indian route mapping (the descriptive, landmark-based type useful for a traveller or trader) to the strict mathematical technique based on triangulation (the sort better suited to military planning, establishing a standard cartographical grid over which other maps could be matched or compared). It consolidated British dominance wherever a theodolite and trig point was placed, and the East India Company, the survey’s initial sponsor, took full advantage in claiming new territory under the guise of scientific progress. The survey relied on the importation of heavy British measuring equipment for its success, and on British-trained surveyors (William Lambton, the Great Survey’s first superintendent, was directly inspired by William Roy, while George Everest, who succeeded Lambton in the post, spent time with the Ordnance Survey in Ireland). The whole project, which lasted some sixty years, may also be considered particularly British in another sense, a ripping yarn worthy of a Pythonesque parody in which surveyors were ravaged by heatstroke, malaria and tigers as they struggled to cartographically tame the extremes of climate and jungle.
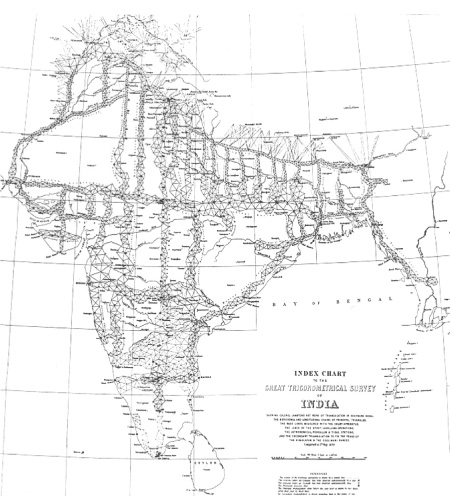
Imperial ambition – the Great Trigonometrical Survey of India
Beyond politically advantageous mapping, the Great Survey also achieved a genuinely scientific geographic breakthrough, establishing, at more than 1600 miles, the longest measurement of the earth’s surface. Before we could view it from space, this Great Meridional Arc, running south-to-north from the southernmost tip of Cape Comorin (now known as Kanyakumari) in Tamil Nadu province to the Himalayas and the edge of Nepal, provided the greatest glimpse of our planet’s curvature (an ambition first realised by Eratosthenes and his gnomon). The Arc produced the skeleton that followed – a great chain of maps stretching east and west from its central backbone.
By contrast, the measurement of Everest was a moment of supreme cartographic hubris, as much to do with imperialist boasting as with mapping (for those concerned with triangulation it was the biggest triangle of all).* Its precise height was calculated by the brilliant Bengali mathematician Radhanath Sikdar as 29,000 feet, but it was announced at 29,002 feet lest it be considered a rough estimate (the height was the mean figure reached after computing the results of six separate survey stations, measured from between 108 and 118 miles from Everest’s summit). Its exact measurement was a matter of great pride for Colonel Andrew Waugh, the man who succeeded George Everest as Surveyor General (and named it after him). And its accuracy should now be regarded as a source of some pride for nineteenth-century mapping. Although the precise height of the mountain varies over time according to shifting tectonic plates and variations in snow covering (and debates over whether one should measure the snow cap at all), the widely accepted 21st century figure of 29,029 ft (8,848m) is an increase considered to be neither here nor there, even by those trying to reach its summit.
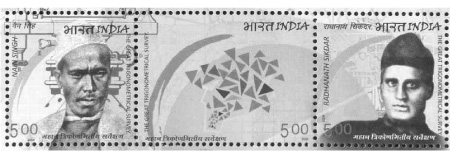
Indian stamps commemorating two heroes of the Great Survey – Nain Singh and Radhanath Sikdar. Singh explored the Himalayas and mapped much of Tibet, while Sikdar calculated the height of Peak XV (later renamed Mount Everest), and determined that it was the highest mountain in the world.
Back where it began, the Ordnance Survey was itself rapidly becoming a part of the British landscape. By the First World War its symbols were as recognisable as roadsigns, the maps sold in their millions, a new edition on a new scale was a significant event, and concertinas of sheets nestled close to gloves, scarves and flasks in every carriage, reading room and boot-room. A new written and visual language had evolved around them, alongside an almost universally accepted set of rules as to how we should map a rapidly changing territory. The maps were gently modifying the British sense of place, and defining a culture far beyond the space they miniaturised.
And once you had the mapping itch, you had to keep scratching it. Maps didn’t sit still and stay happy – you had to amend, bend, excise and redraw according to such inconvenient things as population explosions and demolition. Oddly for a country whose national borders rarely underwent the mayhem of war that beset others in mainland Europe, Britain seemed to possess an innate need to map. Not merely for practical and professional purposes, but because it seemed like a birth-right.
For the Ordnance Survey, this meant a continual stream of revisions and new maps on a variety of scales. The job was never done, and would never be done. No sooner had an OS surveyor put their feet up to toast the completion of a new series, than the work would already be out of date. It was a wonder how they kept their sanity, for surely mapping was a terrible job: each year the ‘silences’ on maps – those spaces where there was nothing to see or report – became rarer.
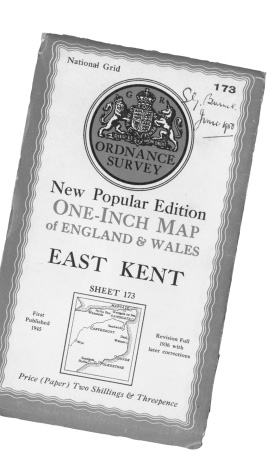
Although our choice of OS map scales has now shrunk, there once was a series for every use, pocket and location. There was the 1:2376 scale in the West Riding of Yorkshire of 1842, the 1:1250 scale first seen in Shoeburyness, Essex, in 1859, the 1:126,720 that became popular in the early 1900s, and the 1:10,560 ‘regular edition’ town maps with the 1:100,000 county maps, both from the 1960s. But now things have largely settled down, so that we have the National Grid Series, (marketed as the Explorer or ‘Orange’ series at 1:25,000, or 2½ inches to a mile); and the Landranger or ‘Pink’ series at 1:50,000 or 1¼ inches to a mile.
j
You can work your way through a clump of OS maps today and be struck how they construct, map by map, a matchless social history of a vanishing country. They log not just industrial and technological progress, but domestic sanitation, trends in travel and architecture, leisure habits and linguistic quirks. And they do this without knowing, an imperceptible march of years, like the thinning of hair.
OS maps – indeed, all serious maps – are governed by rules of inclusion and exclusion, and by a highly commendable British rulebook that raised the bar for crabby and incontestable officiousness. The rules are numerous, varied and rigid, the result of both field practice and endless minuted committees at its headquarters in Southampton. In the 1990s, the cartographic historian Richard Oliver began compiling a list of regulations gathered from two centuries of internal style manuals to its surveyors, most of them previously unpublished, as to how OS should record what it observed. They are necessary, joyless, mundane and utterly compelling. (These paraphrased examples are drawn from the so-called Red Book of 1963, but they have modern equivalents, not so very different.)
Allotments: Permanent ones are shown, but minor detail such as sheds are not.
Bracken: Should be mapped as distinct vegetation category.
Playgrounds: Gymnastic apparatus in public grounds was authorised to be shown on 1:2500 mapping in 1894. But play apparatus, e.g. swings and roundabouts, is not shown.
Outhouses (Lavatories): Are shown if permanent, and if large enough to show without exaggeration. (Instructions to Draughtsmen and Plan Examiners, 1906)
Taps: Taps on public drinking fountains will be shown.
Churches: Subject to the approval of the church authorities, it is customary to publish ‘St John’s Church’ when it means ‘St John the Evangelist’, but it is also customary to keep ‘St John the Baptist’s Church’ in full.
Trees: Are quite important but not crucial. In avenues or rows trees will be shown except where the symbol would obscure more important detail.
Heath: Is nowadays defined as when the vegetation is ‘heather or bilberry’.
Letter Boxes: Are mapped, except when built into post offices.
Public Houses: Are licensed to sell intoxicants; they do not have overnight accommodation for travellers. (If they do, they are inns.)
Legal Value of OS Mapping: Indisputable. Two court judgements in 1939 and 1957 ruled that anything appearing on an OS map is prima facie evidence of its existence on the ground; if it’s on the map, it’s in the world.
And then there were the space-saving, often perplexing abbreviations, used on OS maps and hardly anywhere else. San was Sanitorium, SM was Sloping Masonry, St was Stone, ST was Spring Tides, St was Stable and Sta was Station. W could mean Walk, Wall, Water, Watershed, Way, Weir, Well, West, Wharf or Wood. Best of luck with that.
j
But that’s all in the past. Aren’t paper maps finished for all but the incurably nostalgic? OS perceived the dawn of digital cartography in the early-1970s, when it began transferring its data to magnetic tape and looking forward to a time when a hiker could send a postal order for a map tailor-made to their next fortnight in the foggy Dales. Too bad they didn’t foresee the £50 GPS handheld, nor the map-less clowns who yomp up Ben Nevis at teatime with a fading single bar on their iPhones.
But what if paper maps have a future? What if we’ve seen the small-screen limitations of GPS and are requiring the broader picture once again? Are we nostalgic for Britain on a scale of 1 to 25,000? What if young people were to put down their devices for a minute and feel the need to get muddy and soggy again with just a compass and a plastic map sheath around their necks? Is it possible, as OS would like to believe, that we may one day return to the fold? And if so, where would we go to learn about using these things?
The Ordnance Survey, more than two centuries old, runs map-reading classes in indoor environments, predominantly in outdoor sports and camping shops. But in May 2011 one of these occurred at grid reference SP313271 – Jaffe & Neale’s Bookshop and Café in Chipping Norton, Oxfordshire.
We were given plastic compasses tied to large boards with maps on them to place on our knees. OS staff Richard Ward and Simon Rose announced that usually the session consists of them doing all the talking, but they had just that week taken possession of a set of instructional videos featuring the television naturalist Simon King, and so we sat around watching those until it was time to find our way for ourselves. It was all propaganda, of course, but of the gentle sort, the sort that made you want to get out of the bookshop and start walking. King said that he enjoyed the way that his phone made things easier, ‘but nothing replaces a paper map. Only by spreading a sheet out and looking at how the different features on the ground relate to each other can you get a clear idea of the landscape … I just love them!’
In 2007 a car insurance survey found fifteen million UK drivers couldn’t identify basic OS roadmap symbols. These were the test questions. The answers are: [1] mud, [2] motorway, [3] bus or coach station, [4] nature reserve, [5] toilets, [6] train station, [7] place of worship, [8] picnic site, [9] place of worship with spire, [10] campsite. Women scored slightly higher than men, but overall 55% couldn’t recognise a toilet, 83% a motorway, and an impressive 91% would be likely to get stuck in the mud.
He introduced the two main series, the Explorer and the Landranger, and in the next film he talked about grid references, and the one after that it was contours (where the contour lines are close together the area will be steep, but further apart they’ll be more level). And then it was compass bearings and finding grid north as opposed to magnetic north (magnetic north is constantly shifting depending on where you are in the world and the strength of magnetic force; we had to shift the compass housing a few degrees anti-clockwise to orientate the map correctly). After each clip we had exercises. We had to locate symbols on a map and say what they meant: a pub and (one of those OS words that hasn’t been used since 1791) a bunkhouse.
Like all paper empires facing ruin by satellite, the Ordnance Survey is doing what it can to keep up with the digital present. Its first maps were produced digitally in 1972, and four years later its Director General, B. St G. Irwin, a man whose very name suggests OS symbols, told a meeting of the Royal Geographical Society that one in every six of its large-scale maps was produced with the aid of computer coding. Irwin estimated that it would be ‘towards the end of the twenty-first century’ before this progress resulted in the complete digitisation of the OS database.
This has, of course, happened more quickly than planned. OS now offers a print-at-home subscription service, wherein users can select map coordinates of their choosing, plot a personal route for a nice day out, and then print it out or download it to their mobile phone. Its website offers an impressive range of handheld GPS devices and a guide to geocaching (a GPS-based treasure hunt), as well as socks, hydration packs, insect repellent and blister packs. There is also a range of free large-scale maps to download, largely as a result of pressure from OpenStreetMap, the organisation that has argued that UK taxpayers are otherwise effectively paying for the OS twice.
Towards the end of the session in the Cotswold bookshop there was a final video to watch – what to include in your rucksack. A head-torch is useful, perhaps lip salve, and don’t forget some warmer clothing lest the weather turns against you. ‘And, most important, your map. Never be without your map and your compass. Not only does it show you where you are, but you get so much more out of the walking experience.’ When it was over, and Simon King told us to honour the country code and ‘leave only footprints, take only memories,’ one of the workshop leaders said, ‘Now you’re ready to find your way!’ as if it was an evangelical awakening. Most of us then bought maps, paper maps, and promised ourselves we’d open them very soon.
Mary Ashford is not yet a major part of cartographic history, but perhaps she should be, poor thing. At 8am on Tuesday 27 May 1817 her body was found in a watery pit in a field in Erdington, on the outskirts of Birmingham. She may have fallen in, or she may have been murdered, and the mystery of how this twenty-year-old woman failed to return home after a local dance became one of those great and terrible stories that enthralled the public and filled the papers for months. The trial brought about a change in English law; the scandal brought about what was probably the world’s first commercially produced forensic murder map.
Ashford had attended the annual dance at a public house with a girlfriend, and attracted the attention of a man called Abraham Thornton, who had previously boasted of his reputation as a lothario. The two danced together, and afterwards walked back over open fields. Ashford was last seen alive at 4am; at 6.30am a local mill worker discovered her blood-spotted shoes and bonnet.
Thornton was immediately charged with her murder. At the trial ten weeks later two maps were used to describe what may have happened that night, one drawn up for the prosecution by local surveyor William Fowler, and one drawn for the defence by the Birmingham surveyor Henry Jacobs. Each side drew arrows on their maps to instruct the jury on Ashford’s and Thornton’s possible movements after the dance, and once-insignificant places such as Penn’s Mill Lane and Clover Field became known on breakfast tables throughout the country. Thornton had an alibi and a good counsel, and the jury took only six minutes to acquit him.
It was an unpopular verdict. Mary Ashford’s brother William, incensed by the outcome but cheered by the strength of public opinion against Thornton, managed to arrange a retrial at the King’s Bench in Westminster the following November, and the news pleased not only the newspapers but pamphleteers and cartographers too. There was money to be made. The most successful map, in several editions, was made by a local teacher who inspired his pupils and his colleague George Morecroft to rise at dawn to construct a survey of the crime scene and surrounding area. The teacher, by the name of R. Hill, explained that he had not been impressed with the ‘rude plan’ produced in the Midland Chronicle that was ‘apparently done without measurement … a very imperfect representation.’ Hill, a keen geographer, had previously sketched new maps of Spain and Portugal for his school, though no examples survive. He had also read a popular account of the birth of the Ordnance Survey by its director, Major-General William Mudge, and, ‘finding it more interesting than any novel’, taught himself trigonometry and other modern surveying techniques.
His map, a wood engraving printed in Birmingham, measures 38 × 48.5cm. Hill cast his boundaries wider than the maps in the newspapers ‘so far as to include the place of the alleged alibi,’ and added a cross-sectional drawing and an engraving of the pit where Mary Ashford’s body was found (shown for what it really was, a rather bucolic tree-lined pond). The main map is augmented by helpful directions: ‘The road which Thornton says he took after leaving Mary’; ‘Supposed track of the Murderer.’ And then there is a bit of topographical sensationalism. In an inset of the fields where the murder was alleged to have occurred, Clover Field is renamed Fatal Field.
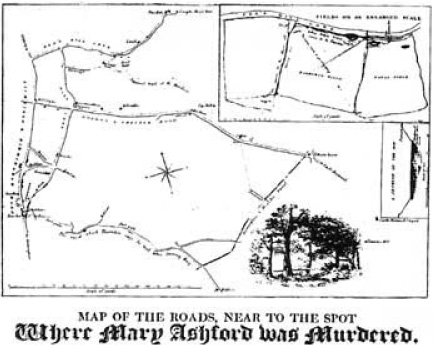
The fateful last journey of Mary Ashford in a map by the mysterious ‘R Hill’.
The map was accompanied by detailed explanatory text and a juicy title in a combination of plain and ornate Old English type: ‘Map of the roads, near to the spot where Mary Ashford was murdered’. The text provided a basic outline of the case and the disputed claims of Abraham Thornton’s route after accompanying Mary Ashford from the dance, composed in the peculiarly unemotional style of a policeman’s evidence (‘It may perhaps assist the inspector of the map to be reminded of some of the particulars …’; ‘the height of the water as here presented, is as near as possible [to] what it was when the Murder took place.’) Hill’s map was a great success, earning him and his class £15 profit despite widespread plagiarism.
No map, however, could hope to capture the courtroom drama to come. Thornton not only continued to plead his innocence, but invoked the archaic statute of trial by combat – challenging William Ashford to a duel by putting on a gauntlet and throwing another down by Ashford’s feet. Ashford declined to pick it up. Thornton was then tried for a third time the following April (no one could really get enough of this case), when he was again acquitted, the judge declaring that he could indeed induce his ‘wager of battle’ as a valid defence, although a new statute would soon abolish it.
Thornton then fled to America, where he is believed to have died in his late-sixties. The lengthy inscription on Mary Ashford’s gravestone in a Sutton Coldfield churchyard makes sober and moralistic reading, describing her terrible fate ‘having incautiously repaired to a scene of amusement without proper protection.’
And what became of our principal map-maker? He did all right for himself. He left teaching and the Midlands for the civil service and a house in Hampstead, northwest London; he was promoted to the Treasury; and in 1840, twenty-three years after the murder of Mary Ashford, he transformed the world’s postal system with the Universal Penny Post and the Penny Black stamp. The murder map is the only evidence we have of Sir Rowland Hill’s cartographic career.