Chapter 12
Using Real-Options Analysis to Evaluate a Project
This chapter explains how to use a technique called real-options analysis to evaluate a proposed project.1 The development of natural resource projects, which often involves a series of stages, is an important application. The technique is useful for any project that involves distinct stages of information gathering and making decisions whether to continue the project or abandon it. At each stage of a natural resource project, the sponsors gain valuable additional information, which enables them to decide whether to proceed to the next stage. They can continue development of the concession (if the information is favorable) or abandon the project (if the information is unfavorable). Traditional net present value (NPV) analysis cannot capture the value of these real options because NPV analysis involves only a single decision point and considers only the expected project cash flow. Contingent-claims analysis is more flexible. It allows for the multiple decision points and takes into account the new information at each stage to update the value of the project contingent on the new information.
The technique is called real-options analysis because it deals with investments in real (tangible) assets where the sponsors have multiple options (decisions) to continue or abandon.2 The chapter illustrates this technique with a practical example, the staged development of an oil field concession in the North Sea. The example also shows how to use the prices of crude oil futures contracts to value the future oil production (contingent on the drilling results) from the field. The technique is easily adapted to any other type of project in which there are multiple stages.
Description of the Oil Field Project
The oil field project consists of an exploration block located offshore on the Dutch continental shelf. Surrounding blocks have supported several oil fields that are producing large quantities of oil. Geologists have a pretty good understanding of the potential for reserves in the area because of extensive mapping and past exploratory drilling. Drilling and production are expensive because of the deep water and the harsh winters. Because of the corrosive effects of salt water, it is not practical to curtail production temporarily. Once a field is developed, production is continuous until the field is abandoned.
If the field is put into production, the project will have to pay all the operating costs and recover the capital costs out of the field's net revenue. The host government often takes between 50 and 80 percent of the production revenues through a variety of devices. The sponsors have to pay royalties equal to a specified percentage of revenues, the state-owned oil company will take an ownership participation in the field (and will pay its pro rata share of the cost of the infrastructure), the state will receive a carried interest (taking a percentage of the operating profit but not paying any of the capital cost), and the project will have to pay income tax on its profits.
In the example, the oil field will have a useful productive life of 25 years from the date production starts. It will take about five years to perform the geological work, test drilling, and appraisal drilling. The preliminary reserve assessment phase will take one year, and test drilling and appraisal drilling will each take two years. The productive life of the field will depend on the amount of reserves proven up. Preliminary reserve assessment will cost $5 million, and each test well and each appraisal well will cost $15 million. The sponsors will have to pay capital costs of $150 million if the reserves are small and $175 million if the reserves are large to drill the production wells and build the infrastructure needed to support production. They will have to pay $25 million after taxes at the end of the project to dismantle the production facilities and restore the environment. The sponsors also will have to pay a 10 percent royalty, the state-owned oil company will take a 50 percent ownership participation in the field, and the state will receive a 20 percent carried interest. The income tax rate is 35 percent.
Project's Real Options
The oil field project has four stages that occur in this sequence: (1) geological study phase, (2) exploration phase, (3) appraisal phase, and (4) production phase. In the first phase, the sponsors conduct geological and geophysical studies, such as soil testing, to determine whether significant petroleum reserves might be present in the block and to assess where they might be located within the block. If the results justify test drilling, they will obtain an exploration license. If the results obtained from the test drilling indicate that there might be commercial quantities of hydrocarbon reserves within the concession, the sponsors must decide whether to perform appraisal drilling. Such drilling will enable them to assess the amount of reserves and determine whether they are sufficient and in a location that justifies commercial development. Once again, the sponsors use the information from the drilling to decide whether to continue developing the concession. The appraisal drilling should substantially reduce the uncertainty about the quantity (or lack) of reserves. If commercial quantities are indicated, the sponsors will request a production license to bring the field into production. They will determine the production profile for the field's useful life, drill production wells, and build storage, transportation, and loading facilities. The sponsors must decide how much to invest based on the estimated quantity of reserves and also on their beliefs concerning future oil prices.
Project Call Options
An undeveloped oil field can be viewed as a call option. A call option is an instrument that gives its holder the right, without the obligation, to buy a specified asset at a stated exercise price within a stated time interval. In this case, the underlying asset is the value of a producing oil field. The exercise price is the present value of the capital investment in the wells and production facilities. The stated time interval is the elapsed time until the decision whether to put the field into production is taken. In evaluating the project, it is more efficient to treat the option as a sequence of three options that correspond to the decisions to start test drilling, to start appraisal drilling, and to start production.
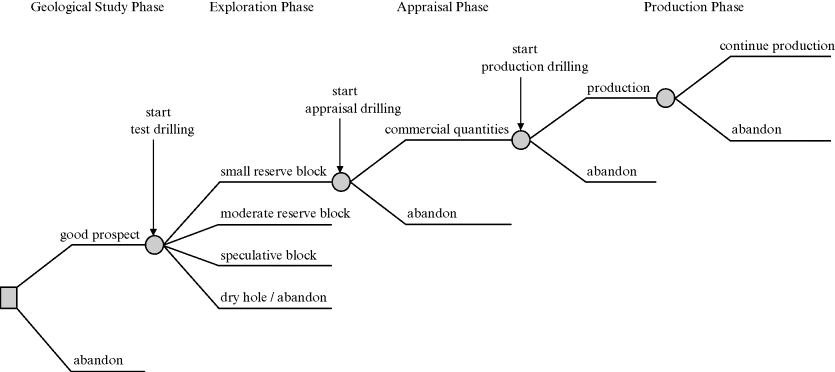
Three of the four stages in the field's development can be analyzed as call options. These stages are illustrated in Figure 12.1. In addition, there is a fourth option, which is embedded within the value of the oil field. Management has the option to abandon the project anytime during the production phase. The four options are:3
Sources of Uncertainty
The project sponsors face two major sources of economic uncertainty: the quantity of reserves and the future price of oil. Test drilling and appraisal drilling reduce (but do not eliminate) the reserve uncertainty. Price uncertainty is also very important because the sponsors will not be able to commercially exploit the field if the prices they expect to receive for the field's production are too low. The availability of crude oil futures enables the sponsors to assess their oil price risk and also to hedge this risk by selling crude oil forward contracts and futures contracts. Chapter 14 discusses how project sponsors can use derivative instruments, such as forward and futures contracts, to hedge (i.e., reduce or even eliminate the impact of) price risk.
As the largest capital expenditures occur in the development phase, it is the phase in which the project's option value is most important. The oil field example illustrates how uncertainty about the quantity of reserves and about the future course of oil prices are explicitly modeled to calculate the project's value. The oil field is valued for different oil price volatilities to highlight how oil price uncertainty drives the project's option value.
Evaluating the Project
Figure 12.1 suggests this analytical approach: Start with the production phase and work backward first, to the production decision, next to the appraisal drilling decision, next to the test drilling decision, and then to the preliminary reserve assessment decision. This approach uses the information from the preceding step in the analysis (and a later point in time) to determine the best decision. By working backward in time and always considering all possible subsequent (in time) possible events, the uncertainty concerning future events (in this case future oil prices and reserve amounts) is explicitly considered at each decision point.
Figure 12.1 The Four Stages in the Oil Field's Development
Evaluating the project involves seven steps:
Modeling Future Oil Prices
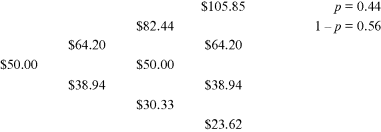
A binomial lattice can be constructed to indicate the possible movements of future oil prices through time. Figure 12.2 illustrates a three-period binomial lattice. There are a series of nodes spaced at regular intervals in a diagram that looks like the branches of a tree. The nodes at adjacent points in time are one year apart in the figure. The price of oil can follow one of only two possible paths from each node, either up or down. Allowing only two possible paths may seem unduly restrictive. Making the time step smaller increases the number of branches and improves the accuracy of the values calculated from the lattice. However, shortening the time step also increases the number of computations. In practice, a compromise is struck between accuracy and tractability.
Figure 12.2 Illustration of a Three-Period Binomial Lattice
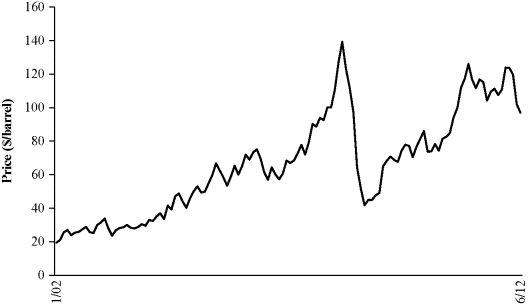
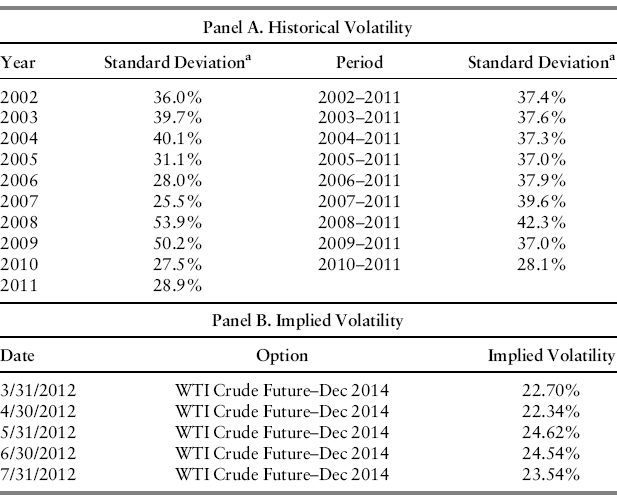
The volatility of the oil price determines how fast the branches in the binomial lattice spread out. Greater volatility results in greater dispersion of future oil prices. Figure 12.3 illustrates the volatility of the price of Brent crude oil between January 2002 and June 2012. The large fluctuations in price following the financial crisis and thus higher volatility are evident in the right-hand side of the figure. This volatility can be estimated from the implied volatility implicit in the prices of traded options on oil price futures. When options on futures are not available to model price uncertainty, then historical volatility can be calculated.4 Brent crude oil futures are used to model price uncertainty for the oil field project under consideration. Table 12.1 provides the implied volatility for traded options on oil price futures and the historical volatility for various periods for the sake of comparison.5 The following calculation assumes that the oil price volatility is σ = 0.25.6
Table 12.1 Volatility of the Price of Brent Crude Oil.
aStandard deviation of Brent crude oil returns is estimated using weekly data. The standard deviation is expressed as a rate per year.
Source: Bloomberg L.P.
The form of binomial lattice presented in this book assumes that the oil price follows a simplified multiplicative process in which the oil price moves up (u) or down (d) proportionately:7
The oil price next period is calculated by applying these proportions to this period's oil price (St):
The probability8 of an increase in the oil price (p) is
and the probability of a decrease in the oil price is 1 − p. The parameter r is the risk-free interest rate, and δ is the convenience yield of oil. Holding a physical inventory of oil instead of a futures contract has benefits and costs, which are measured by δ, which can be either positive or negative.
The convenience yield can be estimated from the prices of oil futures contracts that are currently trading in the futures market from the equation
where Ft is the current futures contract price, T − t is the time to maturity of the futures contract, and the other three variables are as defined previously. The following calculation assumes that the convenience yield is δ = .05.
Assume that the current price of Brent crude oil is S0 = $73.28 per barrel. Equations (12.1), (12.2) and ((12.3)) were used to develop a 30-year binomial lattice for the future price of Brent crude oil. The simple three-period binomial lattice in Figure 12.2 is constructed assuming S0 = $50, σ = 0.25, r = .05, and δ = .05. The $50 price is used to be conservative because of the recent periodic spikes in the world price of oil. With these values, u = 1.28, d = 0.78, and p = 0.44. One of the desirable features of the lattice determined by equations ((12.1)) to ((12.3)) is that the tree is said to be recombining. A move up followed by a move down leads to the same price two periods hence as a move down followed by a move up. The lattice is much more complex when the tree does not recombine.
Reserve Profile and the Quantity of Reserves
Geological mapping of the soil structure of the blocks and electronic soundings will suggest the possible existence of reserves. Further research, such as analyzing any available data from adjacent blocks and the surrounding area where reserves have been found, will provide further insight into the potential reserves in the block. This research will also enable geologists to identify the best places to drill test wells if the potential reserves are sufficient.
Drilling will suggest one or more expectation curves like the three shown in Figure 12.4. The three curves characterize three different degrees of uncertainty about the quantity of reserves. They correspond to three possible block types: (1) a relatively certain but small quantity of reserves, (2) a low likelihood of very large reserves but a high likelihood of no reserves (a speculative block), and (3) a moderate likelihood of reserves and low likelihood they are either very large or zero (the in-between case). Each curve shows the cumulative reserves that are possible according to the block type. The horizontal axis provides various reserves levels in increments of 25 million. The likelihood of finding more than 200 million barrels is considered remote regardless of the block type. The vertical axis gives the cumulative probability of finding reserves up to the indicated amount. For example, the moderate reserves case has a 57 percent probability of finding at least 50 million barrels of oil. The expected quantity of reserves is 58.5 million barrels for all three cases.
Figure 12.4 Three Oil Reserve Expectation Curvesa
aEach type of reserves has an expected value of 58.5 million barrels.
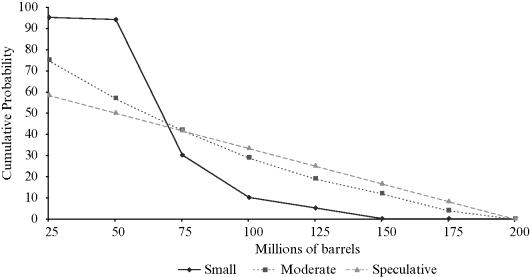
A small-reserves block has a very high probability of finding a small quantity of reserves. It might be found in an area where adjacent blocks have small proven reserves. The second block type is speculative. There is a 25 percent probability of finding at least 125 million barrels of oil, a 17 percent probability of finding at least 150 million barrels, and an 8 percent probability of finding at least 175 million barrels of oil. Such a block might be found in an area where past drilling results indicate occasional large strikes. The in-between case has a lower probability than the speculative case of finding a large quantity of reserves but also a lower probability than the small-reserves case of finding a small quantity of reserves. The small-reserves block would cost $150 million to develop, and the other two types of blocks would each cost $175 million.
The test wells will permit the sponsors to determine the block type, and the appraisal wells will enable them to assess the quantity of reserves within the block.
Present Value of the Field Ignoring Abandonment
By the time the production phase commences, the uncertainty regarding the amount of reserves has been quantified. The value of a production field depends on the quantity of reserves eventually proven. The sponsors will design a specific production plan based on the quantity of reserves proven up. This plan provides the annual production amounts over the productive life of the field, which is 25 years.
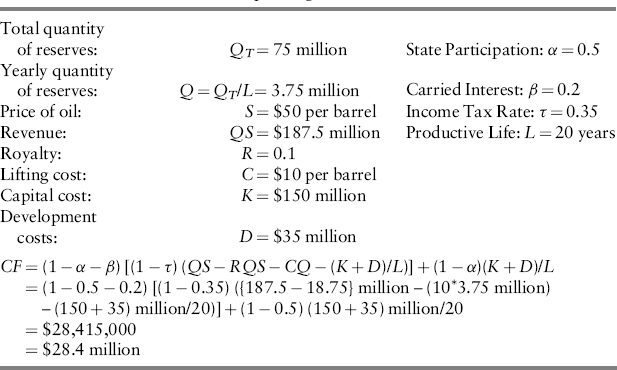
Given the quantity of reserves, the only remaining source of uncertainty is the oil price, which is assumed to follow the process specified in the binomial lattice. The oil price lattice is used together with the production plan to calculate the amount of operating cash flow at each node of the oil price lattice. The net operating cash flow (CF) equals the yearly production (Q) times the oil price (S) minus royalties at the government-mandated royalty rate (R), lifting costs at the estimated lifting cost per barrel (C), and depreciation (K + D)/L. This calculation gives the pretax profit, which is adjusted for income taxes (at the tax rate τ). The portion of the after-tax income the sponsors receive is adjusted for the state's participation (α) and the state's carried interest (β). The sponsors' share of the depreciation expense is added back to get their share of the project's net operating cash flow:
where K is the capital cost ($150 million or $175 million in the example), and D includes the other development costs ($35 million in the example), which are depreciated straight line over the productive life L in equation (12.5).9 The state pays its participation fraction α of this cost. Its carried interest β does not bear any of this cost. The annual depreciation amount (K + D)/L is divided between the sponsors and the state in the proportions (1 − α)(K + D)/L and α (K + D)/L in which they share the financing for the project. Cash flows are assumed to be realized at the end of each year. For example, Table 12.2 shows the calculation of the net operating cash flow at one of the nodes in the binomial lattice for the small-reserves case. The net operating cash flow is $28 million.
Table 12.2 Calculation of Net Operating Cash Flow at a Node.
The reserves in the field are valued by working backward through the oil price lattice one year at a time. Start at the terminal year (year 25 or year 30 depending on the reserve life) and work backward to t = 5, the beginning of the first year in the production period.10CF is calculated at each node. At each of the nodes in the terminal year, the value of the field (V) equals the present value (as of the beginning of the year) of the terminal year's net operating cash flow at the node:
Stepping back one year in time, the value of the field is equal to the sum of (a) the present value of the current year's net operating cash flow plus (b) the expected present value of the field one year later:
The net operating cash flow and the next year's possible values can be discounted at the risk-free rate because (1) all of the oil price uncertainty is captured by the dispersion of oil prices in the binomial lattice and (2) the uncertainty regarding the quantity of reserves is nonsystematic.11 Discounting at a risk-adjusted rate would double count for risk.
Taking into Account the Option to Abandon Early
Management is required to dismantle the drilling platform and production facilities and restore the environment at the end of the field's productive life at a cost A ($25 million in the example). The project sponsors have the option to cease production early if the remaining net operating cash flow becomes inadequate. This option is valuable because oil prices may decrease or production levels may drop making it unprofitable to continue production.
When the field is shut down following the end of the terminal year, the value of the field at that time, including the cost of abandonment  12 is
12 is
To take into account the option to abandon early, the project sponsors compare the value upon immediate abandonment (–A) and the value of waiting one year to reconsider their decision, and select the greater of the two values:
When the greater of the two values is –A, the net operating cash flow is too small (or negative) to justify postponing abandonment of the field. The field is shut down.
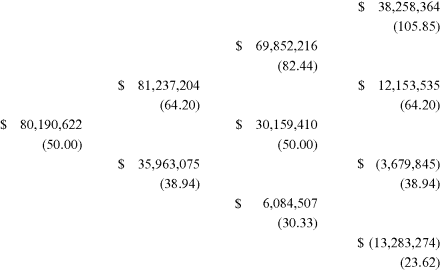
Equations (12.8) and ((12.9)) are used to work backward through the binomial lattice to calculate the value of the field contingent on the quantity of reserves proven up. Figure 12.5 shows a portion of the binomial lattice for the small-reserves case for which the quantity of reserves is Q = 75 million barrels. The basic assumptions are provided in Table 12.2. It illustrates how the option to abandon the project early is taken into account in working backward through the lattice. The last four nodes correspond to oil prices of $105.85 per barrel (implying a $38.3 million value for the field), $64.20 per barrel (implying a $12.2 million value), $38.94 per barrel (implying a −$3.7 million value), and $23.62 per barrel (implying a −$13.3 million value).
Figure 12.5 Calculating the Value of the Field Including the Option to Abandona
aThe price of oil is shown in parentheses below the indicated value of the field.
Value of the Option to Develop the Field
As noted, an undeveloped oil field can be viewed as a call option. The completed field (including the option to abandon) is the underlying asset, the value of the field is the price of the underlying asset, and the (present value) capital cost is the exercise price. The sponsors will exercise the option and begin development of the field only if it is profitable to incur the capital cost:
(12.10) 
where (1 − α) K is the fraction of the capital cost the sponsors invest. If V* > (1 − α) K, then the sponsors can profitably begin development and realize the option's intrinsic value (the value from immediate exercise), V* − (1 − α) K. However, if V* < (1 − α) K, then the project sponsors will not invest, and the net present value is zero. Because of the high capital cost, the project's option value is very important to consider.
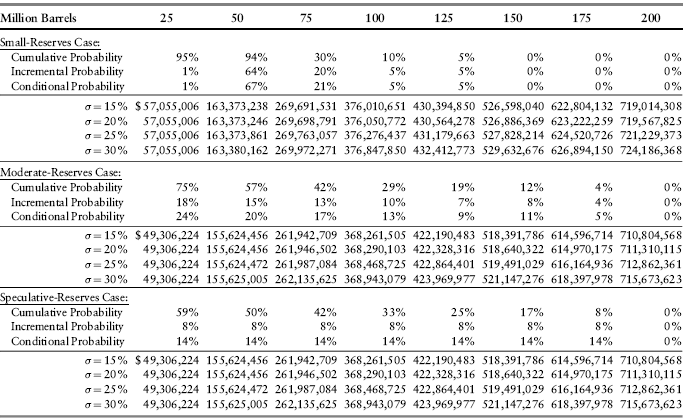
Table 12.3 shows the value of the development option for each block type contingent on the quantity of reserves. The value of the field is calculated at reserve amounts between 25 million and 200 million in increments of 25 million.
Table 12.3 Value of the Reserves Eventually Proven Up for Different Block Types and for Four Different Degrees of Oil Price Uncertainty (Millions of Dollars).
Timing Option
There is also a valuable timing option. In many situations, a project is unprofitable to begin immediately but the option to delay is sufficiently valuable that the overall project value is positive. In that case, the sponsors should postpone the project rather than reject it.
The project sponsors must decide when to exercise the timing option. In the example, even if it is not profitable to exercise the call option immediately, it might be profitable to exercise it in the future, depending on what happens to oil prices. The value of the project including the timing option (NPV (develop)*) is:
where the first term in parentheses is the option's intrinsic value and the second term is the value of delaying option exercise one year. If neither of these values is positive, then the project value is zero because the sponsors will abandon the project.
The binomial oil price lattice can be used to evaluate this option. For example, suppose the sponsors wish to consider delaying development as long as three years. Extend the binomial lattice for three additional years. Use the extended lattice by delaying the start (and the finish) of production alternatively by one, two, or three years. Calculate V* assuming the start of the project is delayed three years. Then work backward one year at a time by applying equation (12.11) to calculate NPV(develop)* as of the beginning of the original development period. The difference between NPV(develop)* and NPV(develop) measures the value of the timing option.
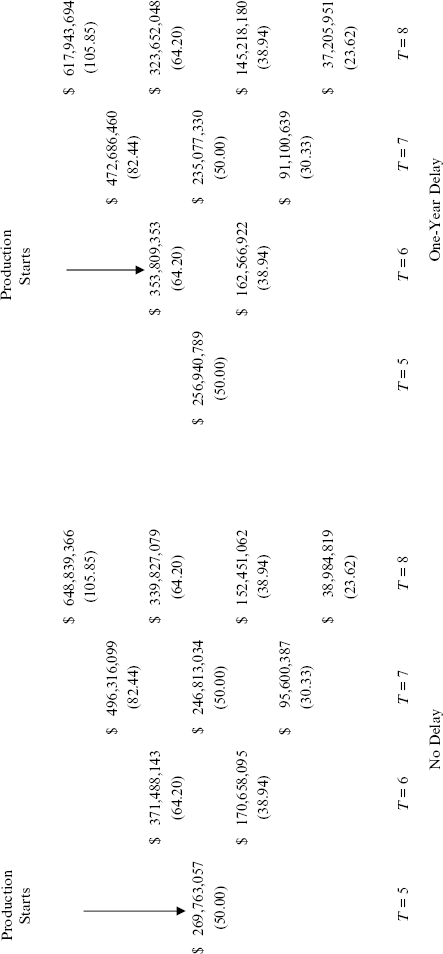
Figure 12.6 illustrates the calculation of the value of this option for a one-year delay in the small-reserves case. The figure shows a portion of the binomial lattice for the small-reserves case for which the quantity of reserves is Q = 75 million barrels and σ = 0.25. The basic assumptions are provided in Table 12.2. Delaying the start of the development of the field by one year reduces the present value of the field to $256.9 million from $269.8 million. These calculations indicate that there is no advantage in delaying the start of the oil field project. So the values in Table 12.3 are correct as reported. They do not have to be adjusted for the possibility of delaying the start of development.
Figure 12.6 Calculating the Value of a One-Year Delaya
aThe price of oil is shown below the indicated value in parentheses.
Value of the Option to Drill Appraisal Wells
The sponsors' assessment of the field's reserves is updated twice, first during the exploration phase and then again during the appraisal phase. The value of appraisal drilling is realized only after a strike. Figure 12.7 illustrates the process for calculating the value of the option to drill an appraisal well for each block type. Test drilling initially indicates whether there are any reserves, or results in a dry hole. Further test drilling indicates the type of block.
Figure 12.7 Decision Tree for the Oil Field Project
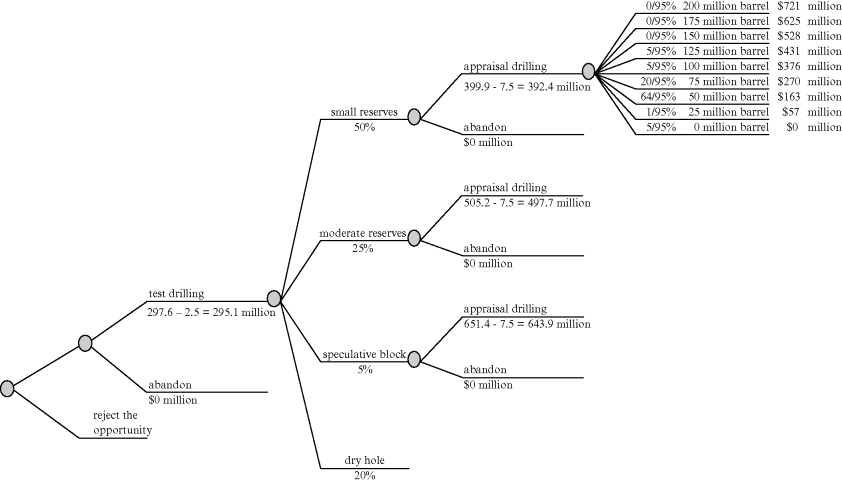
Consider the small-reserves block type. Start with the (development) values of the field in Table 12.3 for this block type. The expectations curve for the small-reserves–type block in Figure 12.4 provides the probabilities of different positive reserve levels. Suppose that test drilling has indicated the presence of hydrocarbon reserves. Drilling equipment can be leased usually at daily rates or specialized drilling contractors can be hired to perform the appraisal drilling. The appraisal drilling must be sufficiently promising that it justifies the $15 million cost of an appraisal well. Table 12.3 provides the possible values of the reserves. There is a separate calculation for each possible quantity of reserves.
Calculate the expected present value of the oil reserves by multiplying by the respective conditional probabilities and summing:
(12.12) 
where PV (appraise) is the expected present value of the field, NPV is the net present value of the field contingent on the block type and on finding Q reserves, and Prob(Q) is the probability that there are Q reserves contingent on striking oil. There is a T − t = 2-year time lag between the start of drilling the appraisal well and the start of development work on the field.
For example, Table 12.3 indicates that the estimated value of a 75-million-barrel reserve is $269.8 million when the oil price volatility is σ = 0.25. Figure 12.4 indicates that the probability of finding at least 75 million barrels of oil is 30 percent, and the probability of finding at least 100 million barrels of oil is 10 percent. Thus, the probability of finding 75 million barrels of oil is 20 percent. The probability of striking oil in this case is 95 percent, and so the conditional probability of finding 75 million barrels of oil is 21 percent (= .20/0.95). The expected value of finding this quantity of oil is $54.0 million. The present value of this amount is $54.0/(1.05)2 = $49.0 million. Summing over the possible values of the reserves indicates PV(appraise) = $399.9 million. The sponsors' share of the appraisal drilling costs is (1 − 0.5) K(appraise) = $7.5 million.
The net present value of the appraisal option is
(12.13) 
The sponsors would drill the appraisal well because NPV (appraise) > 0.
Figure 12.7 illustrates the calculation of the value of the appraisal option for each of the three block types. The intrinsic value of the appraisal option is $392.4 million in the small-reserves case, $497.7 million in the moderate-reserves case, and $643.9 million in the speculative-block case. The sponsors should exercise this option in each case.
Value of the Option to Drill Exploration Wells
The sponsors have to decide whether to drill a test well. That decision rests on the likelihood of finding hydrocarbon reserves and on the value of the reserves if oil is struck. Suppose that management estimates that at the end of the exploration phase, the likelihood of a small-reserves position is 50 percent, the likelihood of a moderate-reserves position is 25 percent, the likelihood of a speculative-reserves position is 5 percent, and the likelihood of a dry hole is 20 percent. Management can calculate NPV (appraise) for each block type by following the procedure outlined in the preceding section.
The expected present value of investing in an exploratory well equals the sum of the probabilities of a strike multiplied by the respective values of the field if oil is struck discounted back to the beginning of the exploration period:13
where Prob(type) is the probability of the block type, which determines which of the three expectations curves in Figure 12.4 describes the block. There is a T − t = 2-year lag between the start of exploration drilling and the start of appraisal drilling. The sponsors would have to pay (1 − α) of the exploration cost, (1 − α) K(explore) = $7.5 million, if they decide to proceed with test drilling. The net present value of the exploration option is
The sponsors would drill the exploration well because NPV(explore) > 0.
Net Present Value of the Project
The sponsors have to spend $5 million on geological work before they can determine whether to undertake exploratory drilling. The state-owned oil company will reimburse half this cost if the sponsors decide to pursue the project. The net present value of the project is14
(12.16) 
This calculation reflects the one year it will take to complete the geological phase of the project. The sponsors should undertake the geological work because NPV > 0. If NPV < 0, they would reject the opportunity presumably in favor of a more promising prospect.
Traditional DCF Analysis
To highlight the usefulness of real-options analysis, the real-options valuation of the proposed oil field project can be compared to a traditional discounted cash flow analysis. As noted, management estimates that the likelihood of a small-reserves position is 50 percent, the likelihood of a moderate-reserves position is 25 percent, the likelihood of a speculative-reserves position is 5 percent, and the likelihood of a dry hole is 20 percent. These probabilities can be used to calculate the overall NPV under the DCF approach.
Table 12.4 provides the development phase DCF NPV calculation for different values of oil price volatility for each reserve scenario. The base case is the σ = 0.25 oil price scenario. The NPVs are multiplied by the respective probabilities and discounted five periods at the assumed 5 percent discount rate:

Then the present value of the $2.5 million cost of geological work in year 1, the $7.5 million cost of test drilling in years 2 and 3, and the $7.5 million cost of appraisal drilling in years 4 and 5 must be calculated.15 The drilling costs are assumed to be spread evenly between the two years in each case. The present value of this investment is

This investment is subtracted from the expected development NPV of the proposed field to get the DCF NPV:

Table 12.4 Option Value of the Oil Field.
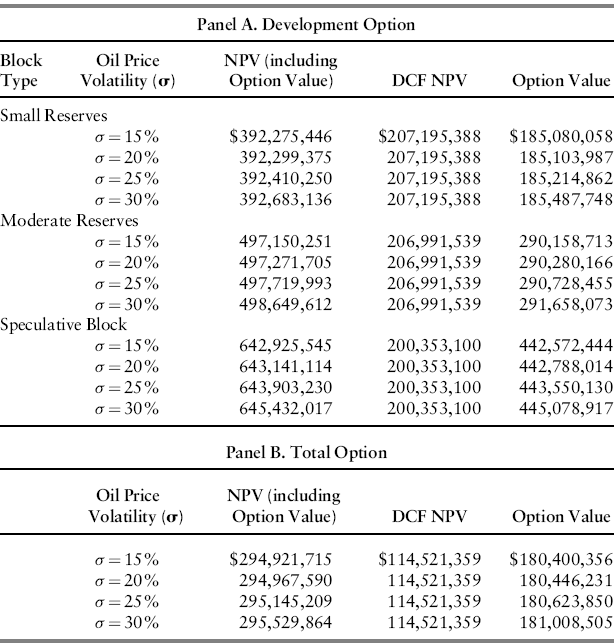
The difference between the NPV calculated using real-options analysis and the (lower) NPV calculated in the traditional manner reflects the value of the project's options. In Table 12.4, these real options are worth between $180.4 million and $181.0 million, which exceed the DCF NPV. The large value of these options clearly indicates the importance of taking them into account explicitly when evaluating a proposed project.
Sensitivity of Option Value to Oil Price Volatility and to Reserve Dispersion
The value of an option increases as the volatility of the price of the underlying asset increases. Likewise, the value of an oil field increases with oil price volatility because the value of each of the real options associated with the oil field increases with oil price volatility. Table 12.4 calculates the option value of the oil field for four different oil price volatilities. The higher the oil price volatility, the greater is the value of the development option and the greater also is the total option value.
Panel A shows that the value of the development option increases with the dispersion in oil prices and with the dispersion in reserve amounts. Each scenario has the same expected reserve amount. The dispersion in reserve amounts is greatest for the speculative block, and the value of the development option is likewise the highest. Dispersion is least for the small-reserves block, and the value of the development option is likewise the lowest. It appears that the dispersion in reserve amounts is a more important driver of option value than oil price volatility. However, both are important.
Conclusion
Real-options analysis is very useful in evaluating projects that consist of two or more discrete stages at the end of which the sponsors will decide whether to continue the project or abandon it. The development of natural resource projects, which often involve a series of stages, is an important application. This flexibility can be important because there are projects that appear to be negative-NPV projects on the basis of traditional DCF analysis, but actually turn out to be positive-NPV projects when all the real options are properly accounted for.
Real-options analysis highlights the importance of identifying all the potentially valuable options associated with a project. It also gives project sponsors the ability to value these options so that they can be factored into the evaluation of the project. The technique is useful for any project that involves distinct decision points. But it is especially useful for large projects where the sponsors would like to defer committing to spend large sums on final development until they are reasonably certain the investment is worthwhile.
