1.1 The Balance Sheet, Income and Cash Flow Statements
Financial statements provide essential accounting data extensively used in ratio analysis. We therefore start with a short summary highlighting the key features of the three financial statements, namely the balance sheet, the income statement and the cash flow statement.
1.1.1 "The Balance Sheet

Two conceptual presentations of a balance sheet
“Book value” is the valuation method used in most balance sheets. The net asset price is the historical cost of an asset minus its accumulated depreciation or amortization (i.e., net book value).
In many countries, an upward asset price adjustment is viewed as a taxable gain.
In a non-efficient financial market, a market value is not always fair and very often volatile (even unknown for most private non-listed companies). A book value, with all its drawbacks, is stable. The balance sheet can be aggregated as illustrated in Fig. 1.2.

Main building blocks of a balance sheet

Main balance sheet line items
Liability Versus Debt, Definition and Scope
In a broad sense, a debt is equivalent to a liability. It refers to an obligation toward a creditor, whether a supplier, a government, an employee or a financial institution.
A debt can also be strictly understood as a financial or interest-bearing obligation such as a bank loan, bond, note, line of credit or overdraft.
To avoid any confusion, we will use the term “financial debt” (interest-bearing debt) in its specific context and “liabilities” in a more inclusive and broader sense (any obligation needed to be repaid or delivered/serviced).
As an example, accounts payable are not included in our definition of “financial debt” as they rarely bear any interest and are more commercial than financial.
We will differentiate current financial debt (a loan with a maturity of less than one year) from the current portion of long-term debt. The former is regrouped under the general heading “short-term financial debt,” the latter under “CPLTD.”

Main current assets and liabilities
The book adopts the two-sided/column European format, which firstly lists fixed assets (from fixed to liquid) and equity (from long-term to short-term). Format used has no impact on ratio calculation or interpretation.
1.1.2 The Income Statement
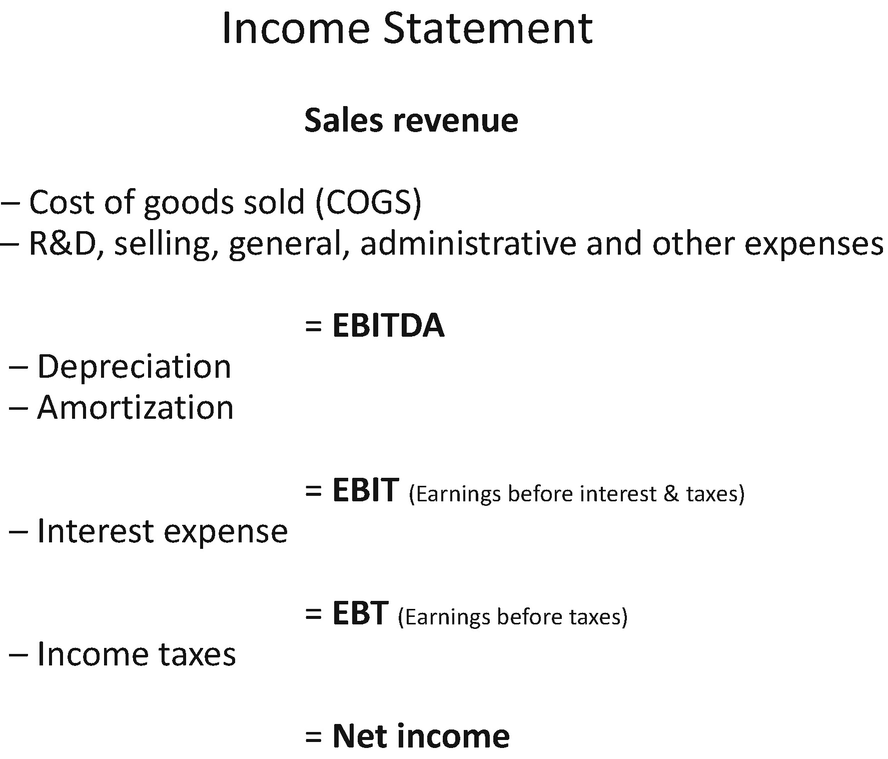
Simplified income statement and main line items
A standard income statement does not show EBITDA, it has to be calculated by simply adding depreciation and amortization expenses to operating income or profit (Earnings before Interest and Taxes or EBIT ). This simplified format is used throughout the book.
1.1.3 The Cash Flow Statement
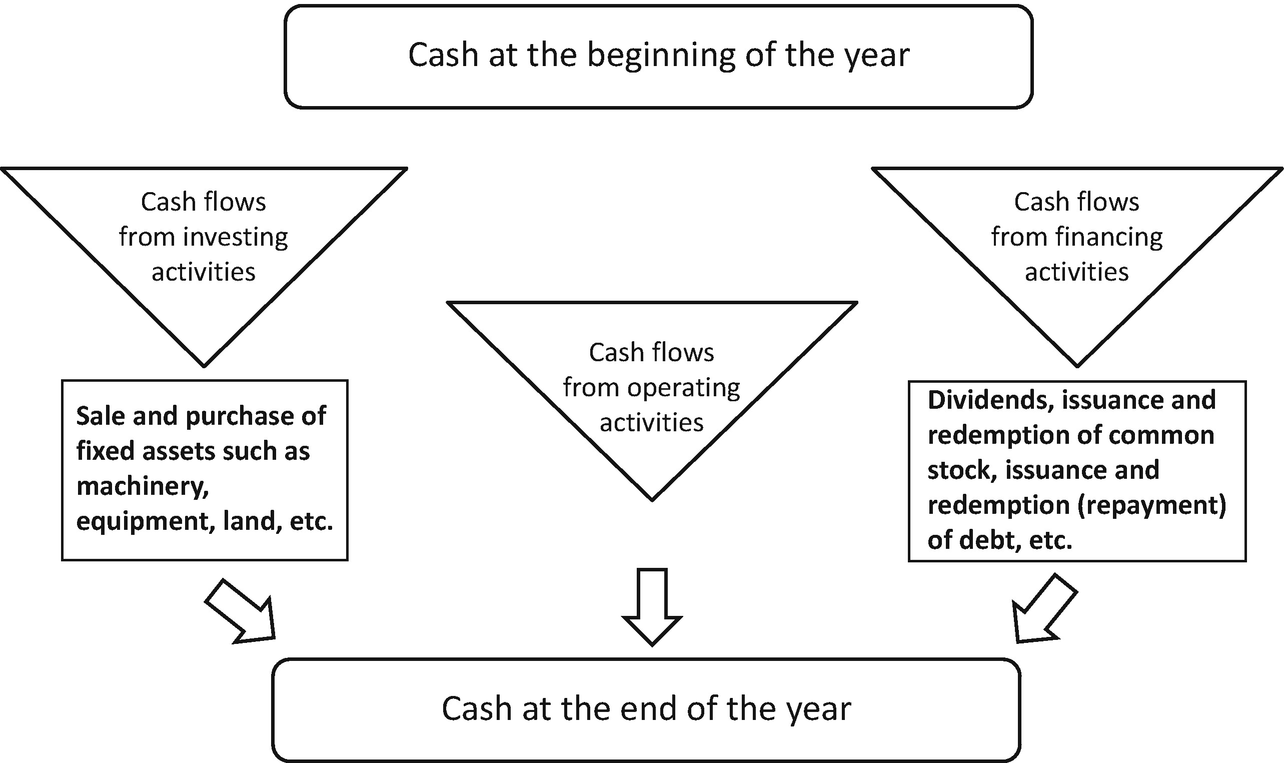
Statement of cash flows
1.2 The Cash Flows
Cash flows are the essence of a business, they reflect the actual cash the company generates today in contrast to historical metrics derived from the balance sheet, as such data are not always reliable. Incorporating them in ratios adds robustness, accuracy and credibility.
1.2.1 FCFF and FCFE

Main beneficiaries of the free cash flows

FCFE and FCFF starting from EBITDA
When little accounting information is available, a rough (but often reliable) estimate of the cash flow generated by a company can be calculated as follows:

Depreciation and amortization are the largest common non-cash expenses. Provisions can also be substantial non-cash items.
1.2.2 EBITDA
Earnings before interest, taxes, depreciation and amortization (EBITDA) is a good proxy for measuring the cash flows generated by the company’s operations.
Here is a basic equation for EBITDA:

Depreciation = tangible assets (PP&E or property, plant and equipment)
Amortization = intangible assets
EBITDA is the starting point for numerous financial analyses, but it has its limitations. For example, it does not consider the level of existing debt and capital expenditure (capex) required.
A company needs to reinvest year after year in capital expenditure in order to maintain its level of EBITDA. Therefore, EBITDA must be linked to the level of investment needed for its maintenance and expansion.
1.2.3 Recurring Cash Flows
Recurring cash flows should be the only relevant cash flows used in ratios and methods of company valuation. Exceptional items should be excluded.
Company Comparison: Bogey or Eagle?
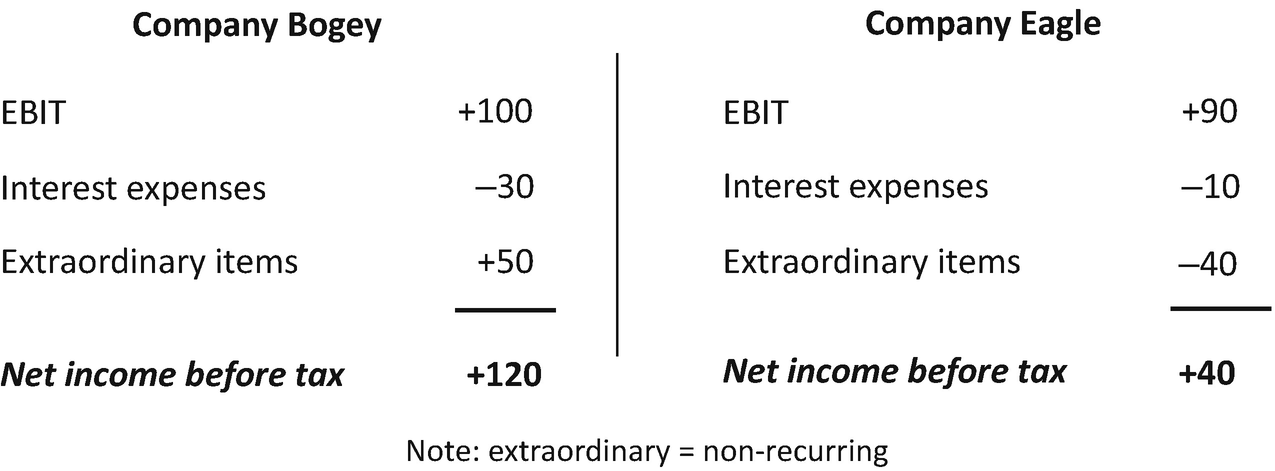
Company Bogey versus company Eagle
According to the above income statements, company Bogey has strongly outperformed company Eagle (3× larger net income before tax).
Company Bogey carries a higher financial leverage (higher interest expenses) and therefore a higher risk than company Eagle. Moreover, company Bogey has a large extraordinary item which is unlikely to reoccur in the future. Company Eagle has a stronger recurring income of 80 (i.e., 90 − 10) compared to 70 (i.e., 100 − 30) for company Bogey.
In conclusion, company Eagle seems to be the best-risk adjusted investment according to the limited information available. It carries less financial risk and generates more recurring income than company Bogey, despite the excellent and perhaps an abnormal performance of company Bogey during that specific year.
1.3 Enterprise Value (EV)
Enterprise value (EV) is the market value of core operating assets. EV (or total firm value) is also the market value of capital employed.
It seems therefore logical to focus first on the definitions of operating assets and consequently capital employed.
Since essential ratios such as the return on capital employed (ROCE) or EV multiples use EBIT (operating income) or EBITDA (operating income + depreciation and amortization (D&A)) as a metric, our definition of operating assets and capital employed becomes of paramount importance and allows for consistency throughout the book.
1.3.1 Capital Employed and Operating Assets
Capital employed is the total amount of capital that has been invested in a company for generating its core operating profit.
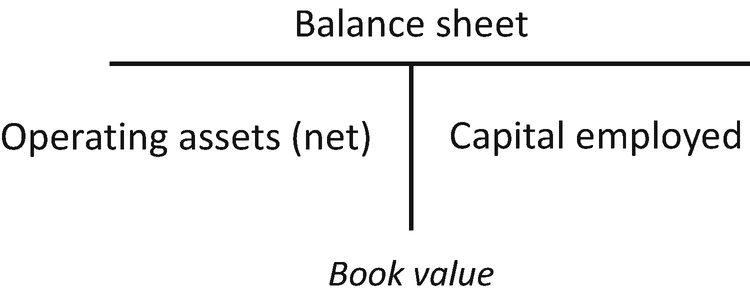
Capital employed and net operating assets
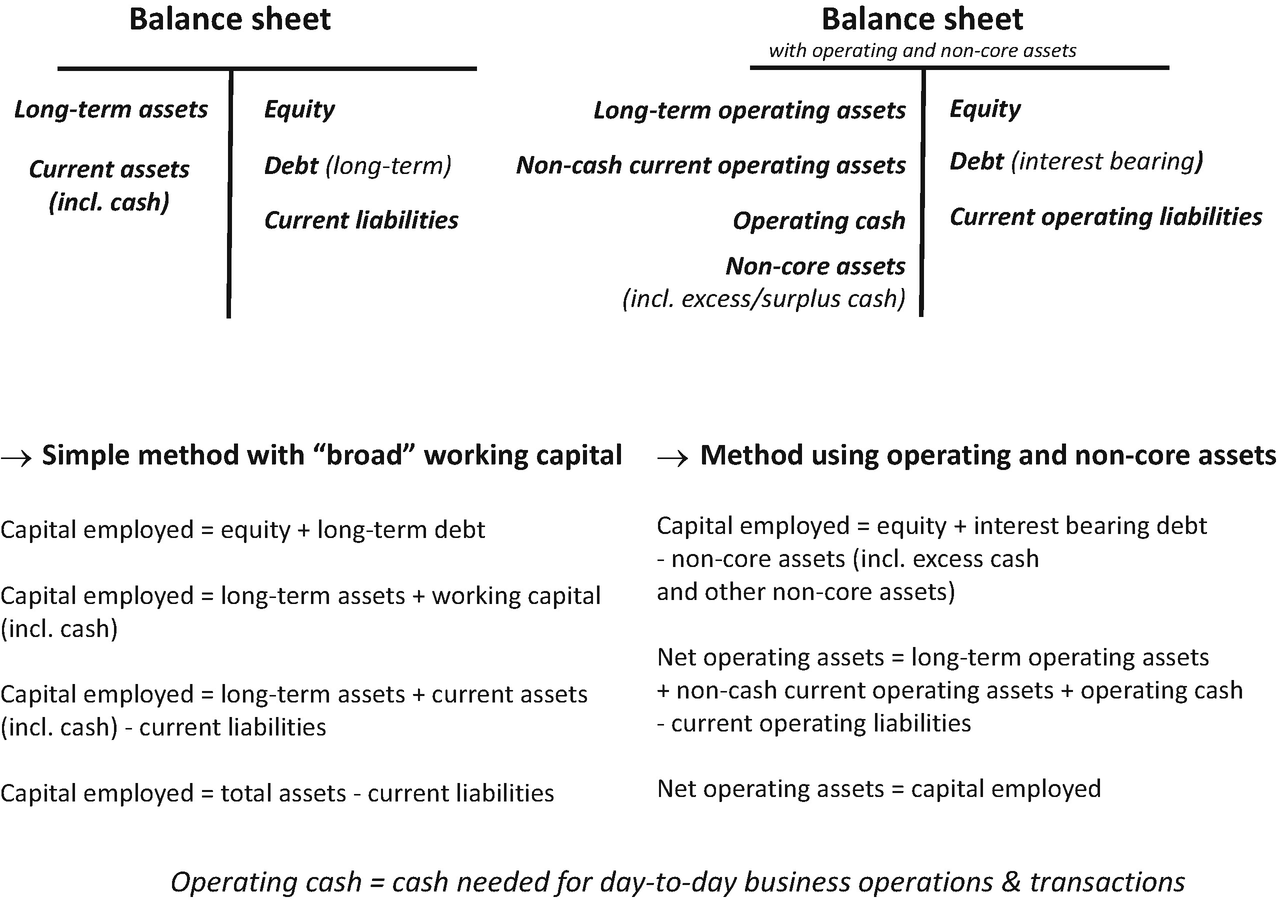
Two versions of capital employed
1.3.2 Examples of Capital Employed Calculations
See the following example showing the calculation of capital employed for a small European company named SGVSL with a low level of cash.
Company SGVSL’s balance sheet
Balance sheet SGVSL in € | Year X | Year X | |
|---|---|---|---|
PP&E (net) | 180,000 | Equity | 150,000 |
Inventories | 40,000 | Long-term bank loans | 80,000 |
Accounts receivable | 45,000 | Loans from shareholders | 25,000 |
Prepaid expenses | 10,000 | Accounts payable | 35,000 |
Marketable securities | Wages and taxes payable | 20,000 | |
Cash | 40,000 | Short-term bank loans | 5000 |
Total assets | 315,000 | Total equity + liabilities | 315,000 |
The Treatment of Cash and Cash Equivalents Can Be Complex!
- 1.
Cash can be considered as part of operating assets and will therefore not reduce debt into net debt. This is usually the case when the amount of cash and cash equivalent (short-term notes, marketable securities, money market funds, etc.) is relatively low (i.e., representing as a rough estimate one week of sales (company specific metric)).
- 2.
When the amount of cash is significant, it can then be split into two unequal components: a smaller operating cash component and a larger excess cash component. Excess or surplus cash (non-core cash) will reduce the amount of debt into net debt and boost profitability ratios as the capital base diminishes.
With the simple method, a broad definition of working capital is implemented, and cash is defined as operating cash only. The non-core assets method is subtler as it sometimes considers overall cash as excess cash, meaning cash being deducted from debt (i.e., net debt). In theory, cash may also be split into operating cash and excess cash.
Simple method with the broad working capital definition
- (a)
Capital employed = total assets − current liabilities = long-term assets + working capital
= 315,000 − (35,000 + 20,000 + 5000) = 180,000 + 40,000 + 45,000 + 10,000 + 0 + 40,000 − 35,000 − 20,000 − 5000 = 255,000 €
- (b)
Capital employed = equity + long-term debt
= 150,000 + 80,000 + 25,000 = 255,000 €
Net operating assets method (operating cash only)
- (a)
Net operating assets = long-term operating assets + operating cash + non-cash working capital from operations
= 180,000 + 40,000 + 40,000 + 45,000 + 10,000 − 35,000
– 20,000 = 260,000 €
- (b)
Capital employed = equity + interest-bearing debt − excess cash
= 150,000 + 80,000 + 25,000 + 5000 − 0
= 260,000 €
Non-cash working capital from operations = 40,000 + 45,000 + 10,000 − 35,000 − 20,000 = 40,000 € (same amount as operating cash)
Conclusions: SGVSL’s Capital Employed
Both methods result in approximately the same amount of capital employed, namely 255,000 € versus 260,000 €.
Having 40,000 € in cash seems to be a perfect match for day-to-day transactions, and it does not appear to be excess cash. Thus, both methods may be applied. In other words, debt cannot be artificially reduced by 40,000 €, and without these 40,000 € in cash, the company simply cannot run its operations smoothly.
If the amount of cash were greater, the two methods would result in significantly different amounts for capital employed.
The following example of company “SGVSL Excess” shows the calculation of capital employed with high cash holdings.
Company SGVSL Excess’s balance sheet
Balance sheet SGVSL Excess, in € | Year X | Year X | |
|---|---|---|---|
PP&E (net) | 180,000 | Equity | 150,000 |
Inventories | 40,000 | Long-term bank loans | 80,000 |
Accounts receivable | 45,000 | Loans from shareholders | 125,000 |
Prepaid expenses | 10,000 | Accounts payable | 35,000 |
Marketable securities | 100,000 | Wages and taxes payable | 20,000 |
Cash | 40,000 | Short-term bank loans | 5000 |
Total assets | 415,000 | Total equity + liabilities | 415,000 |
Simple method with broad working capital definition
- (a)
Capital employed = total assets − current liabilities = long-term assets + working capital
= 415,000 − (35,000 + 20,000 + 5000) = 180,000 + 40,000 + 45,000 + 10,000 + 100,000 + 40,000 − 35,000 − 20,000 − 5000 = 355,000 €
- (b)
Capital employed = equity + long-term debt = 150,000 + 80,000 + 125,000 = 355,000 €
Net operating assets method (excess cash only)
- (a)
Net operating assets = long-term operating assets + operating cash + non-cash working capital from operations
= 180,000 + 0 + 40,000 + 45,000 + 10,000 − 35,000 − 20,000
= 220,000 €
- (b)
Capital employed = equity + interest-bearing debt − excess cash = 150,000 + 80,000 + 125,000 + 5000 − 100,000 − 40,000 = 220,000 €
Net operating assets method (mixed cash)
Cash is split between operating and non-operating cash, and NCWC is used
Overall cash = cash + cash equivalents = 140,000 = 40,000 (operating) + 100,000 (excess)
The shareholders have invested 100,000 € in short-term marketable securities.
Net operating assets = long-term operating assets + operating cash + non-cash working capital from operations
= 180,000 + 40,000 + 40,000 + 45,000 + 10,000 − 35,000 – 20,000
= 260,000 €
Capital employed = equity + interest-bearing debt − excess cash
= 150,000 + 80,000 + 125,000 + 5000 − 100,000 = 260,000 €
Conclusions: SGVSL and SGVSL Excess’s Capital Employed
Between SGVSL and SGVSL Excess, the only differences are marketable securities and loans from shareholders. However, operating assets are still the same, and thus the measurement of capital employed should logically remain the same at 260,000 €.
The most demanding and complete method is clearly to split the cash into operating and non-operating cash whenever possible, even when determining the amount of operating cash can get tricky. The method of considering cash as excess cash only is also acceptable. When the amount of cash appears to be relatively high, we should avoid the method of using the broad definition of working capital because it distorts the capital employed amount (i.e., 355,000 € instead of 260,000 €).
The method using cash as excess cash only is acceptable (i.e., 220,000 €) considering the fact that determining the right amount of operating cash is difficult and somewhat arbitrary. If the cash position is substantial, the operating cash component is much smaller than the essential excess cash component.


Using the broad and common working capital formula is not always meaningful for a company with large cash holdings or large non-core assets.
1.3.3 Non-Core Assets
Non-core assets are non-essential and non-strategic assets that are not required for running the company’s core operations. These non-operating assets do not generate recurring EBITDA or EBIT. Assets such as excess or surplus cash, investments in marketable securities or non-strategic minority holdings (non-consolidated) belong to this asset category. Land and real estate investments can also be non-core assets if they are not necessary for the company’s business operations (i.e., they were probably necessary in the past but no longer in use today). If sold, the net proceeds would boost the cash holdings of the company and could be used to reduce debt. The proceeds could also be used to pay dividends. These non-core assets may generate non-operating income (interest or rent) and expenses (property tax) but the net impact on the company’s bottom line is usually limited.
Subtracting non-core assets from debt is similar to an EV calculation. Unlike EV, however, these assets remain book-value and not market-value based.
1.3.4 Definition of Enterprise Value
Enterprise value is commonly used as an important valuation tool by advisory firms in Mergers and Acquisitions (M&A) and in Private Equity activities. The EV aggregate has also become increasingly important for stock market analysis when using ratios such as EV to EBITDA multiple and all its possible variations. EV multiples are valuation metrics that are highly complementary to the classic Price to Earnings ratio (or P/E ratio).
Enterprise value (EV) is the market value of the core operating or business assets of a company. It is a strong and proven concept that clearly links operating assets, debt and cash. It can be explained either by the asset side or the equity side of the balance sheet, and thus it has a dual definition.
Enterprise value can also be defined as the theoretical takeover price of a company, and it is inclusive of the payoff of all capital claims (i.e., equity + debt + preferred shares/stocks). This takeover price would allow for the purchase of the company’s entire capital base and the repayment of all incurred financial debt (including lease obligations), while enabling the buyer to benefit from non-core assets (including excess cash) that could contribute to its debt repayment. In this way, we can understand enterprise value as the price tag of a “debt-free” company.
Enterprise value also represents the total amount of capital invested by common or preferred shareholders, long-term or short-term debt holders, or any additional long-term provider of funds to the company. Even a short-term loan provider is considered a long-term capital investor because short-credit facilities are typically renewed on an annual basis.
A trade debt (under accounts payable) is not an interest-bearing debt and should not be included in the category of capital invested. The goal of a supplier is to deliver the goods or services that are needed throughout the course of the business cycle, not to provide funding. Accounts payable are included in the calculation of the non-cash working capital from operations (i.e., net working capital).
One area of difficulty is minority interest (non-controlling interest) which is added to provide consistency within EV ratios. If the parent company’s EBITDA includes 100% of the subsidiary’s EBITDA, it seems fair to include 100% of the complete long-term capital of the subsidiary. It is also consistent with the dual aspect definition of EV, as 100% of the subsidiary’s operating assets are consolidated. If minority interest were not included on the equity and liability side, both definitions of enterprise value would result in different and inconsistent results.
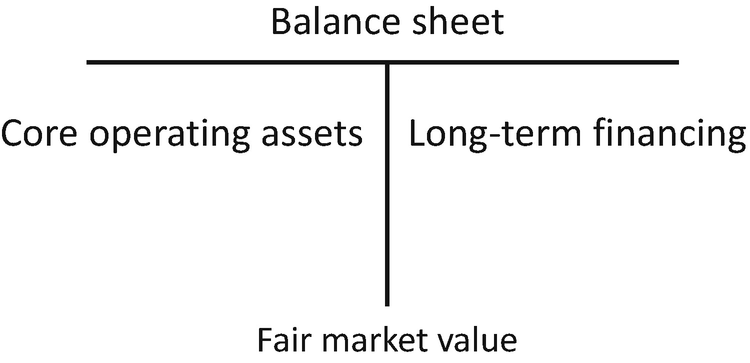
Operating assets and long-term financing
As a reminder, for a consolidated balance sheet, non-controlling interest (NCI) or minority interest represents the portion of “total capital” not directly owned by the shareholders of the parent company.
EV Is Valued at Market Price
The terms market price, fair market value, market value, mark-to-market and market capitalization are used interchangeably throughout the book, but they are clearly defined as a separate category from book value. The term “fair market value” will be used for assets outside of real estate properties. The underlying assumption is that is the price of an asset must be reasonably fair and reliable, unless the asset is liquidated.
For a listed company traded on a reasonably efficient market, the market cap can replace the fair market value of equity. For small caps that are quoted on markets with poor liquidity, using market cap may be problematic, and thus the term “fair market value” of equity. The term “fair” before market value emphasizes the fact that the market must be efficient. In this way, “the price” reflects the fundamental value.
With behavioral finance, however, we know that this is not always true. The existence of speculative bubbles is a case in point, and the existence of alpha (i.e., abnormal excess return) proves that stocks are often under or overvalued. Therefore, the term market value remains an estimation of the fair value of equity.
EV and the Market Value of Equity
Enterprise value is often confused with company value, or in other words, it is confused with the fair market value of its equity or its market capitalization in an efficient market. It is crucial to note that they are not equivalent to one another.
Enterprise value ≠ company value
If the market is efficient, the company value should reflect its level of debt and therefore risk. Moreover, it should reflect the level of non-core assets (including excess cash) that a company controls.
For example, when you buy a company, you own the assets and benefit from the cash, but you also carry the debt. The more productive assets a company controls and the more cash a company holds, the less debt a company carries and thus the more valuable a company is.
Enterprise value is the value of the entire business operations of a firm, while equity value is the market capitalization of a firm (or the fair market value of its equity for a non-listed company).
Both metrics are equal only when financial debt is equal to excess cash or alternatively, if both financial debt and excess cash are equal to zero.
EV = FMV equity + [FMV debt − excess cash (or non-core assets) = 0].
EV= FMV equity (private company).
With FMV equity defined as the fair market value of equity.
1.3.5 The EV Concept Applied to Comparable Companies
A simple example will help the reader better understand the fundamental equation that links operating assets (EV), equity, debt and cash.
Let us take four comparable companies with equivalent operating assets (i.e., same business assets) generating equivalent operating income.
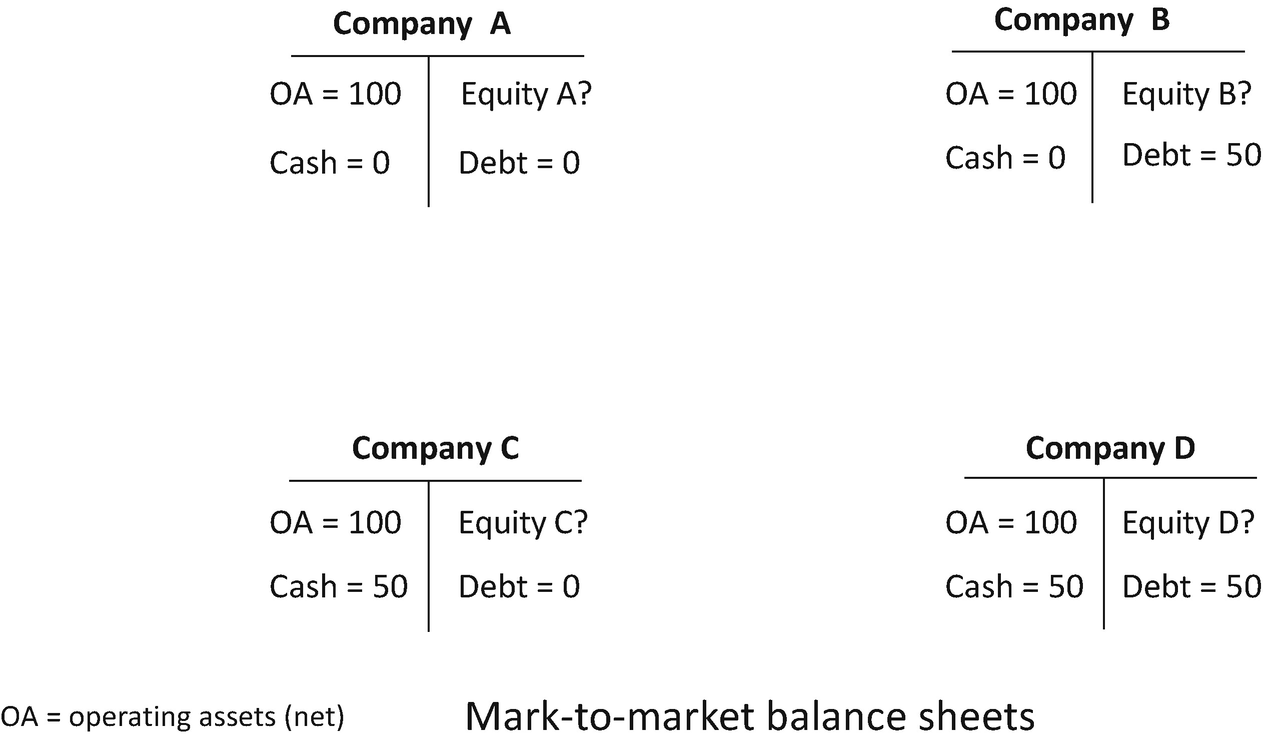
Comparable companies with the same operating assets
The fundamental equation defining a balance sheet appears as follows:

Consequently ,

Market value of equity A (MVE A) = 100 + 0 − 0 = 100
Market value of equity B (MVE B) = 100 + 0 − 50 = 50
Market value of equity C (MVE C) = 100 + 50 − 0 = 150
Market value of equity D (MVE D) = 100 + 50 − 50 = 100
If the market is efficient, the equity market value should always reflect the value of operating assets, cash and debt. A comparable company (B) carrying a large debt and no cash (i.e., MVE = 50) is worth less than a comparable company (C) holding a large cash position and no debt (i.e., MVE = 150).
It may sound logical, even trivial, but an investor who is purely fixed on P/E ratios may overlook this aspect (i.e., the importance of debt and cash), thus overlooking the benefits brought by enterprise value and its associated ratios.
1.3.6 The EV Concept Applied to Real Estate Investments
A detailed example involving real estate will help the reader better understand the essential difference between equity and company valuations.
Successive Sales of Real Estate Property Alpha
Imagine that real estate property Alpha (a well-located villa on a large tract of land) was acquired by three successive buyers in 2018, 2019 and 2020 for the identical price tag of $600,000, net. (In this simplified example, we will not take into consideration real estate agent or notary fees).
The first buyer (2018) made a down payment of $600,000 (equity), no credit financing was required.
The second buyer (2019) made a down payment of $200,000 (equity) and consequently borrowed $400,000.
The third buyer (2020) invested only $50,000 (equity) and borrowed $600,000. He therefore had a cash deposit of $50,000 in his company’s bank account.
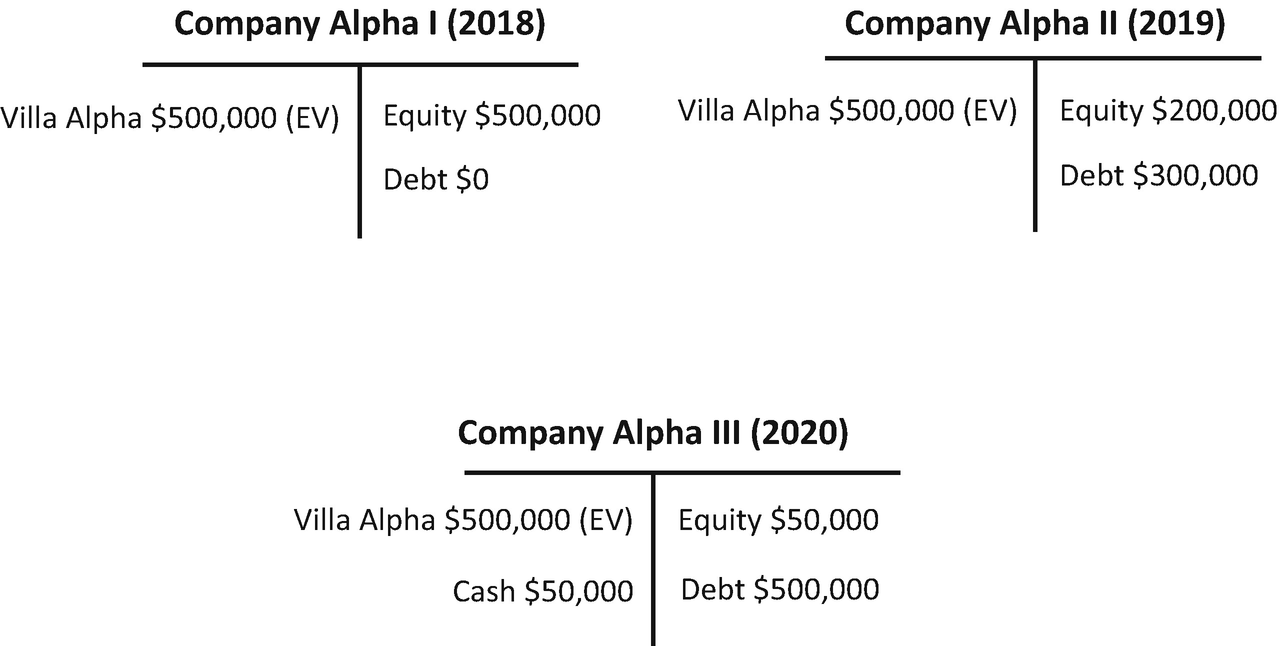
Successive villa Alpha’s purchases in 2018, 2019 and 2020
Business valuation of the successive Alpha companies
In 2018, the value of company Alpha I (value of shareholders’ equity) is $600,000 (this is the only case where the two “values” are equal, EV = market value of equity)
In 2019, the value of company Alpha II (value of shareholders’ equity) is $600,000 − $400,000 = $200,000
In 2020, the value of company Alpha III (value of shareholders’ equity) is $650,000 − $600,000 = $50,000
Operating assets calculation
Alpha I: operating assets = 600,000 + (0 − 0) = $600,000
Alpha II: operating assets = 200,000 + (400,000 − 0) = $600,000
Alpha III: operating assets = 50,000 + (600,000 − 50,000) = $600,000
The value of operating assets remains constant (no depreciation and amortization or D&A applied)
In this simplified example, the book or historical value of the operating assets (the villa) is equal to its market value. There is no significant difference between the two (short time span).
Creation of a New Lot, Beta, Within the Large Tract of Land in 2020
The final buyer, an experienced businessman, decides to create and sell a new lot within his large acreage, estimated at $50,000 by his notary.
It can be assumed that the value of the property remains almost identical, and the rental value of the property Alpha will only change marginally. The magnificent villa is still surrounded by a substantial beautiful garden.


Impact of lot Beta in 2020
1.3.7 EV Equations
For a non-listed company (non-publicly traded) :

For a listed company (usually consolidated) :
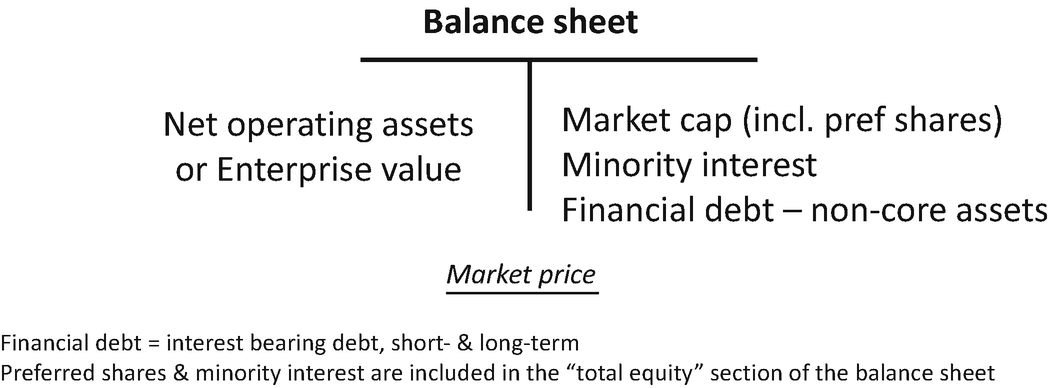
EV for a listed and consolidated company

![$$ \mathrm{Market}\ \mathrm{cap}=\left[\mathrm{common}\ \mathrm{shares}\ \mathrm{outstanding}\times \mathrm{current}\ \mathrm{market}\ \mathrm{price}\ \mathrm{of}\ \mathrm{the}\ \mathrm{common}\ \mathrm{shares}\right]+\left[\mathrm{preferred}\ \mathrm{shares}\ \mathrm{outstanding}\times \mathrm{current}\ \mathrm{market}\ \mathrm{price}\ \mathrm{of}\ \mathrm{the}\ \mathrm{preferred}\ \mathrm{shares}\right] $$](../images/489628_1_En_1_Chapter/489628_1_En_1_Chapter_TeX_Equk.png)
Preferred shares need to be included in the EV calculation, whatever the used classification (equity, debt or hybrid instruments?).
We define net operating assets as follows:
Net operating assets = operating assets (non-current and current, including operating cash) − current operating liabilities.
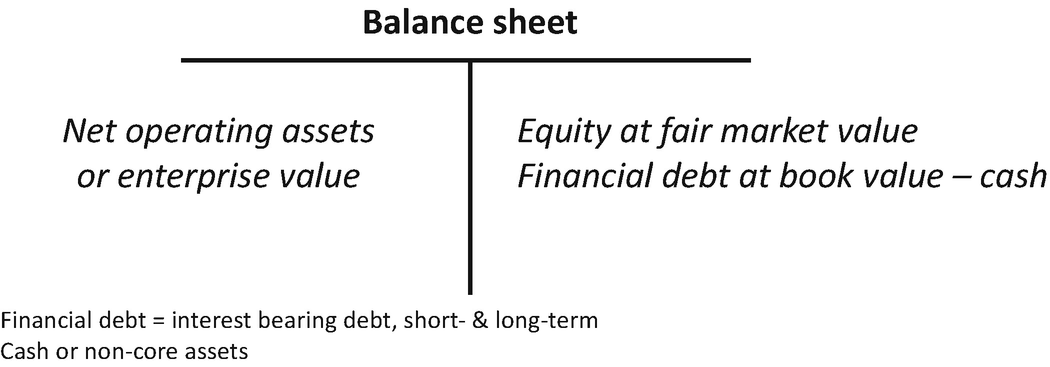
Simplified EV for a non-listed company

Market Value of Debt Versus Book Value of Debt
Example with a specific loan
Outstanding loan (book value) = $100,000
Interest-only loan = $3000 yearly (interest expense)
Principal paid in two years (bullet) = $100,000
Current two-year interest rate = 2%

The interest rates have decreased from 3% down to 2%, and thus the debt value has increased accordingly.
The book value of debt replaces the market value of debt in most cases. The book value of debt (i.e., amount of debt outstanding = initial debt amount − cumulative principal payments) is a good quality substitute, and sometimes it may be the only available data.
Market Capitalization Definition
If the stock market is fully efficient, market capitalization should be equal to the following :

1.3.8 EV Calculation (MTM Accounting)
Company SEGA’s balance sheet, MTM
Company SEGA, fair market value, in $1000 | Year X | Year X | |
|---|---|---|---|
Fixed assets (operating) | 1000 | Equity at fair market value | 600 |
Current assets (operating) | 500 | Financial debt | 1200 |
Day-to-day cash (operating) | 50 | Current liabilities (operating) | 400 |
Non-core assets (100 in surplus cash) | 650 | ||
Total assets | 2200 | Total equity and liabilities | 2200 |
Company SEGA’s EV Calculation
We calculate SEGA’s enterprise value as follows:
First method (asset side)
EV = Fixed operating assets + current operating assets − current operating liabilities
EV = 1000 + 500 + 50 − 400 = $1150,000
Second method (liability side)
EV = equity at fair market value + debt − non-core assets
EV = equity at fair market value + net debt
EV = 600 + 1200 − (550 + 100) = 600 + 550
EV = $1150,000
Company SEGA’s balance sheet showing EV
Company SEGA, fair market value, in $1000 | Year X | Year X | |
|---|---|---|---|
Market value of operating assets (EV) | 1150 | Equity at fair market value | 600 |
Non-core assets | 650 | Debt | 1200 |
Total | 1800 | Total | 1800 |
1.3.9 EV Calculation (Using DCF Method)
Let us now approach company SEGA using the discounted cash flow method or model (DCF with the direct method).
Company SEGA’s FCFF
SEGA | Year 1 | Year 2 | Year 3 | Year 4 | Year 5 | Normalized flow 6 |
|---|---|---|---|---|---|---|
FCFF | 40,000 | 45,000 | 50,000 | 55,000 | 55,000 | 57,500 |
Reminder: FCFF is the cash flow available to all the firm’s suppliers of capital (i.e., stakeholders) once the firm has paid off all operating and tax expenses and has paid for investments needed to maintain the firm’s operating assets (i.e., capex + growth in NCWC).
Growth in NCWC is defined as the investment or change in non-cash working capital (from operations ).

Perpetual growth rate g = 1.5% (normalized cashflows will grow at this rate following year six)
Weighted average cost of capital (WACC) = 6%
As a reminder, the WACC formula is the following:

The WACC formula using simplified EV is as follows:WACC = (market cap/EV) × cost of equity + (book value of debt/EV) × net cost of debt (after tax)
An even more simplified WACC formula using book value instead of market value follows thereafter:WACC = (equity/capital employed) × cost of equity + (debt/capital employed) × net cost of debt
Calculation of the terminal value at time 0
Terminal value (t = 5) = 57,500/(6% − 1.5%)
Terminal value (t = 5) = $1,277,778
Discounted terminal value (t = 0) = 1,277,778/(1 + 6%)5 = $954,830
Calculation of the five successive FCFF at time 0
Discounted value of the five yearly FCFF (t = 0) = 40,000/(1 + 6%)1
+ 45,000/(1 + 6%)2 + 50,000/(1 + 6%)3 + 55,000/(1 + 6%)4
+ 55,000/(1 + 6%)5 = $204,431

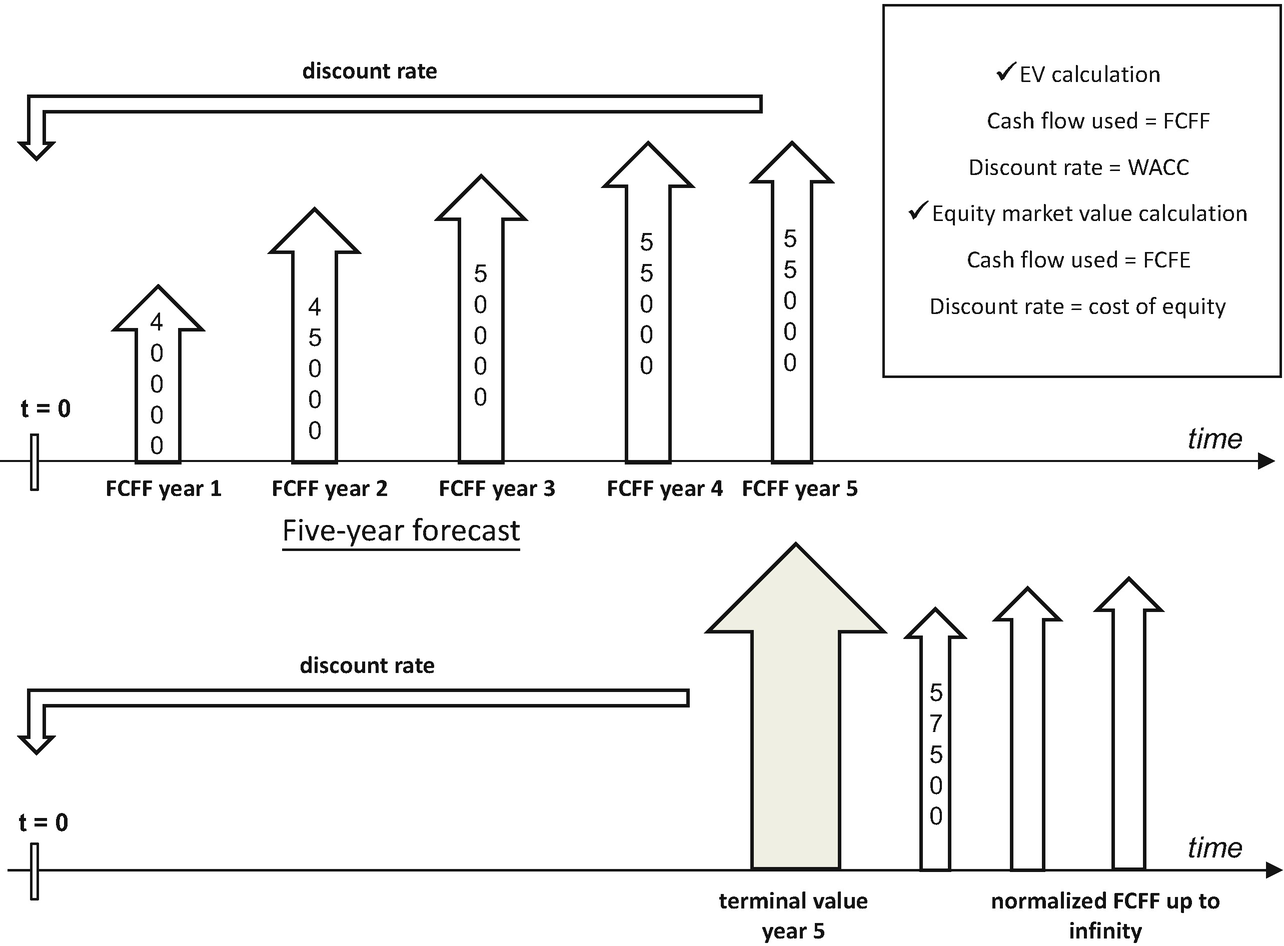
EV direct calculation with discounted FCFF and terminal value
Enterprise value can also be calculated by what is called the indirect method. First, future FCFE are discounted using cost of equity, and it can be summed up at the starting point (t = 0) in order to calculate the market value of equity. Net debt is then added to equity market value in order to obtain the enterprise value.
The DCF method with FCFF or FCFE cash flows or the comparable company analysis is a common tool used for company’s valuations (i.e., EV or equity).
On the Importance of Non-Core Assets
We now see the importance of separating non-core assets from operating assets. Despite the fact that non-core assets are not generating future FCFF, they are valuable assets and cannot be omitted. Moreover, mixing the two components would result in inconsistent EV valuations. In the present case, the equity market value of SEGA is equal to $1150,000 − $1200,000 + $650,000 = $600,000 and NOT $1150,000 − $1200,000 = − $50,000.
The non-core assets cannot be ignored.
1.4 Key Takeaways on Key Financial Metrics and Enterprise Value
Essential metrics
EBITDA | Operating profit + depreciation + amortization |
EBIT | Operating profit or income |
EV | Operating assets or capital employed at market value |
Limitations
EBITDA is a non-standardized metric and therefore subject to conflicting interpretations or even manipulations. Free cash flow metrics represent good alternatives.
EBITDA must be linked to the level of investment needed (capex ) for its maintenance and expansion.
Separating non-core assets (including excess cash) from core assets is an essential, however complex, task. Non-core assets can significantly reduce debt and affect EV.
Calculation of EV should preferably be concomitant with the closing date of a balance sheet in order to get synchronized debt valuation and capitalization.
Adjusted net income, excluding non-recurring items, is an essential input for the measurement of financial profitability.