1 The water of the oceans
Oceanography is the scientific study of the oceans, and of the organisms that live in them. Let’s start by considering the dimensions of the subject before us. The oceans cover a large part (roughly 70%) of the earth’s surface, but their vertical scale is small compared to the horizontal. Figure 1.1 shows a map of ocean depths. There are mountains and valleys on the sea floor, just as there are on dry land, but the average depth of all the oceans is about 4 km. This compares to the width of the oceans, which is variable, but which is of order 10,000 km. The ratio of the width to depth, the aspect ratio, is therefore 10,000:4, or 2,500:1. That’s about the same as the aspect ratio of the page you are reading right now. Although oceans are thin compared to their width, changes with depth are very important, as we shall see in this chapter. For example, the temperature of ocean water can change as much in going down a few kilometres from the surface at the equator to the ocean floor as it can in travelling along the surface from the equator to the poles.
Around the margins of the oceans there are shallow water bodies called shelf seas. These are much smaller in horizontal extent (say 250 km) and shallower (typically 100 m) than the oceans, but they have a similar aspect ratio. Examples of shelf seas are the North Sea in Europe or the Yellow Sea in Asia.
1.1 Salinity and temperature of ocean water
The most obvious difference between ocean water and water that comes out of the tap is that the ocean is salty. It is not obvious where the salt comes from: rivers flowing into the ocean appear to carry perfectly fresh, drinkable water. In fact, river water contains trace amounts of ions produced by the weathering of rocks, but which are present in such low concentrations that we cannot taste them. Rivers are the largest source of the major ions in the oceans (Chapter 9), and these ions have accumulated over millions of years (it is estimated that sodium (Na+) has a residence time of 78 million years and calcium (Ca2+) around 1.1 million years in the ocean). A further source of ions is underwater volcanic eruptions. The fact that ocean salinity is not increasing perceptibly means that the ions introduced to the ocean are removed at about the same rate. Ions are removed by being incorporated into the biology and sediments, transferred to the atmosphere when bubbles burst on the ocean surface producing aerosols, evaporating and precipitating out of solution.
The average salt content of all the oceans is about 35 grams of salt per kilogram of water, or 35 parts per thousand, by mass. Since 1978, scientists have used practical salinity units (PSU) to express salinity. This is a ratio, and so has no units. In most cases, salinity on the PSU scale corresponds closely to parts per thousand.
Evaporation removes fresh water from the surface of the ocean and so increases the salinity of the water left behind. The salinity of the surface of the open ocean varies between about 34 and 37, with maximum values in the desert latitudes – 30°N and 30°S of the equator, where evaporation exceeds precipitation by the greatest amount (Figure 1.2). The English physicist Robert Boyle was the first to notice the link between ocean salinity and the balance between evaporation and freshwater input. In coastal waters, the salinity variation can be much greater, falling to less than 10 in semi-enclosed seas with high freshwater input such as the Baltic Sea and rising to over 40 in seas with high evaporation such as the Red Sea.
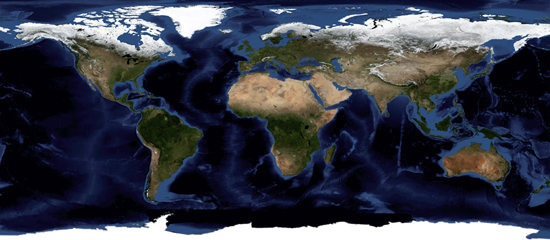
Figure 1.1 Map of ocean depths. The deep blue areas show the deeper parts of the oceans and the lighter blue the shallower parts.
The vertical variation of salinity can be measured by lowering an instrument called a CTD (which stands for Conduct ivity–Temperature–Depth) into the ocean (Figure 1.3). Further details of this and other oceanographic instruments are given in chapter 14. The change in salinity with depth at a hydrographic station in the north-east Atlantic is shown in Figure 1.4A. Starting at the surface, the salinity first falls and then rises to a maximum in a layer centred at a depth of 1000 m. This layer of salt water is encountered through much of the north Atlantic and is caused by warm, salty Mediterranean water flowing out through the Strait of Gibraltar. Below this layer the salinity decreases slowly towards the ocean floor. The decrease in salinity with depth is a feature of Atlantic waters and is not observed in the Pacific and indian Oceans.
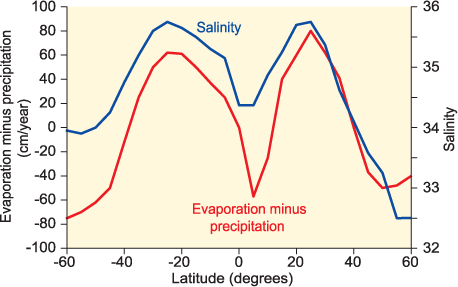
Figure 1.2 Variation of ocean surface salinity (blue line) with latitude. Latitudes south of the equator are shown negative. Maximum salinity occurs in the ‘desert latitudes’ at approximately 30° North and South. The red line shows the difference between annual evaporation and precipitation. High surface salinity corresponds with high evaporation compared to rainfall.
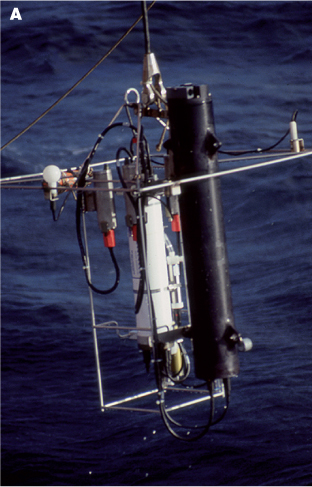
Figure 1.3 (A) The white instrument in the centre of this array is a conductivity–temperature–depth probe (or CTD) being deployed.

Figure 1.3 (B) However, normally it is hidden in the middle of a rosette of sampling bottles.
The ocean is warmed at the surface by the sun. Surface temperature is therefore greatest at the equator and decreases towards the poles at a gradient of about 1/3 °C per degree of latitude (or about 0.003 °C/km). The sun warms a surface mixed layer a few tens of metres thick, and below this temperature decreases, quickly at first and then more slowly, with depth (Figure 1.4B). The region where temperature is changing is called the main ocean thermocline. Here the vertical gradient of temperature can be 10 °C/km: changes in temperature and other properties of ocean water are generally much greater in the vertical than they are in the horizontal. At the bottom of all the oceans, the water is very cold indeed even at the equator. This fact puzzled early oceanographers. In a nonmoving ocean, the sun’s heat would gradually diffuse down to the ocean floor, producing oceans of nearly uniform temperature from top to bottom. The finding that the bottom waters of the ocean are extremely cold was the first clue in the discovery of the deep, slow movement of ocean waters, now called the thermohaline circulation.

Figure 1.4 Vertical profiles of (A) salinity and (B) temperature in the Atlantic Ocean at latitude 40 degrees north. Note the maximum in salinity at a depth of 1000 m and the cold water at great depth.
1.2 Water masses and mixing
A water mass is a body of water formed in a particular place in the ocean, and which has characteristic values of temperature and salinity associated with that place. An example of a water mass that we have already met is the Mediterranean water flowing into the Atlantic through the Strait of Gibraltar. When a water mass flows in the ocean it mixes with other water masses, both above and below it as well as at its sides. As a result, it gradually loses its characteristic features. But, before this happens completely, the water masses can be traced for thousands of kilometres, and a picture of the way the deep circulation of the ocean works can be built up. In the case of the Mediterranean outflow, it spreads out through the north Atlantic at a depth of about 1000 m, mixing with Atlantic water both above and below it (Figure 1.5).
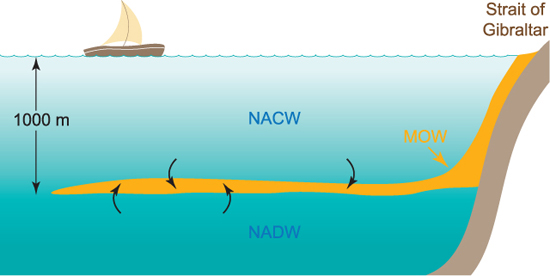
Figure 1.5 Sketch of a vertical section through the Atlantic at 40 degrees north. Mediterranean outflow water spreads out at a depth of 1000 m flowing between North Atlantic Central Water (NACW) above and North Atlantic Deep Water (NADW) below. The Mediterranean water mixes with these two water masses as it spreads out, gradually losing its characteristics as it travels further from the strait of Gibraltar.
Oceanographic observations of temperature and salinity can be plotted on a figure called a temperature–salinity (or T/S) diagram, which is a graph of temperature at a given depth against salinity at the same depth. In Figure 1.6, we have plotted the temperature and salinity data from Figure 1.4 in this way. The details of the depth of the measurements are now lost but can be added by annotating some of the points as we have done in this figure. A water mass with a given temperature and salinity can be marked as a single point on a T/S diagram. For example, the characteristic values of Mediterranean Outflow Water shortly after leaving the Strait of Gibraltar are T = 11, S = 36.5, and we have marked this water mass (labelled as MoW) on Figure 1.6. You can see that the observations in the Atlantic (which were taken 1000 km from the Strait of Gibraltar) tend towards this point at one stage, but don’t reach it because of mixing with Atlantic water. We have also marked the temperature and salinity characteristics of the Atlantic Water above and below the Mediterranean outflow on this diagram. These water masses are called North Atlantic Central Water (abbreviated to NACW) and North Atlantic Deep Water (NADW).

Figure 1.6 A Temperature–Salinity (or T/S) diagram for the data in Figure 1.4. Temperature is plotted against salinity, and the depths of some of the measurements are marked. The characteristic temperature and salinity values of three water masses: Mediterranean Outflow Water, North Atlantic Central Water (in this part of the Atlantic) and North Atlantic Deep Water have been marked on the diagram.
A useful feature of T/S diagrams is that, if two water masses mix, the temperature and salinity of the mixture fall on a straight line joining the two water masses on the diagram. This is illustrated in Figure 1.7A, where we have shown the mixing of two water masses, WM1 and WM2. A mixture of 25% WM1 and 75% WM2, for example, would lie ¾ of the way along the line joining WM1 to WM2. The greater the proportion of WM2 in the mixture, the closer this point will get to WM2. If a water mass mixes with two other water masses (as is the case with the Mediterranean outflow) the mixture will lie within a triangle on a T/S diagram (Figure 1.7B). Each of the three water masses occupies a corner of the triangle and any mixture of these three water masses will have temperature and salinity values lying within the triangle. For example, lines representing different proportions of WM3 are shown in Figure 1.7b. In this way, the proportion of a water mass in a sample of water measured at sea can be calculated if the water masses that have mixed to create it are known.
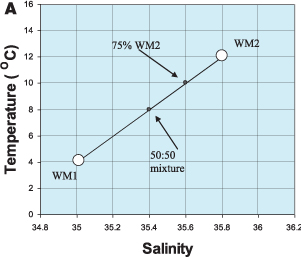
Figure 1.7 (A) Mixing between water masses can be quantified on a T/S diagram. Two water masses (WM1 and WM2) are mixing with each other. The temperature and salinity of the mixture lies on a straight line between WM1 and WM2.
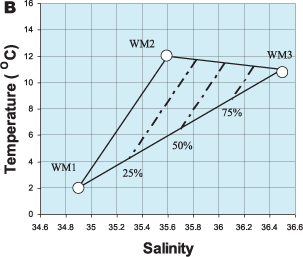
Figure 1.7 (B) Mixing between water masses can be quantified on a T/S diagram. Three water masses are mixing. The temperature and salinity of the mixture lies within a ‘mixing triangle’. The dashed lines show different proportions of WM3 in the mixture.
Figure 1.8 shows the mixing triangle method applied to the data from the north Atlantic station. We have now completed the mixing triangle between the three water masses MoW, NACW and NADW and marked the proportions of MoW within the triangle. It can be seen that the water at a depth of 1000 m at this station contains just over 50% Mediterranean Outflow Water. In travelling 1000 km from the Strait of Gibraltar, the outflow has been diluted by nearly one half as it mixes with Atlantic water above and below. With a little further analysis it is possible to work out the rate at which mixing happens in the ocean in this way.

Figure 1.8 Application of the mixing triangle to the data in the north Atlantic. The most saline water, at a depth of 1000 m at this station, contains just over 50% Mediterranean Outflow Water.
1.3 The deep circulation of the ocean
The great value of the water mass concept has been in building up a descriptive picture of the circulation of the oceans. The currents in the deep part of the ocean are extremely slow and too variable for the pattern of the average currents to be determined by direct observation, but water mass analysis allows depths and directions of the currents (but not speed) to be determined. To estimate the speed, we have to add another measurement (for example, dissolved oxygen) to temperature and salinity.
The ocean is warmed by the sun at the surface. Because warm water is buoyant, this produces a warm surface layer in low and temperate latitudes. The ocean is fundamentally different to the atmosphere in this regard. The atmosphere is warmed from below by the heated surface of the earth, and this causes the warm air to rise and create the atmospheric circulation. In the case of the ocean, warming by the sun cannot create a circulation in this way: the warm water just sits on the surface. Instead, in the ocean, cooling at the surface is the important process. At high latitudes, the ocean gives more heat to the atmosphere than it gains from the sun, and there is a net cooling of surface waters. The cooled water sinks and may be sufficiently dense to replace deeper waters. This cold water, sinking near the poles, spreads out through the bottom of the ocean, creating the deep cold water seen in Figure 1.9. This is the reason why the bottom of the ocean is so cold. Cold bottom waters at the equator have come from the polar seas. It is now known that the sinking takes place in just a few rather localised areas: the Weddell and Ross seas in the Southern Ocean (Antarctica) and near Greenland in the Arctic.
This sinking of water at high latitudes has to be balanced by a rising (or upwelling) of water elsewhere in the ocean. It appears that a slow upwelling of water takes place throughout the rest of the ocean, so that water sinks in just a few localised places, rises back to the surface throughout the ocean and then flows polewards in surface currents, completing the loop. This large-scale circulation of the ocean is called the thermohaline circulation because it is driven by differences in temperature and salinity. Surface heating and cooling alone are not enough to drive this circulation. Energy is also needed, because the kinetic energy created by the sinking is not available to produce the increase in potential energy when the cold waters rise back to the surface (a concept now called Sandstrom’s theorem, named after the Swedish oceanographer Johan Sandstrom). It is probable that the energy is provided by friction acting on tidal flows within the main ocean thermocline.
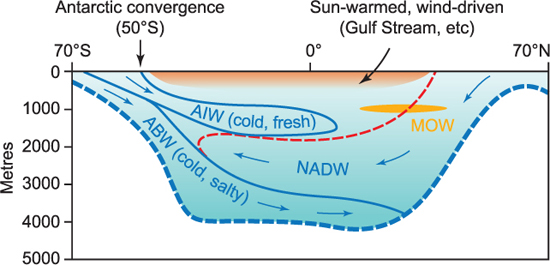
Figure 1.9 A vertical section through the Atlantic from 70° S to 70° N showing the principal water masses identified from their temperature and salinity. The most dense water in this section is Antarctic Bottom Water, formed around Antarctica in winter; this fills the deep basins in both the south and north Atlantic. Antarctic Intermediate Water, formed in summer, is less dense and lies on top of North Atlantic Deep Water, formed in the Arctic. The Mediterranean outflow forms a core at a depth of 1000 m through much of the north Atlantic.
Temperature and salinity sections through the Atlantic from the Antarctic ice edge to the edge of the Arctic Ocean show how the circulation of the deep ocean can be interpreted from T–S data (Figure 1.9). Starting at the southern end of the section, the coldest water (formed in the Weddell Sea in winter) sinks to the ocean bottom and spreads northward as very cold, relatively salty, Antarctic Bottom Water (ABW). Salt is added to seawater during ice formation, and this helps to increase the density of this water. The surface layers of the ocean around the Antarctic continent formed in summer are cold, but less saline because of melting ice. These stretch northward and sink at the Antarctic convergence (about 50° S) as Antarctic Intermediate Water (AIW). Between these two water masses, North Atlantic Deep Water (NADW) flows southwards. NADW forms in the extreme north Atlantic where cold water sinks to a depth of about 3000 m and travels southwards towards the Antarctic. The distinctive core of Mediterranean outflow water (MoW) is noticeable in both sections of temperature and salinity. This deep circulation is important to ocean life because it carries oxygen down to the very bottom of the ocean, without which the oxygen in the depths would be depleted, or even used up, by the decomposition of organic matter (see chapters 8 to 11).
There is no equivalent to the sinking of North Atlantic Deep Water in the Pacific Ocean. Surface waters in the north Pacific are somewhat cooler than those at the same latitude in the Atlantic. This reduces the evaporation rate, and north Pacific waters have a lower salinity than those in the Atlantic. As we shall see in the next chapter, the density of seawater is particularly sensitive to salinity. The lower salinity of the north Pacific prevents the water from becoming sufficiently dense to sink to the ocean floor.