5 The tides
We give the name the tide to the regular rise and fall of sea level caused by the gravitational pull on the ocean by the Moon and the Sun. The accurate prediction of tides, in the form of tables, is one of the great success stories of marine science. Knowing about the timing and level of high and low waters can be crucial for the safe navigation of large ships in and out of port and through shallow sea straits. The vertical movement of the sea is driven by horizontal currents, called tidal streams. There is increasing interest in extracting the energy contained in tidal streams and using it to provide electricity for industry and homes.
5.1 How the tide is formed
The tide is produced by small differences in the Moon’s (and to a lesser extent, the Sun’s) gravitational pull over the surface of the Earth. The Earth and Moon orbit once a month about their common centre of gravity, the barycentre. This orbiting motion produces centrifugal forces on the Earth analogous to those that cause a dancer’s pony tail to fly out as they are whirled around by their partner. The motion of the Earth about the barycentre is such that each point on the Earth goes around the same circular orbit in the same time. The centrifugal force is therefore the same at all points on, and in, the Earth (blue arrows in Figure 5.1). Now, these centrifugal forces are balanced on average by the Moon’s gravitational pull and this stops the Earth and Moon flying apart. In fact, the Moon’s gravitational pull exactly balances the centrifugal force at the centre of the Earth and this is sufficient to keep the solid body of the Earth in the correct motion about the barycentre. But, as with all heavenly bodies, the gravitational pull of the Moon diminishes inversely as the square of its distance. The Moon’s gravitational pull therefore gets less as you move over the surface of the Earth in a direction away from the Moon (solid black arrows in Figure 5.1). This produces local imbalances between the Moon’s gravity and the centrifugal forces, and these imbalances are represented by the red arrows in Figure 5.1. It is these small differences between the Moon’s pull and the centrifugal forces (called the tide generating forces) that create the tide in the ocean.
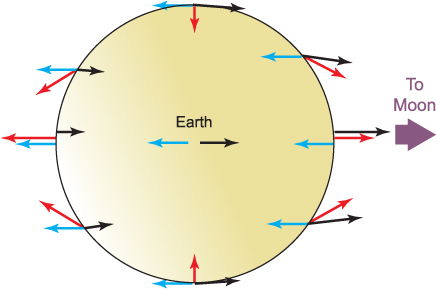
Figure 5.1 The origin of the Tide Generating Force. Centrifugal forces arising from the Earth’s orbital motion about the common centre of gravity of the Earth and Moon (the barycentre) are shown as blue arrows. These point away from the Moon and are the same size at all points on and within the Earth. The Moon’s gravitational attraction is shown as black arrows. This exactly balances the centrifugal force at the centre of the Earth. At most other points there is a small imbalance between the Moon’s gravitational pull and the centrifugal force. It is this small imbalance which is the tide generating force. In this figure, this force is shown as red arrows, which have been exaggerated in size for clarity.
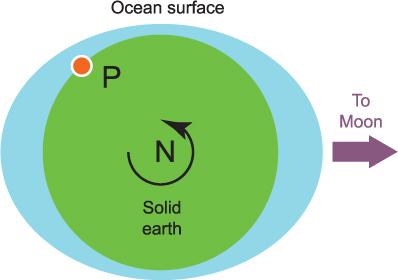
Figure 5.2 If the Earth were covered in an ocean, the tide generating forces would tend to pull the ocean into the shape of a rugby ball, with points facing towards and away from the Moon. In this view, we are looking at the Earth from above the North Pole. As the Earth turns, a point P will experience two high waters each day, one when the Moon is directly overhead, the other when the Moon is directly under foot.
If the Earth were covered in an ocean, it is possible to imagine that the red forces shown in Figure 5.1 would pull the ocean into a bulge directly below the Moon, and another bulge on the opposite side of the Earth to the Moon. That is, the ocean will take on the shape of a rugby ball with the points in line with the Moon (Figure 5.2). As the Earth rotates within this ocean, a high tide will be experienced when the Moon is most directly overhead (called the Moon’s transit) and another when the Moon is most directly under foot. It is possible to calculate the size of the bulges expected from gravitational theory – they are about 0.5 m. So the sea level will go up and down by about 0.5 m twice a day. In fact, the time for two high tides will be slightly longer than a day because, in the time it takes for the Earth to turn once, the Moon moves a little in its orbit and the Earth has to rotate a little more to catch up with this movement. In 24 hours, the Moon moves about 1/30th of the way around its orbit and it takes 1/30th of a day – about 50 minutes – for the Earth to catch up. The time for two complete high waters is therefore 24 hours and 50 minutes. High waters are therefore separated by 12 hours and 25 minutes.
The account given above is a summary of the equilibrium theory of the tide proposed by the English scientist Isaac Newton. In addition to the tides produced by the Moon, the motion of the Earth about the Sun also produces tidal forces. These are somewhat weaker (by a factor of 0.46) than those of the Moon but they produce important modulations in the strength of the tide generating force. When the Sun, Earth and Moon are in line (at new and full moon) the tide generating forces are at their maximum. When the Sun and Moon make an angle of 90° with the Earth, the tide generating forces are at their minimum.
The tides of Europa
The tide generating force depends on the mass and distance of the object which is producing it. It can be shown that the force varies inversely as the cube of the distance to the object. Note that this is different to gravitational forces which vary inversely as the square of the distance. Tidal forces represent the rate of change of gravity with distance and change with (distance)–3. For this reason, tidal forces increase rapidly as the distance to the object shortens. Tide generating forces are therefore particularly large on moons orbiting close to large planets such as Jupiter and Saturn. Europa is the sixth moon of Jupiter and a little smaller than our own moon. It is covered in ice, but evidence has been accumulating for a number of years that below the surface of the ice there is an ocean of salt water. The effect of tidal forces grinding the ice and, through the friction generated in this way, warming the interior may be enough to maintain liquid water on this otherwise frozen moon. There is also evidence that cracks may form in the surface of the ice, allowing sunlight into the liquid water. If so, that could drive photo-synthesis. The tidal forces on Europa therefore offer one of the best chances in the solar system of extra-terrestrial life.
Newton was aware of the weaknesses of his equilibrium theory. It requires an earth which is covered in an ocean, which is clearly not the case. Also it requires the Earth to turn slowly enough that it does not disrupt the tidal bulges. This is also not the case. The Earth spins too fast for the tidal bulges to retain their position in line with the Moon; we return to this point in section 5.3. Nevertheless, the equilibrium theory explains several of the most important features of the observed tide. This will be examined in the following section, followed by a discussion of how the discrepancies between the equilibrium theory and the real tide can be explained by considering the motion of the tide as a wave.
5.2 Observing the tide
The tide in the Earth’s oceans and seas can be measured directly by recording the level of the sea on a vertical surface such as that of a pole driven into the seabed or a harbour wall. Alternatively, a pressure sensor at a fixed point can be used to record the changes in pressure due to the rise and fall of sea level. Figure 5.3 shows a short series of measurements at Menai Bridge in North Wales. In this 24 hour period, there are two high tides and two low tides, the high tides separated by just over 12 hours. Locations where there are two high tides each day, which is the common situation, are said to experience a semi-diurnal tide.
Like most places, high water at Menai Bridge does not occur at the time of the Moon’s transit (that is the time the Moon is due south). In fact, here high water occurs about 10 hours after the Moon’s transit. The water surface elevation is measured relative to a fixed level or datum. In Figure 5.3, the elevation is expressed relative to chart datum. This is the lowest level that the water is likely to reach at this location in normal weather conditions. As the name implies, depths on nautical charts are expressed as the depth below chart datum; this means that the depths on charts are the least possible: normally, the tide will increase the depth above that shown on the chart.
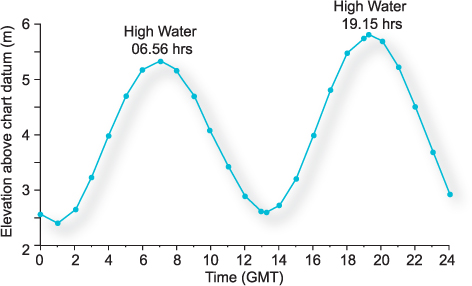
Figure 5.3 The tide at Menai Bridge in North Wales during a single day, showing the two high and two low waters in 24 hours that are characteristic of a semi-diurnal tide.
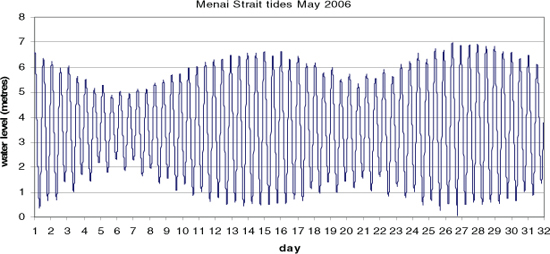
Figure 5.4 The tide at Menai Bridge over a period of a month, showing the changes in tidal range associated with spring and neap tides. Spring tides occur on the 14th and 27th of the month and neap tides on 6th and 20th.
The tidal range is the vertical distance between the lowest water level (or low water) and the high water in a tidal cycle. In Figure 5.3, the tidal range is about 3 m. At a given location, the tidal range changes from day to day in a fortnightly cycle. Figure 5.4 shows the variation in water level at Menai Bridge over a month. The periods of largest tidal range are called spring tides and they occur at or shortly after the times of new or full moon. The times of lowest tidal range, called neap tides, occur at about the time of half moon. Notice that spring tides have the highest high waters and also the lowest low waters. The word ‘spring’ in the tidal context comes from the same Anglo-Saxon root as a spring in the ground, meaning an upwelling of water, rather than referring to the spring season.
The tidal range at a coastal location also varies with other rhythms. It is noticeable in Figure 5.4, for instance, that the range at the two periods of neap tides is not the same: the second neap tide in the month has a greater range than the first. This difference is caused by changes in the Earth–Moon distance. The lunar orbit is elliptical and when the Moon is closest to the Earth (perigee) the tide generating forces are greater than when it is at its furthest from Earth (apogee). The semi-diurnal tide is greatest when the Moon and Sun are in the plane of the Equator. In an extreme case, if the Moon were above the North Pole, it would produce no tide in the ocean at all. For this reason, the largest semi-diurnal tides of the year occur at spring tides at the equinoxes in March and September, particularly if the Moon is also in the plane of the Equator. Exceptionally large semi-diurnal tides occur when the Moon is at perigee and when both Moon and Sun lie in the plane of the Equator. This rarely happens exactly, but there are more frequent occasions when these conditions are nearly met. We are due to have exceptionally large tides next in March and September 2015.
The angle the Sun and Moon make with the plane of the Equator is called the solar (or lunar) declination. When the lunar declination is not zero, there are differences in the height of the two high waters in the day. This can be seen to some extent towards the end of the record in Figure 5.4. The effect is called the diurnal inequality. The diurnal inequality is not great on the coasts of northern Europe, but can be marked in other parts of the world, notably the west coast of the United States and the north coast of Australia. In a relatively small number of locations, the diurnal inequality can grow to the extent that there is effectively just one high water and one low water in each day. Such locations are said to have a diurnal tide. The Gulf of Carpenteria on the north coast of Australia is an example of a place with diurnal tides.
5.3 The tide as a wave
In the picture described above, we have imagined that the bulges in the ocean shown in Figure 5.2 stay aligned with the Moon as the Earth turns. In fact the ocean bulges shown in this figure correspond to the crests of a wave stretched right around the circumference of the Earth. If the crests are to stay in line with the Moon, this wave must travel over the surface of the Earth at the same speed as the Earth rotates. At the Equator, the speed of Earth rotation is over 1610 km h–1 and waves in the ocean cannot travel this fast. Furthermore, the presence of continents will stop the continuous movement of waves right around the world everywhere except in the southern ocean.
As the Earth turns, the tide generating force pushes the water in the ocean first one way then the other, each ‘push’ lasting for a little over 6 hours. It is actually only the horizontal component of the force that is important in this regard; the vertical component can be neglected in comparison to the Earth’s own gravity – see Figure 5.5. This regular pushing creates waves in the ocean that have the same period as that of the tidal forcing – 12 hours and 25 minutes (also known as 12 lunar hours) for the semi-diurnal tide. The speed of the waves depends on the depth of water in which they are travelling. The wavelength is long compared to the depth of the ocean, and so they travel at a speed equal to √(gD) where g is the acceleration due to gravity and D the water depth.
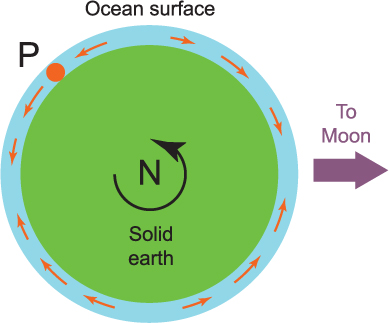
Figure 5.5 Illustrating the horizontal component of the tide generating force, called the tractive force, as orange arrows. The view of the Earth is from above the North Pole with the Moon over the Equator. As the Earth turns, the tractive force pushes the water of the ocean first one way and then the other, creating a wave.
The tidal waves in the ocean are produced directly by the tide generating force. Shelf seas are generally too small to feel the effect of the tidal forces directly. Instead, the rise and fall of the ocean sends waves (with tidal period) travelling from the shelf edge towards the coast. The speed and wavelength of these waves just depends on the water depth. For example, in a shelf sea of depth 100 m, the speed of the wave is 113 km h–1 and the wavelength over 1400 km.
Figure 5.6 shows such a tidal wave progressing along a coastline. High water occurs when the crest of the wave arrives at a point on the coast. In these long progressive waves, the currents flow with the wave underneath the crest and against the direction of wave travel under the trough. The effect of earth rotation is to deflect the currents to the right in the northern hemisphere. The water is piled up on the right hand shore of the canal at the crest and at the left hand shore at the trough (Figure 5.7). This piling up then creates a pressure gradient that acts to balance the Coriolis force. The wave is in geostrophic balance, as we discussed in Chapter 4. The overall effect on the wave is that it now has a greater amplitude on the right shore of the canal than on the left, as we look down the canal in the direction the wave is travelling. Such a wave is called a Kelvin wave named after the Scottish physicist, Lord Kelvin.
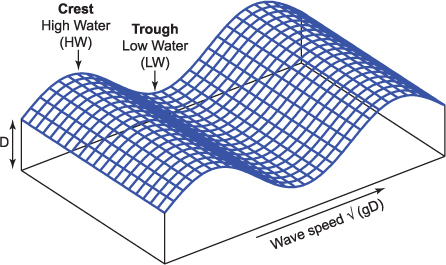
Figure 5.6 Sketch illustrating a progressive tidal wave. High water (HW) is at the crest of the wave and low water (LW) at the trough. The crest of the wave is travelling from left to right at the wave phase speed √(gD) where g is the acceleration due to gravity and D the water depth. Maximum currents flow in the direction of wave travel at high water and in the opposite direction at low water.
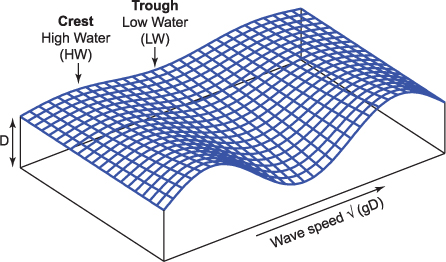
Figure 5.7 A Kelvin wave in the northern hemisphere. The wave is travelling from left to right. Beneath the crest, where the water is flowing with the wave, the Coriolis effect pushes water towards the right and the height of the high water increases in this direction. Below the trough, the current is flowing against the direction of wave travel. The Coriolis effect pushes water to the right of the current and the height of the low tide increases in this direction. The result is a wave that has a greater tidal range on the right hand shore looking down the direction of travel.
You might wonder why wind waves in a regular-sized canal (such as used by narrow boats) don’t have a greater amplitude on one side of the canal. The reason is that the Coriolis effect is really only observable in motions that last long enough for the effect of Earth rotation to matter. Waves in a narrowboat canal have a period of a few seconds, and the Earth doesn’t turn very far in a few seconds. Semi-diurnal tidal waves have a period of about 12 hours, and they respond to the effect of the Earth’s spin.
5.4 Co-tidal charts
A co-tidal chart is a good way of showing the wave-like behaviour of the tide. On it are plotted co-tidal lines, which join places where high water occurs at the same time, and co-range lines, which join places that have the same tidal range. In the case of a progressive wave travelling down a channel, for instance, the co-tidal lines will be a series of parallels, marking the progressively later time of arrival of the high water with distance down the channel. In places where the wave is travelling fast the lines will be well spaced, and they will be close together where the wave slows down. If the wave is a Kelvin wave, the co-range lines will show a reduction of tidal range from one shore of the channel to the other.
As an illustration, Figure 5.8 shows a co-tidal chart for the semi-diurnal tide in the Irish Sea. A tidal wave enters the Irish Sea through its southern entrance and travels up the channel between Wales and Ireland. The tide here behaves as a progressive wave, taking four hours to travel from the south to the north of Wales. The effect of Earth rotation on the wave can clearly be seen: i.e. the tidal range at Aberdovey on the Welsh coast is more than three times greater than that at Arklow at the opposite place on the irish coast.
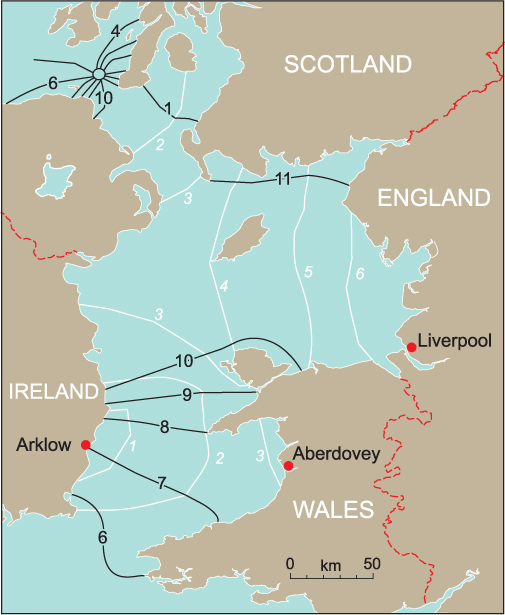
Figure 5.8 Co-tidal chart for the main lunar semi-diurnal tide in the Irish Sea. Along each co-tidal line (shown as continuous black lines) high water occurs at the same time. Times marked on co-tidal lines show the time of high water in hours after the Moon’s transit at Greenwich. Along each co-range line (shown as dashed red lines) the tidal range is the same. Ranges are marked in metres.
In the northern part of the Irish Sea, the co-tidal lines disappear and the tidal range continues to increase towards Liverpool and the English coast. High water occurs throughout much of the northern Irish Sea at the same time (give or take half an hour). The reason why this happens is that the progressive wave travelling up between Wales and Ireland reflects off the English coast and bounces back into the Irish Sea. The tides in the northern Irish Sea are then the sum of the incoming and reflected waves. When two waves travelling in opposite directions add together, they create a type of wave called a standing wave.
5.5 Standing waves
Consider a wave travelling into the gulf shown in Figure 5.9 and being reflected without loss of energy at the head of the gulf. The gulf will then contain two equal-sized waves travelling in opposite directions, and the shape of the water surface (and the currents) at any time will be the sum of that in the two waves. At a location one quarter of a wavelength from the head of the gulf a nodal line is formed. Along this line the vertical motion of the two waves always cancels each other – it is high tide for one wave when it is low tide for the other and vice versa. There is therefore no vertical tide along the nodal line. On one side of the nodal line it is low water when it is high water on the other side, and vice versa. Moving away from the nodal line, the tidal range increases (Figure 5.9B).
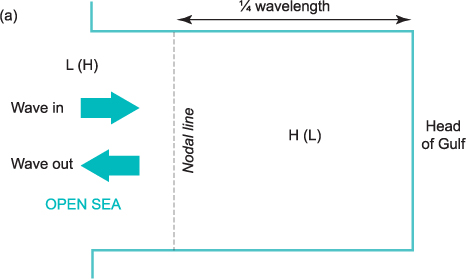
Figure 5.9 (A) Illustration of the formation of a standing wave in a gulf connected to the open sea: view from above.
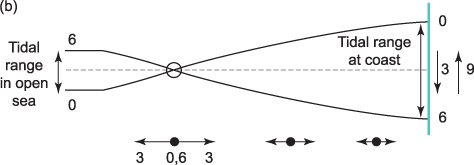
Figure 5.9 (B) Illustration of the formation of a standing wave in a gulf connected to the open sea: side view. A wave enters the gulf from the open sea, is reflected from the head of the gulf and travels back out again. The two waves add to form a standing wave with a nodal line (along which there is no tide) located one quarter wavelength from the head of the gulf. On one side of the nodal line it is high water when it is low water on the other side and vice versa. Considerable amplification of the tidal range at the coast can result if the nodal line is located close to the boundary between the gulf and the open sea. The numbers 0, 3, 6, 9 in the lower figure refer to hours during the tidal cycle
The currents in the two waves also add at the nodal line, but in this case they reinforce each other so that the nodal line is a place of fast currents. The maximum speed of the currents decreases with distance from the nodal line. The cycle then proceeds as follows. At lunar hour 0 (let’s say) it is high tide at the head of the gulf and the current is everywhere zero. At hour 3, the water is flowing at its fastest away from the head of the gulf through the nodal line and the water level is falling at the head of the gulf. At hour 6 it is low water at the head of the gulf and the currents are slack again. At hour 9, the current flows at its fastest towards the head of the gulf and the water level there is rising. The motion is analogous to the sloshing wave that can be created in a bath by moving a hand back and forth. It is high water at one end of the bath when it is low water at the other and vice versa. In between, when the water level is the same at the two ends, the water is flowing at its fastest from one end to the other.
Where the gulf joins the ocean, the tidal range must match that of the ocean tide (Figure 5.9B). If the nodal line lies close to this junction, it means that the tidal range at the head of the gulf will be much greater than that in the ocean. This effect amplifies the tide in coastal seas, so that a small tidal range in the ocean can become a much larger range at the coast. The sea is said to be in resonance with the applied forcing: a small force, applied regularly at just the right time, produces a large response. The equivalent in the bathtub is that, if the forcing is timed just right, the water can be sloshed out of the bath.
In order to achieve a large amplification in the illustration of Figure 5.9, the gulf should be close to ¼ wavelength from head to mouth. Since the wavelength of the tide in the gulf just depends on the depth of water, resonance will occur for particular values of water depth and gulf length (or width of shelf sea from shelf edge to coast). Places with large tidal ranges, such as the Bay of Fundy in Canada, have these critical values. We have drawn Figure 5.9 for a gulf which is just over ¼ wavelength long, but resonance can also occur in gulfs which have a length equivalent to ¾ or 1¼ tidal wavelengths. The North Sea, for example, is a gulf which is approximately 1¼ tidal wavelengths long, and which has 3 nodal lines (at ¼, ¾ and 5/4 wavelengths from the coast).
5.6 Amphidromic systems
On a turning earth, the currents in the tidal wave respond to the Coriolis effect. When the water is flowing out of the gulf (at hour 3 in Figure 5.10) the Coriolis effect creates a slope in the water surface along the nodal line, so that it is no longer a line of no tide. The slope creates a pressure gradient that balances the Coriolis force, creating a geostrophic balance. The slope is upwards towards the right hand shore looking from the head of the gulf. It is therefore high tide on this shore (and low tide on the left hand shore) at hour 3. When the current is flowing into the gulf (at hour 9) the Coriolis effect reverses the slope so that it is high tide on the left hand shore at hour 9. The water surface along the nodal line slopes one way and then the other, like a see-saw. Only the central point of the nodal line remains a place with no tide (it is equivalent to the fulcrum of the see-saw). The point of no tide is called an amphidromic point. The tidal wave appears to swirl around this point in an anticlockwise direction in the northern hemisphere, rather like the way that you can swirl a wave around the edge of a teacup. The wave sweeping anticlockwise around the nodal point is called an amphidromic system. The tidal range increases (and the tidal currents decrease) away from the amphidromic point.
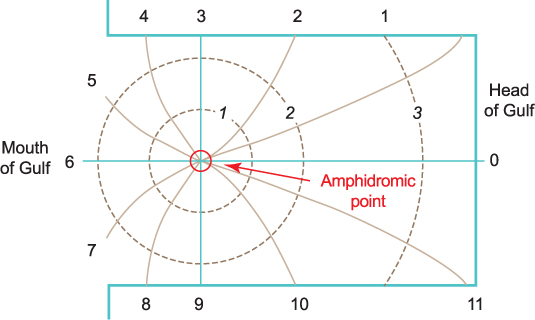
Figure 5.10 Co-tidal chart for an amphidromic system in the northern hemisphere. Co-tidal lines are continuous, with times of high water marked in lunar hours (high water at the head of the gulf occurs at hour 0). Dashed lines are co-range lines. Earth rotation effects turn the no-tide nodal line into a single no-tide amphidromic point about which the tidal wave turns in an anticlockwise sense. The tidal ranges increase (and the tidal currents decrease) with distance from the amphidromic point.
Friction between the tidal currents and the seabed reduces the energy in the tidal waves, and this means that the wave height (or in this case tidal range) becomes less as it travels along. The effect of friction on an amphidromic system is to move the amphidromic point along the nodal line towards the left-hand shore looking into the gulf. In the southern Irish Sea, frictional effects are so great that the reflected wave has decayed away to virtually nothing, and the tide here behaves essentially as an incoming Kelvin wave modified to some extent by a weak reflected wave. The modification can be seen in the fact that the co-tidal lines are converging on a point that lies on dry land in Ireland. We can imagine that the amphidromic point has been moved so far to the left that it is no longer within the sea (it is called a degenerate amphidrome). A second tidal wave enters the Irish Sea through the North Channel between Ireland and Scotland. This reflects off the English coast and forms a standing wave in the northern half of the Irish Sea. Frictional effects are apparently not so great in the case of this wave, and an amphidromic point is formed in the North Channel.
5.7 Predicting tides
Tide tables, showing the times and heights of high and low water for important coastal towns, appear in daily newspapers and on the internet and are a vital aid for coastal navigation. The science of predicting tides is based on a curve fitting technique. Observations of water level are made at a port for a length of time: this needs to be a year or more to produce the most accurate tide tables. A number of sinusoidal curves with a fixed period – called tidal harmonics – are then fitted to this data. The period of these harmonics is set by the motion of the Earth, Moon and Sun. For example, an important harmonic, called the main lunar semi-diurnal harmonic, has a period of 12 hours and 25 minutes. Other harmonics express the Sun’s tide and the changes in the distance and declination of the Moon and Sun. The amplitude and phase of these harmonics is adjusted mathematically so that when they are added up they give the best possible fit to the observations. These best-fit amplitudes and phases are fixed for a given place and are called the tidal constants. Once they have been determined, each of the harmonics can be plotted for any day in the future; they can be added together and the times and levels of high and low tide determined.
Tide tables are available for many places, but not everywhere. If you want to make your own tide tables for one of the places not covered, you can do so by determining the time difference between high water at your chosen location and that at a nearby port where tide tables are available. This tidal correction should be fairly constant as long as the port is not too far away. You can also apply a correction to the tidal range.
The modern method of tidal prediction requires mathematical analysis, which is easily done on modern computers. Historically, accurate tidal tables were produced for important ports such as Liverpool and Bristol long before computers were available. The makers of these tables (for example, the Holden brothers in the case of Liverpool) refused to reveal their methods, taking their secrets to the grave. It seems likely, however, that their method was based on the equilibrium tide with corrections to the time and height of high tide to bring them into line with observations.
5.8 Tidal streams and tidal energy
The horizontal movements of water associated with the tide are called tidal currents or tidal streams. Near the shore, or in an estuary, the flow of water towards the land is called the flood, and the flow of water away from the land the ebb. Tidal streams can be very fast, up to several knots, but they don’t flow for very long in a given direction. In a symmetrical tide, the flood and ebb will each last for 6 lunar hours, or 6 hours and 12 minutes.
There is currently great interest in developed countries in extracting some of the energy contained in tidal streams. The best places to do this are where the streams are at their fastest. An amphidromic point therefore makes a good place to put tidal stream power plants. Tidal streams are also influenced by local geography. For example, a narrow channel can have fast streams and they can also be fast close to a headland.
Turbines for generating usable energy from tidal streams need to be able to cope with the changing direction over a tidal cycle. The power that can be extracted depends on the cube of the tidal current speed, and so rises rapidly as the speed increases. Tidal stream energy is reliable and predictable. By placing a series of turbine farms at different places around the coast, peak generation can be achieved at different times of day to meet local demands.
Alternatively, tidal power can be extracted by using dams or barrages. The flood tide is allowed to freely enter a basin behind the barrage and then the water drains out through electricity-generating turbines when it is low tide in the open sea. The principal objection to tidal barrages, apart from high cost, is that they raise mean sea level within the barrage, thus flooding tidal flats that are important feeding grounds for birds.