7 Light in the oceans
Sunlight is important to life in the sea, as it is on land. Algae suspended in seawater and on the seabed use sunlight to photosynthesise and grow (see Chapter 10). In this chapter we examine the quantity and quality of sunlight that arrives at the sea surface and describe how it penetrates into the ocean.
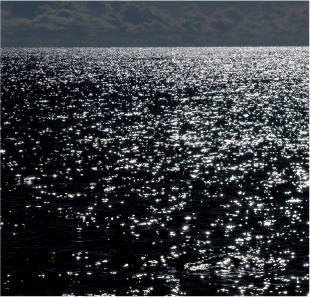
Figure 7.1 The penetration of sunlight into the ocean is critical for life.
7.1 Sunlight
Sunlight is part of the solar spectrum (Figure 7.2). A plot of the energy in solar radiation against wavelength peaks at a wavelength of about 500 nm. Visible light occupies the part of the spectrum around the peak – from 400 nm (blue light) to 700 nm (red light). This is also the part of the solar spectrum used in photosynthesis. For this reason, visible light is also called Photosynthetically Active Radiation (PAR). It is no coincidence that the most energetic part of solar radiation is called ‘visible light’ – our eyes have adapted to be sensitive to the part of the solar spectrum that has the most energy. However, it is a coincidence that the ocean is most transparent to visible light. Figure 7.1 also shows the percentage of solar energy that is transmitted without loss through 1 m of clearest seawater. It can be seen that the peak in solar energy and the peak in water clarity are nearly coincident. It is only visible light (and part of the ultraviolet) that is transmitted through seawater to any significant depth. This is a very fortunate coincidence for life in the ocean.
Sunlight can be measured as the amount of energy falling on unit surface area in unit time – a quantity called irradiance. The units of energy are Joules, and so we can measure irradiance in J m–2 s–1 or Watts m–2, since 1 Watt (the unit of power) equals 1 Joule per second. The irradiance, at all wavelengths, arriving at the top of the atmosphere has been measured as (about) 1400 W m–2, a figure called the solar constant. At ground level, the irradiance can approach this value at the Equator at noon. At other latitudes, the maximum irradiance at midday is generally much less. For example, Figure 7.3 shows that the total solar energy arriving at a weather station on Snowdon, a mountain in North Wales, on a clear day in September peaks at a value of about 600 W m–2 at noon.
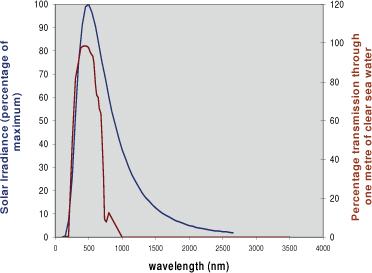
Figure 7.2 The solar spectrum. The blue curve shows the energy in sunlight plotted against wavelength, and the brown curve the transmission through seawater as a function of wavelength.
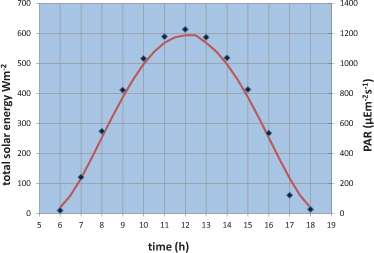
Figure 7.3 Solar irradiance at the summit of Snowdon in North Wales on a sunny day in September. Hourly values are shown as both total solar energy and as a photon count. The continuous curve is a theoretical prediction for the same day based on the solar constant and the changing elevation of the sun through the day.
In biological oceanography, it is more common to express the solar irradiance in terms of a photon count. Photons are tiny bundles of visible light energy. A common unit for counting photons in the sea is the µEinstein (or µE), which is 6 x 10¹⁷ (or one µmole) of photons. As an approximate guide, 100 Joules of total solar energy contains about 200 µE of photons. We can use this rule of thumb to convert between these physical and biological measures of solar energy. Figure 7.2 shows the light energy expressed in both these units, using the 2:1 conversion ratio. Photons are counted per unit area, per unit of time and so the commonly used terms are µmol photons m–2s–1, or µE m–2s–1
Solar irradiance varies through the year with the seasons. Figure 7.4 shows the seasonal variation of daily mean irradiance measured at Dunstaffnage in Scotland, from which it can be seen that, at this location, the mean irradiance varies by a factor of about 8 between winter and summer. This is mostly due to the much longer days at this latitude in summer. At lower latitudes, the shape of the seasonal curve is flatter, and at higher latitudes it becomes more peaked, with daily mean irradiance falling to zero in winter inside the Arctic and Antarctic circles.
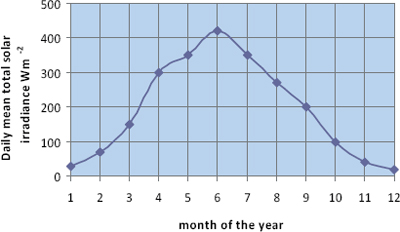
Figure 7.4 Variation of daily mean solar irradiance through the year at Dunstaffnage in Scotland.
7.2 Penetration of sunlight into the sea
The decrease of solar energy with depth in the ocean can be measured with underwater light meters, the most common form of which is called an irradiance meter (Figure 7.5). Seawater is in general rather opaque to sunlight, compared to the atmosphere. In cloudless conditions, sunlight travels through the Earth’s atmosphere to ground level virtually undiminished. Even in the clearest ocean waters, amounts of sunlight utilisable by photosynthetic organisms rarely penetrate to depths greater than100 m, and in coastal waters this figure can be less than 10 m.
Figure 7.6 shows an example of measurements of PAR irradiance at different depths at a station in the Clyde Sea in Scotland. The decrease of irradiance with depth, initially rapid and then slower, is characteristic of an exponential curve in which the rate of change of irradiance at any depth is proportional to the irradiance at that depth. The relationship between the irradiance E at depth z and irradiance at the surface E0 can be expressed mathematically by the Lambert-Beer Law: E = E0e–kz
The parameter k, which has units of m–1, is called the diffuse attenuation coefficient. The higher the value of k, the more opaque is the water. For a measured set of irradiance values at different depths, such as that shown in Figure 7.6, the diffuse attenuation coefficient can be calculated by fitting the Lambert-Beer law to the data. This is most easily done by plotting the natural logarithm of the irradiance against the depth, which produces a straightline relationship with a slope equal to -k. For the data in Figure 7.6 it can be shown in this way that k = 0.14 m–1. This value is typical of the PAR (or white light) diffuse attenuation coefficient in shelf seas. In clear ocean water, k is much smaller and in turbid water it is greater. For comparison, the attenuation coefficient of visible light in a clear atmosphere is about 0.00001 m–1.

Figure 7.5 (A) small irradiance sensor designed to measure visible light (or PAR) at different depths under water.
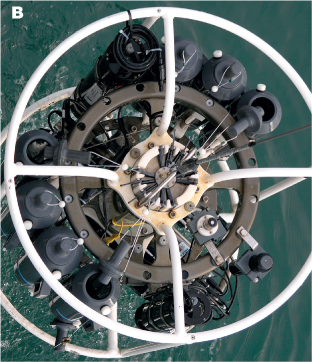
Figure 7.5 (B) A sensor attached to the CTD rosette to measure the downwelling light at the same time as the temperature and salinity profiles are being made. Another type of light meter (shaped like a light bulb) can be seen on the apparatus in Figure 1.3a. The difference between the two is that this one measures the light falling on it from above, whereas the ‘light bulb’ shaped one measures light coming from all around it.

Figure 7.6 Typical decrease in irradiance with depth in coastal waters.
The attenuation coefficient in the sea varies with wavelength. Clear ocean water absorbs red light principally and blue light least. As a result there is very little red light at depth in clear ocean water. Red objects under water appear black because there is no red light to reflect off them. Phytoplankton in ocean waters absorb blue light as well as red, and so move the minimum attenuation towards the green. This effect becomes even more apparent in shelf seas where dissolved organic material and suspended mineral particles (or mud) are also effective absorbers of blue light.
Physical basis for the exponential decay of light in the sea
The Lambert-beer Law is consistent with a photon having a set probability of traversing a given path length without being absorbed by the medium through which it is travelling. For example, supposing that the chance of a photon being absorbed in travelling 1 metre vertically down into the sea is 0.5. Imagine we start with 100 photons travelling down through the sea surface. Then, at a depth of 1 m, 50 photons will remain, the other 50 photons having been absorbed in the top metre of the sea. At a depth of 2 m there will be just 25 photons left, at 3 m 13 (since half a photon is impossible) and so on. This decrease in the number of photons, from 100 to 50 to 25 and then 13, which is at first rapid and then slower, is an exponential decay.
The physical process that removes photons as they travel down into the ocean is absorption. In this process, the photon hits a particle or a molecule and its light energy is converted into another form of energy. For example, the photon’s energy may be used to warm the water or it might be used to drive photosynthesis in a phytoplankton cell. There is another process which affects light travelling down into the sea, and that is scattering. Scattering will change a vertical beam of light entering the sea into diffuse light, in which the photons are travelling in all directions, mostly still downwards but not in parallel lines. In diffuse light the average distance a photon travels in reaching a given depth in the sea is greater than that for a beam of light. For this reason, scattering increases the diffuse attenuation coefficient. A small proportion (typically a few per cent) of the light is scattered at more than 90° and travels back up to the ocean surface. It is this back-scattered light, when it enters our eyes, that gives the water its colour (see section 7.5).
The depth to which 1% of the incident light is able to penetrate is called the photic zone. We can use the Lambert-Beer Law to show that the depth of the photic zone in this case is equal to 4.6/k. As we might expect, as the attenuation coefficient increases, the thickness of the photic zone decreases. For example, an attenuation coefficient of 0.14 m–1 is associated with a photic zone extending down to 33 m. An attenuation coefficient of 0.3 m–1 would produce a photic zone with a thickness of just 15 m.
7.3 Other ways to measure water transparency
A surprisingly good estimate of the transparency of seawater can be obtained by lowering a white disc into the water and noting the depth at which it just disappears (purists will tell you to go beyond this depth and then note the depth of reappearance as you slowly pull the disc back up). The rope used for lowering can be marked with tape at convenient intervals to help you determine the depth of the disc below the surface. Such a piece of apparatus is called a Secchi disc (see Figure 7.7) and the depth at which the disc disappears (or reappears) is called the Secchi depth.
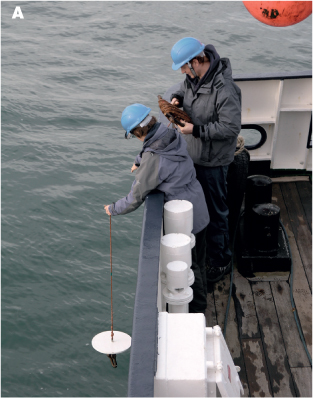
Figure 7.7 (A) The Sechhi disc is a simple way of measuring the transparency of seawater.

Figure 7.7 (B) It is lowered into the sea, and the depth at which it disappears (the Secchi depth) is noted.
As you might expect, there is a relationship between the Secchi depth and the diffuse attenuation coefficient (see Figure 7.8). The relationship is an inverse one, since Secchi depth increases as k decreases and the water becomes more transparent. The relationship between Secchi depth and diffuse attenuation coefficient shown in Figure 7.7 can be expressed as:
k = 1.4/Zsd
where Zsd is the Secchi depth in metres. Other studies give slightly different values for the numerical constant in this equation (it has been suggested that the value of this figure depends on the relative importance of light scattering and absorption in seawater). If we take 1.4 as a working figure and remember that the depth of the photic zone is 4.6/k it follows that the depth of the photic zone is just over three times the Secchi depth. The greatest Secchi depth to be published is 80 m! It was measured in the Weddell Sea, Antarctica in October 1986 (i.e. at end of winter when no phytoplankton were in the water). On this occasion the photic depth was around 240 m. Red seaweeds have been found growing attached to rocks at 268 m in waters off the Bahamas, which indicates that the photic zone has extended down that far. However, these are extreme maxima, and it is generally considered that even in the clearest waters the photic zone does not extend much deeper than 200 m.
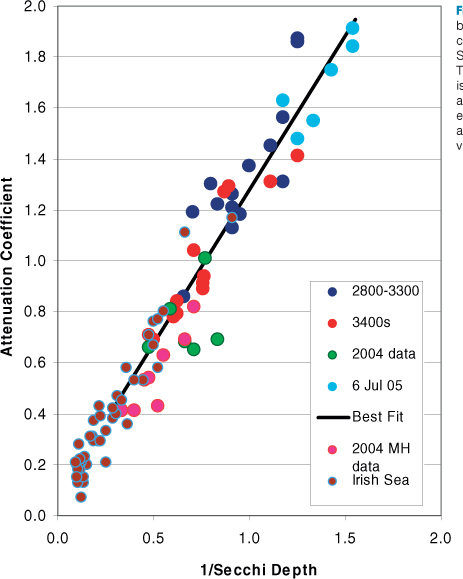
Figure 7.8 The relationship between the attenuation coefficient for white light and the Secchi depth is an inverse one. This diagram shows that there is a good relationship between attenuation and 1/Secchi (both expressed in m-1) depth over a wide range of water clarity values in uropean waters.
A useful instrument for studying the variation of water transparency with depth is the beam transmissometer. This instrument has a light source from which light travels in a parallel beam through the water to a light detector some distance (typically a few tens of centimetres) away. Particles in the water scatter light out of the beam and so reduce the signal reaching the detector. The ratio of the measured signal to that measured in perfectly clear water is called the beam transmittance. Profiles of beam transmittance can be used to study how sediments are suspended from the sea floor. Beam transmissometers can also be placed on moorings to provide information on changes in suspended load with the ebb and flow of tidal currents – useful information for studies of sediment transport.
7.4 The colour of the sea
The colour of the sea, viewed from above, varies from the beautiful deep blue of clear ocean water, through the emerald green of shelf seas to the muddy brown colour of shallow turbid estuaries and coastal water. When viewing the true colour of the sea, it is important not to be confused by the reflection of the sky by the sea surface. This is often what you see when you stand on a cliff and look out to sea, viewing the sea surface at a low angle. The best way to cut out the surface reflection and to view the true colour of the sea is to place one end of a tube just below the water surface and to look down the other end of the tube (Figure 7.9).
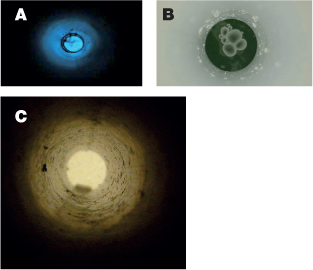
Figure 7.9 Photo of sea water taken down tubes in (A) clear blue ocean water; (B) phytoplankton rich green water and (C) muddy brown coastal water.
The blue colour of clear ocean water is caused by a fundamentally different mechanism to that of the sky. In the atmosphere, light is scattered primarily by air molecules, which are much smaller than the wavelength of light. In this case, a scattering process explored by the English physicist Lord Rayleigh applies. Blue photons are scattered more readily than those of other colours, and this is what gives the sky its blue colour. In the ocean, scattering of light is caused primarily by suspended particles and inhomogeneities in the water, and the scattering process is more or less wavelength-independent. However, absorption of light in the sea does depend on wavelength. As photons travel into the sea, are backscattered and travel up again to the surface, the more strongly absorbed colours are filtered out, leaving just the most weakly absorbed photons to give the sea its colour. Pure water absorbs red light most strongly and blue light least. This is why clear ocean water has such a strong blue colour – the red and green colours have been removed from the light that is backscattered to the surface (Figure 7.9A).
If phytoplankton (Chapter 8) are abundant, blue light is absorbed as well as red (the chlorophyll pigment in phytoplankton and plants is a good absorber of blue and red light, which is why many plants are green). Phytoplankton living near the sea surface filter out blue light, and water continues to filter out red light, and so the spectrum of the upwelling irradiance at the sea surface shifts towards the green (Figure 7.9B). This is the basis of satellite remote sensing of phytoplankton biomass in the ocean. Satellites can measure irradiance of different colours leaving the ocean surface. The ratio of green to blue irradiance increases as the chlorophyll concentration in surface waters increases. By carefully calibrating the ‘blue/green ratio’ against measurements of chlorophyll in water samples, it is possible to convert satellite observations of ocean colour into maps of the phytoplankton distribution in the surface waters of the globe (Figure 7.10).

Figure 7.10 Ocean colour measured by satellite can be converted into a chlorophyll concentration, an indicator of algal biomass. This graph shows how chlorophyll in clear Scottish waters and in the Atlantic makes the water greener.
Figure 7.10 shows how, as chlorophyll increases in these waters, the ratio of blue to green reflection coefficients decreases, i.e. the water becomes less blue and more green. This has proved a very useful result for mapping chlorophyll in the world’s oceans (see chapter 10 and, in particular, figure 10.5). Unfortunately, the simple relationship shown in figure 7.10 breaks down in shelf seas and estuaries (the most biologically productive parts of the ocean) because here, materials other than chlorophyll can colour the water green, or even brown.
Shelf seas and estuaries contain materials, apart from phytoplankton, that absorb blue light most strongly. These materials include suspended minerals (or mud) and dissolved organic matter (DOM). The DOM is produced by the breakdown of living matter when it dies and decays, and much of the input of DOM into coastal waters is from rivers. These carry high loads of DOM produced originally from agricultural, forest and peat lands and the decay of plant material. A fraction of the DOM has a yellow to brown colour, and is referred to as coloured or chromophoric DOM (CDOM – see figure 7.11). In very turbid water, the absorption of blue and green light by the suspended and absorbed matter can predominate over the absorption of red light by the water itself. Photons that make it back to the sea surface after being scattered in the body of the water are now mostly green and red, with just a smattering of blue and the water appears a muddy brown colour (Figure 7.8C).
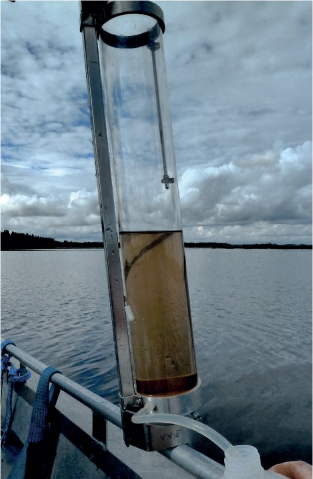
Figure 7.11 This sample of estuarine water contains a high concentration of CDOM producing a characteristic brown colouration.
The colour of water will depend, amongst other things, on the concentrations of plankton (mostly expressed as chlorophyll a concentration), CDOM and suspended mud in the water. It is also dependent on the optical properties of the water itself. The absorption coefficient of a material is defined as the proportion of light absorbed in travelling a short distance through the material, divided by that distance. It has units of m–1. The absorption coefficients of pure water, and water containing chlorophyll, CDOM and suspended mud particles are shown in Figure 7.12. Since the absorption coefficients of the non-water materials increase with their concentration, it is possible to use the absorption coefficients of water samples, at specific wavelengths, for estimating the concentrations of CDOM and other constituents in the water. This is often less time-consuming and less expensive than doing the chemical analyses directly.
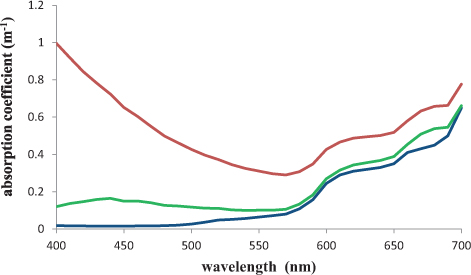
Figure 7.12 Absorption coefficient of pure water (blue); water containing chlorophyll a at levels typical of the spring bloom in coastal waters (green) and water containing coastal water levels of CDOM and suspended mud as well as chlorophyll a (red).