11 Ocean food webs
So far in this introduction, the biology has concentrated mostly on factors leading to producing phytoplankton growth. However, there is clearly much more in the oceans than microscopic unicellular algae and bacteria, and this chapter will consider how the energy trapped by the phytoplankton goes to fuel the various food webs that can ultimately give rise to animals as huge as the whales (Fig. 11.1).
11.1 Growth and food chain efficiency
Ultimately the growth of any organism is a result of the balance between the energy input and the energetic output for life to take place. Some energetic gains, investments, and losses of an organism as it grows include:
Material and energy gains: Photosynthesis (for algae); food intake (for animals);
Material investments: Creating new cells, tissues or skeleton formation, production of energy storage compounds and formation of reproductive material; and
Energy and material losses: Movement, buoyancy, feeding, excretion, water content regulation.
Naturally all this energy comes from the breakdown and respiration of the products from photosynthesis in algae, or the respiration of ingested food in other organisms. The efficiency by which the energy taken in is converted into growth is called the growth yield, and is normally somewhere between 10 and 30%. Clearly the amount an organism expends on moving will be a large factor in this. This ‘loss of energy’ or ‘inefficiency’ can also be used when considering the transfer efficiency of energy between organisms in a food chain. Even the process of feeding in itself can be a huge drain on energy. It has been estimated that Right Whales (Eubalaena glacialis) need to consume at least 4500 cope-pods m–3 to balance the energy they expend in feeding.

Figure 11.1 Whales in phytoplankton bloom – start to finish of food chain.
Many studies have shown that there is a strong positive relationship between the amount of phytoplankton and the total production of fish and squid. However, behind every tonne of fish landed a remarkable amount of phytoplankton production needs to occur: As can be seen from the example in Table 11.1, if the growth efficiency at each organism level is 10%, for every 10 g of the enormous fish there would have to be 1 tonne of phytoplankton to support it. Even if the efficiency were as high as 30%, 1 tonne of phytoplankton would still only ultimately produce 2.4 kg of the enormous fish. Scaled up to global terms, it has been estimated around 45 x 109 tonnes of phytoplankton are produced globally per year. In contrast, total fish production is probably less than 2 x 10⁸ tonnes per year.
This discussion illustrates why fish species, such as anchovies and sardines, that feed directly on phytoplankton are more productive and abundant than fish such as tuna and sharks that are at the top of a longer food chain, more akin to the example given in Table 11.1. The basic rule is that the shorter the food chain, the more efficient it is. For instance, humpback whales (Megaptera novaeangliae), which can weigh over 30 tonnes, feed on krill in the Southern Ocean and are therefore the top of a very efficient food chain: phytoplankton ⇒ krill ⇒ whale. Another efficient food chain producing a large organism at the end is that of the basking shark (Cetorhinus maximus) that can grow to over 10 m in length and weigh more than 4 tonnes, by eating only plankton.
Table 11.1 Example of how the yield and loss terms at each level of a food web interact to reduce the production (weight) of the final product. 1000 kg of phytoplankton are needed to ‘produce’ just 0.01 kg of the enormous fish.

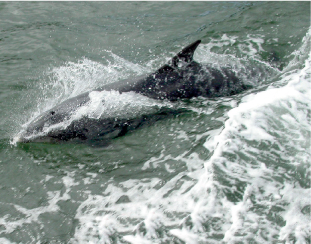
Figure 11.2 The energy expended in searching for prey can be quite considerable in the open ocean, very much reducing the growth yield of an organism.
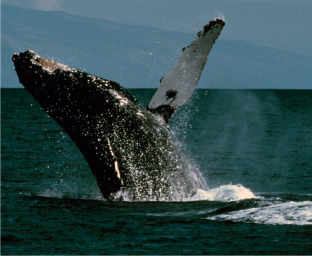
Figure 11.3 Humpback whales feed on zooplankton, and the food chain resulting in a whale is shorter than that of the dolphin shown in Figure 11.3, which eats fish as its main prey.
As another general rule, pelagic animals will eat organisms whole, and therefore the size of the mouth is key in determining the size of the prey that can be eaten. For this reason predators normally prey on food considerably smaller than themselves, although this is not true in the microbial world (see dinoflagellates in Chapter 8) and clearly not true of the basking shark! It has been estimated that fish prey on food that has a body mass >400 times lower than their own. This is why the animals at the top of the marine food chains tend to be bigger. Naturally, this discussion is only pertinent to omnivorous and carnivorous species.
Of course the normal situation is normally far more complicated that the straightforward food chains described here. Instead of chains, quite often there are complex food webs describing the transfer of energy through to the top predators. Figure 11.4 shows how complex things can really be.
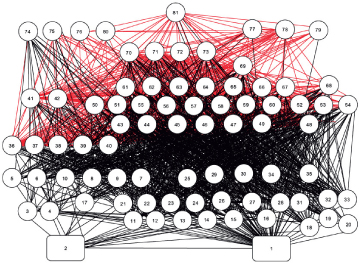
Figure 11.4 Some food webs can be incredibly complex, like this one that includes benthic and pelagic species making up the north-west Atlantic food web. 1 is detritus, 2 phytoplankton, 74 baleen whales, 75 toothed whales, 76 seals, 77 migratory scombrids, 78 migratory billfish, 80 birds and 81 humans.
Figure 11.5 Shows a more understandable food web for the North Sea herring, which shows that there are several ‘pathways’ by which energy gets grom the phytoplankton to the herring, although the most direct path is the short chain of phytoplankton ⇒ copepods ⇒ herring.
An important item missing from the picture in Figure 11.5 is the part of the food web known as the microbial loop. This is the pathway described in Chapter 9, where organic matter (both dissolved and particulate) produced by all levels in the food web is broken down by bacteria, a consequence of which is the regeneration of nutrients for new phytoplankton growth. This was largely overlooked until 30 years ago, but now receives considerable research attention, since ultimately it is this unseen part of the web that makes everything else possible.

Figure 11.5 Food web associated with the North Sea Herring.
11.2 What happens to the phytoplankton
In Chapter 10 the spring phytoplankton bloom was rather left drifting, and the consequences of it not followed up. The phytoplankton of the spring bloom are eaten by zooplankton and small nekton (like the sardines and anchovies). These can only grow once the phytoplankton have bloomed, and so there is normally a peak in zooplankton biomass following the peak in the phytoplankton bloom. Some species of copepods end their diapause (Chapter 8) in early spring before the phytoplankton bloom, migrating to the surface waters where they spawn, thereby ensuring that the young nauplii are in the surface waters to feed on the phytoplankton bloom when it starts. After the zooplankton numbers reach a maximum, predators such as fish larvae move in to feed, and subsequently larger predators feed on the fish larvae, and so on up the food chain (Fig. 11.5). It is not just the magnitude of the phytoplankton bloom that is important, but also the timing of it, since it is thought that blooms that occur early in the season may reduce the amount of fish larvae starvation and so ultimately influence the number of adult fish.

Figure 11.6 Seasonal development of thermocline and corresponding phytoplankton and zooplankton dynamics.
In conclusion to this section it is worth considering the so-called paradox of the plankton. It is normally accepted in ecology that when resources are limited (such as nutrients for the phytoplankton) and species are having to compete for them in a homogenous medium, a single species will end up dominating. However, in the plankton, despite the limited resources, there are many species coexisting, an apparent ecological paradox. The concept was introduced by G.E. Hutchinson in 1961 and has been debated long and hard by general ecologists and biological oceanographers ever since. It is beyond the scope of this introduction to join the debate, but clearly the complexity of biological (photosynthesis, EPS, nutrient acquisition, grazing) and non-biological (light, temperature, stratification, etc.) factors that go into determining the nature of planktonic life bring into question the idea of the plankton living in a homogenous medium.
11.3 Fueling the deep sea
All the organisms living below the photic zone are ultimately dependent on food coming down from above, if they cannot swim up to get it themselves. So clearly deep seas below highly productive surface waters have more food available than those beneath less productive waters. But even so, a proportion of the dead organisms from any surface layer never make it to deep waters. As discussed in Chapter 9, this is because they are broken down by bacteria. It is estimated that the flux of organic carbon reaching the sea floor in oligotrophic deep oceans is less than 3% of the surface primary production. Also the quality of the food changes as it sinks, since amino acids and proteins are used up faster than carbohydrates or lipids. Therefore, the material reaching the sea floor is relatively poor in terms of quality, unless it has been transported rapidly through the water with little chance for the bacteria to break it down.
Of course how long a particle takes to sink to deep waters depends on how quickly it sinks through the water column. Some diatom species, for example, have been measured as sinking between 0.1 and 10 m per day, although this naturally depends on the size and shape of the diatom, and it seems that older or dead diatoms sink faster than actively growing ones. So this means that it could take anywhere between 10 and 1000 days for the cells to settle through 100 m of water.
However, if sediment traps are placed in the water to collect the particles falling through the water column, a lot of the material is in the form of faecal pellets produced by zooplankton (Figure 11.7). These pellets are bound by thin membranes and contain the remains of phytoplankton and bacteria, and are effectively packages of organic matter measuring in diameter from a few to several hundred micrometres. The larger the grazer, the larger the faecal pellet, although not all faecal pellets are equally durable; e.g. krill pellets are somewhat fragile and break up rapidly, whereas pellets produced by many of the small copepod species are far more robust and long-lasting. Faecal pellets can sink through the water at fast rates, varying from around 50 to 200 m per day, and even rates of up to 1,500 m per day have been measured. The numbers of faecal pellets raining down can be impressive, especially in productive waters where large numbers of copepods have been feeding, reaching values of up to > 300,000 pellets m–2 day–1. Clearly such pellets greatly speed up the flux of organic matter from the photic zone to the deep sea.
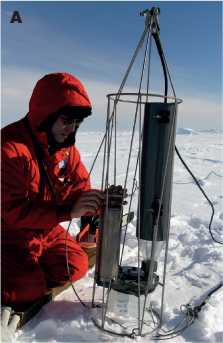
Figure 11.7 (A) Small sediment trap being deployed under an Antarctic ice floe. Note the bottles at the bottom of the trap, which were programmed to collect material for four days.
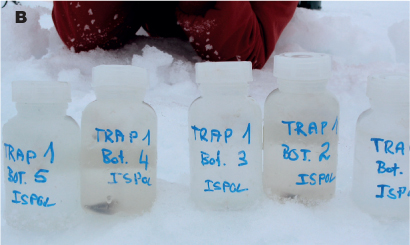
Figure 11.7 (B) The bottles after recovery of the trap showing the material that has collected in them.

Figure 11.8 Range of faecal pellets collected in a sediment trap deployed 400 m below the surface of the ocean.
Quite often the contents of sediment traps are in a sort of amorphous gel. This is because much of the particle flux down the water column falls as marine snow. In chapter 9, EPS was introduced; a sticky mucus-like substance produced by many phytoplankton and bacteria. This stuff can form clumps, and marine snow particles are accumulations of EPS often encasing numerous dead or dying phytoplankton cells, bacteria and remains of other plankton. The size of these marine snow agglomerations can range from the micrometre to centimetre size range, although in extreme cases monster particles with diameters up to metres have been seen. It is thought that marine snow is the main vector by which matter is transported to the deep sea.
The sinking material – marine snow, algal cells, bacteria and faecal pellets – that eventually makes it to the seafloor is collectively called phytodetritus. When there has been a massive fall of material, such as following an algal bloom, this material can form a loose, fluffy layer up to several centimetres deep on top of the sediments. This, of course, is a source of food for benthic suspension and deposit-feeding organisms. However, when the falls of phytodetritus are huge they can actually be a problem, since in general food supply is so poor that a sudden downfall of organic rich material can overwhelm organisms more accustomed to periods of austerity. Also, naturally bacterial activity is high in the rich organic soup like phytodetritus, which can consume considerable amounts of oxygen. If this is high enough it can lead to localised spots of suboxic or even anoxic sediments.

Figure 11. 9 Aggregate of marine snow approximately 5 mm in diameter. The aggregate based around an abandoned house of a larvacean (free-swimming filter feeder), with many phytoplankton and detrital particles on the filters. Such houses are a major source of marine snow in coastal and oceanic waters.

Figure 11.10 Phytodetrital layer (about 2.5 cm deep) on top of sediment core retrieved from the deep sea.
Of course not all particles sinking through the ocean are small, and dead fish and mammals also sink to the ocean floor. It is thought that a whale carcass can provide food for a large array of scavengers and other organisms for periods of decades or more. Of course a decaying whale carcass will be a massive hotspot for microbial activity as well. Naturally it is very difficult to witness a whale fall, but as more researchers are able to study the deep sea, it is clear that, although unpredictable, they are important sources of nutrition to an otherwise food restricted zone.
The transport of carbon as organic matter from the surface of the oceans to the deep sea is referred to as the biological pump, where it may be isolated from the atmosphere for hundreds or even thousands of years. Ultimately the material reaching the sea floor is incorporated in one form or another into the sediments, although, due to the microbial processes, only a tiny fraction of material reaching the depths is actually turned permanently into sediments (sequestered). Considering how slow sedimentation rates are, it is remarkable to contemplate the historical record that they represent, and this must be part of the fascination for marine geologists. However, the biological pump, which is ultimately what has been discussed in the past few chapters, is a way of transferring carbon from the atmosphere to burial in the sediments for potentially millions of years.
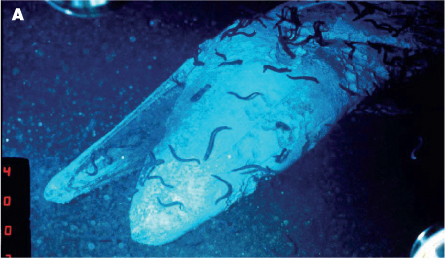
Figure 11.11 (A) Whale fall images. ‘Fresh’ carcass.

Figure 11.11 (B) Whale fall images. the remains of a carcass after several years.