14 Sampling the oceans
Edward Forbes (1815–1854) is often credited with being the founding father of oceanography. However, it was his successor to the Chair of Natural History at Edinburgh University, Charles Wyville Thomson (1830–1882), who had the vision for, and was the leader of, the Challenger Expedition (1872–1876), a remarkable voyage visiting all of the world’s oceans except the Arctic. This was arguably the first multidisciplinary oceanographic research expedition, and the resulting 50 volumes of final reports laid the foundations for modern day oceanography.
Modern day oceanographic cruises are just as much voyages of discovery. Marine scientists lower instruments into the ocean to measure change in water properties with depth. They deploy nets and water bottles and seabed grabs. Some instruments, such as current meters, can be left on moorings to record data for weeks, months or years, and increasingly our information about the ocean is gathered from satellites orbiting the earth.
14.1 Research vessels
Many nations operate a fleet of purpose-built research vessels. An example of a mediumsized ship, suitable for research cruises in shelf seas, is shown in Figure 14.1B. Scientists work in ‘watches’ around the clock, sleeping and eating on board, and research cruises can last anything from just a few days up to two or three months in more remote regions of the world’s oceans. For deep-ocean work, larger ships would be used (Figure 14.1A) and small survey boats (Figure 14.1C) are ideal for coastal work.
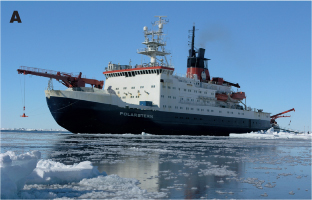
Figure 14.1 (A) Four types of research vessel: large and suitable for deep-ocean work.
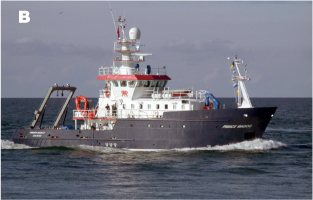
Figure 14.1 (B) Four types of research vessel: medium and suitable for shelf seas.
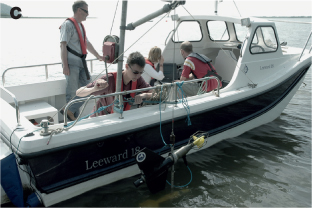
Figure 14.1 (C) Four types of research vessel: small and suitable for coastal and estuary studies.

Figure 14.1 (D) Four types of research vessel: improvised use of a fishing boat in the Philippines.
It is important to realise that research vessels generally operate for most of the year, and teams of scientists join the vessel only for periods of time. This means that the ship’s laboratories are largely empty and need to be set up at the beginning of each journey. This can be an arduous task, since space is of course limited, and there is often competition to get enough room. It is also important to have done your packing beforehand very carefully. There are no shops in the middle of the North Atlantic or Southern Ocean, and once the ship leaves port it could be several months before a harbour is visited again. It is remarkable how, in just a matter of hours, an empty room can be transformed into a high quality analytical laboratory (Figure 14.2), albeit with everything tied down to stop it falling off the benches in rough weather. It is even more remarkable because the scientists have to construct their new laboratories while still having to find their sea legs and maybe suffering from sea sickness, which is an occupational hazard for many.
14.2 Measuring water column structure
The workhorse of any oceanographic cruise is the Conductivity–Temperature–Depth probe (CTD; see Figure 14.2). This makes the basic measurements of water temperature and salinity at depth in the ocean. The CTD is lowered on a steel wire that has an electrical cable inside. The data from the instruments is transmitted up the cable to computers on board the ship. A CTD measures the electrical conductivity and temperature of the water and from these two properties, salinity can be calculated. Depth is determined from a pressure sensor in the CTD. Other instruments will normally be attached to the CTD ‘frame’. These are likely to include a fluorometer to measure chlorophyll fluorescence, and a transmissometer or optical backscatter sensor for water turbidity.
Figure 14.3A shows a CTD profile in a water depth of about 50 metres in the Irish Sea. The water column is well mixed: the temperature in blue, salinity in red, transmittance (a measure of water turbidity) in white and fluorescence in green are all the same from top to bottom of the profile. In a different part of the Irish Sea (Figure 14.3B) the profile is very different. There is a thermocline from the surface down to about 30 metres. The white transmittance profile shows clear water lying on top of more turbid water, and the green fluorescence profile shows a fluorescence peak around the bottom of the thermocline.
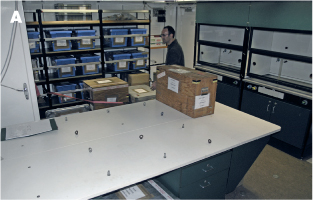
Figure 14.2 (A) Before and after setting up a laboratory on board a large research vessel.
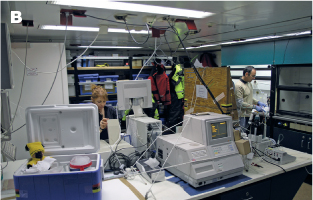
Figure 14.2 (B) Before and after setting up a laboratory on board a large research vessel.
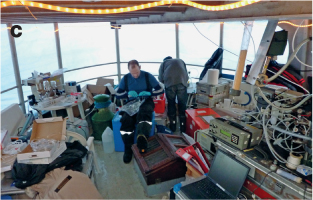
Figure 14.2 (C) Contrasts with the improvised laboratory on deck a small boat in Greenland where working temperatures never got above 5°C.

Figure 14.3 (A) Results of a CTD profile in vertically mixed water.
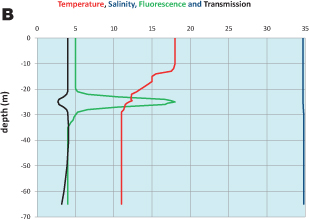
Figure 14.3 (B) Results of a CTD profile in stratified water. NB The scale for temperature is in degrees centigrade, and salinity in units of salinity. However, the fluorescence (measure of chlorophyll a) and transmission are in arbitrary units of voltage that are converted to actual values by the comparison of the readings against certified standards.
Water samples can be collected from depth in a ring of bottles, called a rosette sampler, surrounding the CTD (see Chapter 1). The bottles are cylinders with caps at the top and bottom. When the CTD goes into the water, the caps are open. The bottles are fired at chosen depths by sending an electrical signal down the CTD wire. This closes the caps, trapping a sample of water in each bottle. A number of samples can be collected at different depths, limited only by the number of bottles in the rosette.

Figure 14.4 A small undulating frame for towing behind a research vessel under way. The frame can be fitted with instruments such as a CTD and the pitch of the ‘wings’ adjusted such that the instrument ‘flies’ up and down in the wake of the ship.
Once back on board the water from the bottles can be decanted carefully for a range of analyses, and routinely these include salinity (to calibrate the CTD sensor), nutrients, dissolved gases, numbers of organisms and particles. The bottles are fine for collecting bacteria and phytoplankton, but other equipment has to be used for collecting zooplankton, larvae and nekton. If the water in the bottles is to be used for the analysis of trace elements such as dissolved iron, specially constructed and cleaned bottles have to be used, often coated with Teflon, and certainly not including steel pins, hinges etc.
In shallow water, a CTD profile may only take a few minutes, but in the ocean, in water kilometres deep, it can take several hours. Often a grid of stations will be worked so that the water column structure can be measured both vertically and horizontally. A CTD can also be towed behind the ship on a specially designed ‘towed undulator’ frame (Figure 14.4). The towed undulator is fitted with controllable fins so that it can be made to dive and surface behind the ship, so giving a continuous up and down profile of measurements in the ship’s wake.
14.3 Measuring water flow
An example of a recording current meter is shown in Figure 14.5A. The current meter has a vane which makes it line up with the current; a compass in the body of the instrument records the direction of the flow. The impellor turns in the current and the number of turns in a set interval of time is proportional to the current speed. A current meter like this one is battery operated. It is deployed at sea on a mooring at a fixed location, and so gives an Eulerian measurement of current. The traditional type of oceanographic mooring is U-shaped (Figure 14.5B). A sub-surface buoy, of sufficient size to support the instruments and the line holding them, is paid out over the side of the ship. The line (or riser) with the instruments attached is then paid out. There is no tension in the line as the instruments go into the sea, and so they can be lifted over the side by hand. The first ground weight is then lowered to the seabed by the ship’s winch and (if the lengths of line have been judged correctly) the sub-surface buoy will disappear below the water surface. The ship then steams slowly ahead while the ground line is paid out. Finally, the second ground weight, second riser and surface marker buoy go over the side. Recovery is the reverse of deployment, and so again there is no tension on the line when the instruments are brought aboard. U-moorings have the advantage that ships can pass over the sub-surface buoy without dragging the instruments away. An increasingly popular alternative is to use a single riser with an acoustically-operated release mechanism just below the ground weight. When the release is activated (by a coded signal) the sub-surface buoy is released and floats to the surface with the instruments dangling below.
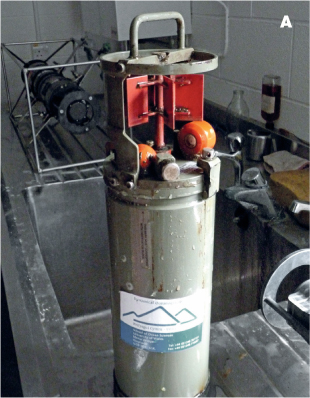
Figure 14.5 (A) A recording current meter.

Figure 14.5 (B) A schematic of a U-mooring, on which a recording current meter can be deployed to make continuous measurements of current speed and direction.
A number of current meters can be placed on the mooring at different heights above the seabed to measure the profile of the current – that is, the way the velocity changes with depth. Alternatively, a single acoustic Doppler current profiler can be used. Figure 14.6 shows an ADCP fixed in a frame which will be lowered to the seabed. This type of current meter sends pings of sound into the water. Some of the sound energy is scattered by particles in the water and returns to the ADCP as an echo. If the water is moving, the echo has a slightly different frequency (the Doppler shift) to the transmitted ping. The velocity of the water can be calculated from the Doppler shift. By collecting echoes from different heights, the profile of velocity above the bed-mounted ADCP can be constructed. Research vessels can also be equipped with hull-mounted downward-looking ADCPs to measure the velocity profile below the ship as she steams along. The ship’s speed needs to be subtracted from these measurements to give the true water velocity. If the water is shallow enough so that an echo is received from the sea floor, the ship’s speed can be calculated from the Doppler shift in this echo.
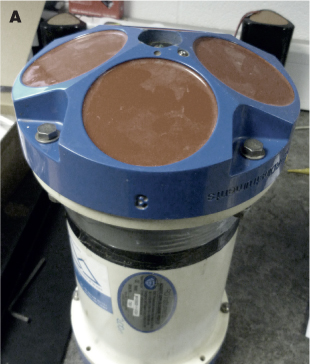
Figure 14.6 (A) An Acoustic Doppler Current Profiler (ADCP) which contains the acoustic transducers.

Figure 14.6 (B) An ADCP in a frame ready for deployment on the seabed. The large yellow buoy to the left is the surface marker buoy.
14.4 Satellite remote sensing
The oceans are large, and research vessels can only cover a small part of their area during a single cruise. In contrast, a satellite orbiting the earth can cover the entire ocean every day. Instruments aboard a satellite can make measurements of some surface water properties from a height of several hundred kilometres above the water – a procedure called remote sensing. In passive remote sensing, the satellite measures the electromagnetic radiation (mostly in the form of visible light and infra-red radiation) leaving the water surface. Figure 14.7 shows a satellite image of the seas of north-west Europe in the visible part of the spectrum. The regions of bright, coloured water in the English Channel and Irish Sea are caused by particles suspended near the surface. A lot has been learned about the behaviour of suspended matter in shelf seas using images such as this. We have already seen in Chapter 6 how infra-red images can be used to study the surface temperature of seawater and can be used to detect fronts. It is also possible to use passive remote sensing at longer wavelengths to measure the surface salinity of open ocean waters.
Active remote sensing involves sending a pulse of electromagnetic energy from the satellite down to the sea surface and measuring the properties of the signal that bounces back. Energy at radar wavelengths (a few centimetres) are most commonly used. The time of flight of the radar pulse gives the distance between the satellite and the water surface. If the satellite height is determined independently (using ground stations) the undulations of the ocean surface can be measured. These altimetry measurements are valuable for studying ocean tides, currents (because of the geostrophic balance) and waves. The exact nature of the radar echo depends on the roughness of the sea surface, and radar images of surface roughness can be produced.

Figure 14.7 A satellite colour composite image of the seas around the British Isles. Bright coloured water in the Irish Sea and English Channel is caused by suspended particles scattering light. Land and clouds are coloured black
14.5 Sampling difficult places to reach
Sampling the organisms of the deep is a difficult thing to do, and has been compared to sampling a rainforest from a plane being flown 2 km above the clouds, dangling a net below the plane and pulling it through the forest canopy. How would you ever reconstruct a decent idea of the rainforest from the bits and pieces that would collect in the net? However, that is exactly what most of the deep-sea research has had until very recently. Just trawling a net at 5000 m actually requires having a cable of twice the length, considering the angle that needs to be employed between the ship and net for effective towing: 10 km of heavy steel cable has to be deployed from a huge cable drum and can be carried only on the largest of research vessels.
Much of what we know about the deep sea, especially systems like hydrothermal vents, has come from the development of manned submersibles that can withstand the large pressures of the deep ocean. Possibly the most famous of these is the USA’s Alvin that can dive routinely to depths of 4500 m. There are a number of such DVSs (Deep Submergence Vehicle), many of which can go down to 6000 m or more. These are equipped with a range of robotic arms for collecting samples and other sophisticated sampling devices for water, organisms and deep-sea sediment samples. The deepest manned dive was a two-man mission in the Trieste in 1960 to a depth of about 10,900 m. DVSs require considerable investment, since the infrastructure in ships and personnel to support the missions is considerable.
Unmanned vehicles, or remotely operated vehicles (ROVs) are of course a less demanding technology than sending humans down to the depths. These can carry cameras, videos, water samplers and even robotic arms to collect samples. The depth limitation of an ROV is of course the length of cable that attaches the vehicle to the operator on ship. However, vehicles like Nereus, operated by Woods Hole Oceanographic Institution in the USA, is able to be operated as an ROV, but can also be untethered from the cable for wider-scale studies, thereby operating as an Autonomous Underwater Vehicle (AUV). AUVs are programmed to fulfil a sampling programme/survey and then surface at a specified location.
Another way of measuring what is going on at the ocean floor is to send down landers, which are structures designed to sit on the sediment surface and make measurements or take water samples at programmed time intervals. Often landers, as well as containing probes, sensors and sampling devices, also have video and time-lapse cameras to record the organisms present at the site. Some landers are dedicated to just taking images, often baited with food to attract organisms. The lander is retrieved by sending an acoustic signal to release it from the weights holding it on the bottom, after which it then floats to the surface and is retrieved. Landers are routinely deployed for periods of days, through to several months.
Sediment traps are frequently deployed to catch the flux of particles through the water column. They are typically constructed in the form of an inverted cone, so that a large surface area of the structure collects the material falling down, and this is concentrated in the narrow part of the cone, where it is collected in bottles. Each sediment trap will be equipped with a number of sample bottles, and the device programmed so that each bottle will collect material for a defined period of time. In this way a sediment trap could be left in the water for a year or even more, and the flux of sinking material for each month collected in a single sample bottle. The bottles have a poison in them so that the material is preserved and doesn’t decay before analysis once the trap is retrieved. Often traps are hung at different depths on a single mooring. Like the lander, when the deployment is finished an acoustic signal is sent to release the array of traps from the weights holding the line in position, and they float to the surface.

Figure 14.8 (A) The DVS Alvin being launched.

Figure 14.8 (B) Closer view showing the complex array of sampling devices, bottles, sensors and camera equipment.

Figure 14.9 ROV being deployed in the Arctic. NB the thick cable coming out of the top, which connects it with the operator on board the ship.
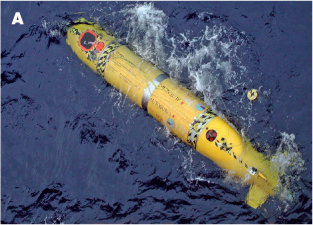
Figure 14.10 (A) Autosub which is an AUV, that gets some curious looks from the resident animals such as this whale in the Southern Ocean.
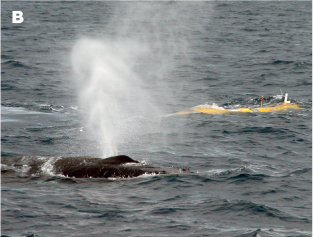
Figure 14.10 (B) Autosub which is an AUV, that gets some curious looks from the resident animals such as this whale in the Southern Ocean.

Figure 14.11 A benthic lander about to be deployed.
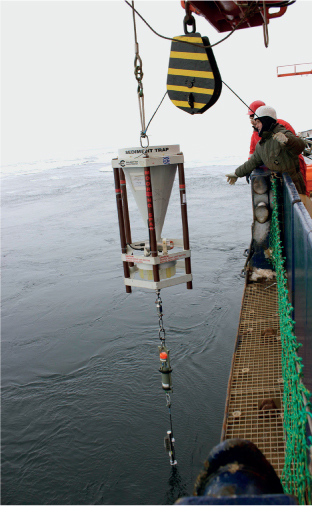
Figure 14.12 Sediment trap being deployed in the Arctic. NB the green and orange current meter beneath it that is important for recording the current speed and direction during the sediment trap deployment.

Figure 14.13 Schematic of a series of sediment traps and current meters deployed in the deep ocean.
As exciting as these technologies are, they are still restricted to the places where ships travel, and therefore a large part of the world’s oceans will be sampled only infrequently, if at all. What are needed are roaming platforms that are able to measure physical, biological, and chemical parameters across depths and for long transects. A whole range of AUVs, gliders, and floaters have been under development since the late 1990s (Figure 14.14). These battery-powered devices are designed to ‘roam’ pre-programmed tracks over large regions of the ocean, collecting data. Periodically these devices surface to send the collated data to satellites, which then transfer the data to base stations, from where scientists can download the information. To date, many of these devices carry sensors for salinity, temperature, and pressure, among others. However, as technology progresses other sensors such as fluorescent and nutrient sensors will be routinely deployed on such platforms.
14.6 Sampling the biology
Collecting water from the rosette bottles deployed with the CTD is the routine way of sampling the phytoplankton and bacteria. However, zooplankton (even small ones) and fish are more typically sampled using nets. These vary in shape and size and can either be trawled behind a moving ship or vertically through the water column. The latter method is vital if you want to know the vertical distribution of the organisms in the water, and devices are deployed to close the nets at desired depths as the nets are hauled up vertically. In some instances nets are hauled singly, but frequently devices holding multiple nets are cast at a single time. Naturally with nets, the size of the mesh determines the size of organisms caught, and as a rough guide a mesh size of 75% of the width of the smallest organisms requiring to be sampled is needed for quantitative sampling; e.g. for copepod samples, nets with mesh sizes of around 200 to 500 µm are frequently used.
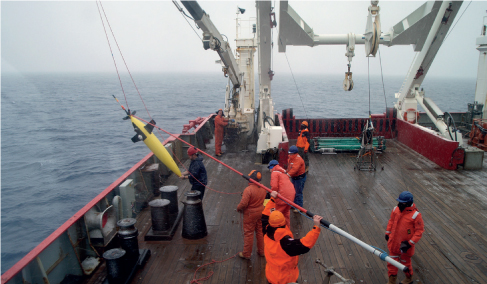

Figure 14.14 Seagliders from the University of East Anglia, UK being deployed in the northern Weddell Sea (Southern Ocean) in January 2012 from the RRS James Clark Ross. Three Seagliders were deployed as part of the GENTOO project (Gliders: Excellent New Tools for Observing the Ocean) in order to study the dynamics of the Antarctic Slope Front and its role in maintaining the krill-based ecosystem.

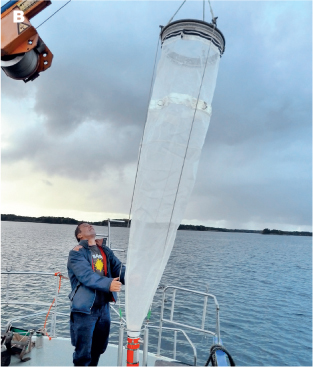

Figure 14.15 Different types of vertical (A and B) and horizontally towed nets (C).
The organisms collected in the nets are obviously easy to collect for sorting and counting when the net is retrieved. However, for the smaller suspended particles, phytoplankton and bacteria, it is not so straightforward. These generally occur at such low concentrations that they have to be concentrated, which is done by either letting the samples settle, or more usually by filtering through filters with defined pore sizes. The chemists interested in the dissolved constituents of the water also have to filter out the particulate material before they can analyse the water. For many scientists on a ship, a very large amount of time can be spent laboriously filtering water, since it has to be done slowly under gentle vacuum pressure so as not to damage the organisms.

Figure 14.16 Seals with sensors (position, depth, temperature and salinity sensors) attached with glue to the fur on their backs. The sensors are attached while the seals are sedated (in the tent in the background) and these two are just waking up. When the seal sheds its fur the tags will be lost.
An alternative to using nets for fish and zooplankton is to use acoustic devices. These devices transmit regular pulses of sound of a single frequency (tens to hundreds of kiloherz), which hit a target, and the sound reflected from the organisms is measured by a receiver. Fish that have swim bladders filled with gas are particularly good reflectors; however, acoustic techniques are effective for measuring many zooplankton species, especially those that form dense layers in the water, such as krill. Acoustic devices left on moorings at one spot are particularly useful for recording diurnal migrations of zooplankton and fish.
Satellite technology can be used for tracking the migration and movements of large animals in oceans. Tags, which send data back to researchers via satellite links, have been attached to whales, seals, turtles, and birds, and the position of the animal is recorded for as long as the transmitter functions or stays attached to the animal. As this technology advances, the sensors included on the tags have expanded to include depth sensors for recording the diving behaviour of the animals; mini CTDs to record salinity and temperature of the waters; devices to record when an animal opens its mouth under water to show at what depth it is feeding; mini cameras to record an animal-based perspective of what it is like under water.
Mammals can even be used to collect oceanographic information from regions that cannot be accessed by ships, such as beneath ice. Whales or seals can spend considerable time under ice or at ice edges, but need to surface regularly to breathe, and so are ideal candidates for such biological AUVs. In one study two Beluga whales were equipped with devices to measure depth, salinity and temperature in an Arctic ice-covered fjord. The data was logged as the whales dived to depths of 180 m, and when the whales surfaced to breathe the data was automatically transmitted to scientists via satellites. Although the sensor on one of the whales failed, data from the other was returned for 63 days, enabling the distribution of water masses under the ice to be described over an area of 8000 km2. Such information would never have been possible with a ship.
14.7 The long term
As oceanographers contemplate the effects of long-term change in the oceans, it is paramount that long-term data sets of comprehensive information are available. There are two ways of collecting such information: keep going to the same place on a regular basis or deploying moored instruments to collect data and or samples.
One of the most imaginative ways of getting such data is the use of cargo or ferry ships, which routinely travel along the same courses. Automatic water samplers and/or sensors can be installed on these so that detailed information can be collected over long periods of time. A pioneer who recognised the importance of such surveying was Sir Alister Hardy (1896–1985). He invented the continuous plankton recorder (CPR), a device towed by a ship at a depth of about 10 m, which collects the plankton onto a silk ribbon. The ribbons are returned to the Sir Alister Hardy Foundation for Ocean Science in Plymouth, UK (http://www.sahfos.ac.uk/) where the plankton on the ribbon are analysed to measure phytoplankton and zooplankton species abundance and colour as a measure for the density of plankton. The first tow was in 1931 from Hull, UK to Bremen, Germany, and since then more than 275 vessels have been used to tow CPRs, and the North Sea and North Atlantic have been routinely sampled on a series of shipping routes since the 1940s to the present day. In a single year there can be over 380 tows covering distances of more than 130,000 nautical miles.
Two long-term oceanographic programmes were inspired in their conception, and their implementation has been fundamental to our understanding of seasonal changes in physics and biogeochemical processes in the oceans. These are the monthly samplings taken at a deep water in the Pacific, in the Hawaii Ocean Time Series (HOTS, http://hahana.soest.hawaii.edu/hot/hot_jgofs.html), and a sister project in the Atlantic, the Bermuda Atlantic Time Series (BATS, http://bats.bios.edu/index.html). Scientists have been making monthly measurements at these two stations since 1988 to include temperature, salinity, major inorganic nutrients, gas content of the water, pH, chlorophyll, bacteria and phytoplankton productivity, among others. They also have long-term moorings at the two stations. These two remarkable time series are a considerable investment of both resources and scientific effort. However, the information on the inter-annual variability has been invaluable in unraveling our knowledge about the changes occurring due to short-term variability compared with long-term change.

Figure 14.17 Despite all the progress made over the past 200 years by tens of thousands of dedicated oceanographers from around the world, we are routinely surprised by new discoveries from the depths. Exploring the oceans can be demanding, and taxes human ingenuity to the limits. However, the lure to take to the sea is a powerful one, and for those of us who have had the privilege to dedicate our careers to the study of oceanography, the rewards are immense.