IS IT A FAKE?
Number tests that can detect the fraudsters
Criminals can inadvertently leave all sorts of clues about their crimes, such as fingerprints, fibres of clothing or weapons. But there is another less tangible type of clue that can prove to be just as incriminating. In a whole range of activities, from business to the laboratory, a fraudster has been discovered because of the numbers he has left behind. Not phone numbers or bank accounts, but ordinary-looking, everyday statistics.
One of the most curious pieces of evidence that indicates potential fraud hinges on the number 1. To understand the principle behind it, take a look at the front page of today’s newspaper. Almost certainly lots of numbers will appear on it, in all sorts of contexts. For example: ‘50,000 more troops…’, ‘cut by 2.5 per cent’,’ ‘…last happened in 1962…’, ‘he gave 18 precise instructions’, ‘… father aged 65…’, or ‘continued on Page 3’.
These numbers are all completely unrelated to each other, but do they display a pattern? What proportion of the numbers in a newspaper would you guess begin with the digit 1? What proportion begin with 5 or 8?
You may never have given this any thought, but it would be natural to suppose that the first digits of numbers in a newspaper are pretty evenly spread. In other words, you might expect that a number drawn randomly from a newspaper is as likely to begin with a 1 as with a 9.
Surprisingly, this is not the case. In fact a number drawn randomly from the front page is much more likely to begin with a 1 than any other digit. Almost half the numbers will begin with a 1 or a 2, and the larger the digit the less likely it will be to appear at the start of a number. Numbers beginning with 9 are quite rare. If you collect enough results, you should find something close to this pattern emerging:
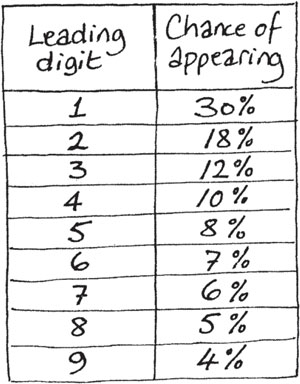
How can these numbers be predicted so accurately, when the newspaper numbers are drawn from an unpredictable selection of stories? This odd distribution of numbers is determined by what is popularly known as Benford’s Law. In 1939, Frank Benford, an engineer at GEC, made a curious observation. When he was looking at statistics for the populations of cities, far more of the numbers began with ‘1’ than with any other digit. He investigated this further, and discovered that it also applied to stock prices, river lengths, sports statistics – in fact almost any collection of everyday numbers.
Benford’s Law turned out to work everywhere, as long as the sample of numbers was sufficiently large, and the numbers concerned were not constrained by some sort of rule or by narrow limits. Telephone numbers do not obey Benford’s Law, for example, because they are constrained by having to be seven or eight digits long. The height of adult males would also not fit the pattern because males are almost always between 150 and 180cm tall. As long as these conditions are borne in mind, however, the Law is remarkably powerful.
Benford’s Law and fraud detection
Early in the 1990s, Benford’s Law made its famous entry into the world of fraud detection. Mark Nigrini, a lecturer in accountancy, asked his students to look at the accounts of a business they knew, in order to demonstrate to themselves the predictable distribution of first digits. One student decided to look at the books of his brother-in-law, who ran a hardware shop. To his surprise, the numbers didn’t resemble the Benford distribution at all. In fact 93 per cent of them began with the digit 1, instead of the predicted 30 per cent. The remainder began with 8 or 9.
The discrepancy was so huge, that it suggested that something must be wrong with the figures. In fact, rather embarrassingly for all concerned, the student had inadvertently discovered that his relation had been fraudulently cooking the books.
From these small beginnings, Benford’s Law has grown to become one of the formal tools that many accountants use to try to detect fraud. The joy of the method is that it is so simple to use. Just occasionally it comes up trumps, as in one case in Arizona, where the accused was found to have made too many cheque payments that began with the digits 8 and 9. The numbers themselves looked innocuous enough, but they were completely at odds with the downward curve predicted by Benford. This pattern was actually typical of people who are inventing fraudulent figures. Often they will invent sums of money that are just below a significant threshold, such as £100, where further authorisation may be required. In doing so they are distorting the natural pattern of numbers, and leaving clues for investigators that something odd is going on.
What if the statistics are too good?
Fraudsters don’t just operate in business. Figures can be cooked in all sorts of places, particularly in science. Scientists are always under pressure to come up with results that produce the answers they, or their sponsors, are looking for. Often these will be newsworthy discoveries, especially findings such as a new wonder drug. The temptation to give the statistics a helping hand must sometimes be overwhelming.
This is not just a modern phenomenon. In the 1950s, the psychologist Cyril Burt was keen to find out whether intelligence was mainly determined by your genes or your upbringing. To use the modern expression, he was testing nature against nurture. To do this, he tracked down identical twins who had been separated in their infancy, so that he could compare their performances in intelligence tests. Because they were identical, they had the same genes, but they had experienced very different upbringings. As a comparison, he found a group of non-identical twins who had been brought up together. These had different genes but almost identical upbringings.
The formula for Benford’s Law – and why it works
Proving Benford’s Law is tricky, but here is one way of seeing why it might be true.
Imagine you are setting up a raffle, in which you will randomly draw a number out of a hat. If you sell only four raffle tickets, numbered 1, 2, 3, 4, and then put them into a hat, what is the chance that the winning number will begin with 1? It is 1in 4, of course, or 25 per cent.
If you now start to sell more raffle tickets with higher numbers 5, 6, 7, and so on, your chance of drawing the 1 goes down, until it drops to 1 in 9, or 11 per cent, when nine tickets have been sold. When you add ticket number 10, however, two of the ten tickets now start with a 1 (namely 1 and 10), so the odds of having a leading 1 leap up to 2 in 10, or 20 per cent. This chance continues to climb as you sell tickets 11, 12, 13… up to 19 (when your odds are actually 11⁄19, or 58 per cent). As you add the 20s, 30s and above, your chances of getting a leading 1 fall again, so that when the hat contains the numbers 1 to 99, only 11⁄99, or about 11 per cent, have a leading 1. But what if you put in more than 100 numbers? Your chances increase once more. By the time you get to 199 raffle tickets, the chance that the first digit of the winning ticket will be 1 is 111⁄199, which is over 50 per cent again.
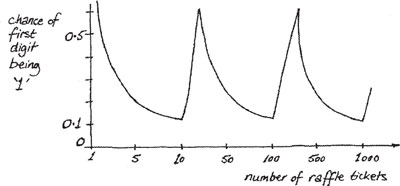
You can plot your chance of winning this game on a graph. On the vertical axis is the chance that the number you draw will begin with a 1, and along the bottom is the number of raffle tickets sold.
Interestingly, the chance zigzags between about 58 per cent and 11 per cent as the number of tickets sold increases. You don’t know how many will be sold in the end, but you can see that the ‘average’ chance is going to be somewhere around the middle of those two, which is what Benford’s Law predicts. The exact chance that a number will begin with digit N as predicted by Benford’s Law is: log (N+1) – log (N), where log is the logarithm of the number to base 10 (the log button on most calculators). For N = 1, this predicts log (2) – log (1), or 0.301, which is 30.1 per cent.
The statistical test that Burt used to examine these groups is known as a correlation coefficient. This is a statistic that measures how closely two results vary with each other. For example, the correlation between the temperature outdoors and the consumption of ice cream is probably quite high – in hot weather, lots of people buy ice cream, whereas on cold days there is very little demand. On the other hand, there is probably no correlation between the sales of ice cream on a particular day and, say, the number of children born that day in Liverpool. The two statistics are completely independent of each other.
In the case of the twins, if genes were the main influence on intelligence, Burt would have expected the separated identical twins to have a high correlation in their IQ tests. In other words, if nature determines your intelligence, it doesn’t matter what kind of home or school you go to, your brightness will shine through. However, if upbringing was more important, then the nonidentical twins brought up in the same home should have had the greater correlation.
Burt’s results showed a much higher correlation for the identical twins living apart. The actual result was a coefficient of 0.771 out of a maximum possible of 1.0. This was very high, and seemed to provide strong evidence that it was genes that mattered most.
What raised suspicions, however, was that in a later experiment Burt confirmed his earlier result by finding, once again, a correlation for identical twins of 0.771. This could, of course, have been a coincidence, but the investigators didn’t think so. Scientific results always have a certain amount of random fluctuation, and the chance of producing the same result to three decimal places was almost certainly less than 1 per cent. Taking this and other factors into account, five years after his death Cyril Burt was found guilty of fraud by the British Psychological Society. To this day it is still not certain if this conclusion was fair, but without doubt it demonstrated that if you fake your results, it pays not to be too consistent.
Who leaked to the press?
A different form of cheating is the anonymous leaking of confidential documents to the press. This must be hugely annoying for the authors, at least when they aren’t the ones responsible for the leak.
To help trace the source of leaks, one software company several years ago devised an ingenious method of labelling documents. When the originals were printed out and distributed, each document appeared to be identical. The person leaking the document could therefore feel confident that it could be passed on without any clue as to who the culprit was. However, the word processor’s software was adapted so that on the bottom line of one page, the spacing between the words was different in every document. For example, the first copy could say:
This will almost certainly lead to an increase in unemployment.
The second would say:
This will almost certainly lead to an increase in unemployment.
The two might look identical, but, if you examine them more closely, you will see that the first has a wider space between the words almost and certainly, while in the second the gap is between certainly and lead. Spaces are being used as a unique, secret code to identify the recipient of each document. In fact this is a form of binary code. In the above sentence there are ten words and nine spaces between the words. If a normal space stands for 0 and a double space for 1, then the first sentence has the code:
001000000
And the second is coded:
000100000
Using a string of nine 0s or Is, there are altogether 512 different combinations that can be made using just that one innocuous sentence -plenty enough to ensure a unique code for everyone on the distribution list of most documents.
If the leaked document can be recovered, the source of the leak can be tracked down immediately. Who knows how many documents coded in this way you have received over the years?
A different but equally important type of fraud has been known to take place in the classroom or exam hall. Every year, a school pupil or student is accused of cheating, often by copying from a neighbour in some way. Like all other fraudulent acts, it is usually a statistic that stands out from the norm that first arouses suspicion. In this case, the abnormal statistic is usually a student who performs much better than his predicted grade.
At this point, all sorts of investigations can be made, including comparisons between the suspect’s answers and those of the neighbouring students. Usually maths is not needed to detect the guilty. The same wrong answer using identical wording on two neighbouring papers is incriminating enough. For multiple-choice tests, however, it would be relatively easy to devise a method comparing the selections made by two neighbouring candidates. Incorrect answers are likely to be the key. The chance of both candidates getting consistently the same wrong answers is extremely low.
Detective work also extends to the world of literature. Did Shakespeare really write all of the plays that today carry his name? Scholars continue to debate this, and the more numerate of them have used statistical methods to investigate the authorship of certain works.
How do you statistically analyse a work that is supposedly by Shakespeare?
The simplest approach is to count how often Shakespeare used certain words in those works that are known to have come from his pen. Certain words appear frequently, such as the words ‘world’, ‘naught’ and ‘gentle’. Other words never crop up at all, such as the word ‘bible’ (this odd fact often crops up in pub quizzes). If the work under investigation included the word ‘bible’, suspicions would immediately be raised that this was not a Shakespeare piece, and in fact the relative frequencies of the different words can be directly compared to see if they follow the familiar pattern.
Investigations of authorship do get much more sophisticated than this, however. In 1985, a poem entitled ‘Shall I die?’ was discovered in the Bodleian Library of Oxford University. On the manuscript were the initials WS. Could this be a forgotten Shakespeare work?
The investigations began. One early analysis was based on the patterns of words that Shakespeare used as his career progressed. In each new work, it turned out, Shakespeare had always included a certain number of words that had never appeared in any of his earlier works. (Fortunately, computers are able to do all of the word counting to prove this. Imagine how tedious this sort of analysis was before the electronic age,) It was therefore possible to predict how many new words might be expected in a new work. If there were too many, it would be pretty clear that the author couldn’t be Shakespeare. No new words at all, and it would look suspiciously as though some -body had tried too hard to copy Shakespeare’s style.
The mathematical prediction was that the poem ‘Shall I die?’ should contain about seven new words. In fact it contained nine, which was pretty close. This was used as evidence to confirm Shakespeare’s authorship.
But the sceptics were not convinced, not least because the poem didn’t read like a Shakespeare. Many other analyses were carried out on the words. One devoted professor looked not at individual words but at the connections between words. As an example to show how this could work, two authors might both use the words ‘heaven’ and ‘earth’ equally often, but one might always use the two together, while the other always uses them individually. Each pattern will be a distinctive feature of the author. Indeed it might be said that the words resemble a DNA sample or a fingerprint, though this analogy has to be treated with great care because, while a person’s DNA never changes, the patterns in their text might vary considerably from docu ment to document.
The word-connection test appeared to rule out Shakespeare, though unfortunately it ruled out all of the other leading contenders too, such as Marlowe and Bacon. This test didn’t convince everyone, either, and in fact the debate continues about who really wrote the sonnet. Current opinion seems to favour Shakespeare as author, but it does depend on which test you trust.
There is in fact a whole range of different statistical tests that can be carried out on documents. Others include average sentence length and average word length. Even parts of words can be compared, for example by breaking up a document into five-letter chunks and performing a huge number-crunching analysis on the frequency and distribution of patterns.
Does this help in crime? It can at least provide supporting evidence. On a couple of occasions, most notoriously in the case of the Unabomber in the USA, letters sent by the suspect have been compared against other documents he has produced to see whether the patterns match. However, to be truly confident of identifying the author of a work purely by the words used, as opposed to handwriting style or spelling mistakes, it may be necessary to have thousands rather than hundreds of words in order to get a conviction. In other words, it takes more than a sentence for a judge to give a sentence…
How chi-squared won the girl
One statistical test used by literary analysts, as well as by scientists and many others, is known as the chi-squared test. In this test the observed frequencies in the sample, such as the number of occurrences of words such as ‘bible’ and ‘discontent’, are compared with the expected number. The conclusion of this test is expressed as a percentage chance: for example, ‘Fewer than 5 per cent of Shakespeare’s documents might be expected to have produced the patterns we see here.’ In one of its more unusual applications, back in the 1980s a student used a chi-squared test to demonstrate to manufacturer Rowntree’s that the letters inside the caps of packets of Smarties chocolates were not randomly distributed. He had been trying in vain to collect the letters of his Valentine’s name. He won the argument, received some free packets – and got the girl, too.
How many frauds are there out there?
No detection system is perfect, and some frauds are always bound to slip through the net. Even though they may not be found, it is actually possible to make an estimate of the number of fraudsters who get away with it, based on the number that are found.
The technique for calculating the number of fraudsters would be the same as one that is used by proofreaders checking a document. Everyone knows that typographical errors (called typos by those in the trade) are sometimes difficult to spot, so a printer might ask two proofreaders to read through indepen -dently to look for errors.
Suppose the first reader finds El errors and the second finds a different number, E2. They now compare their results, and discover that some of the errors, a number S, were the same ones. How many errors might they expect there to be in total?
There is a way of making a good estimate, known as the Lincoln Index. This says that the total number of errors in the manuscript will be roughly:
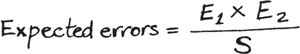
For example, suppose the first reader found fifteen errors and the second twelve, and that ten of the errors were found by both. The Lincoln Index predicts 15 x 12/10 = 18 errors in total. Of these only seventeen have been found so far – ten found by both readers plus five more that only the first reader found and two more that the second found.
Exactly the same technique could be used by, say, tax inspectors to estimate how many fraudulent tax forms were getting through. Two inspectors would independently check through a pile of forms, and identify the suspect ones. If the first clerk found 20 and the second 24, with 12 in common, then the inspectors have identified 32 different suspect claims between them. The Lincoln Index suggests that there are 20 x 24/12 = 40 suspect forms in total. This means that about eight have slipped through.
As far as we know, this has never been used as a frauddetection technique, but it would be an interesting one to test out. In fact, added to the other devices described earlier, it’s enough to make amateur sleuths of us all.