Tying It Together
We have studied demand from two perspectives. We started with the individual demand decisions that you make, and then considered total market demand for a product, across all buyers. These two perspectives are each important, although for different reasons. Managers want to know how much people will buy at each price. This is exactly what the market demand curve reveals. Consumers want to know how to make the best choices given their limited income, and this is what our study of individual demand addresses. Because these individual demand curves are the building blocks of the market demand curve, these questions are fundamentally intertwined.
Individual Demand
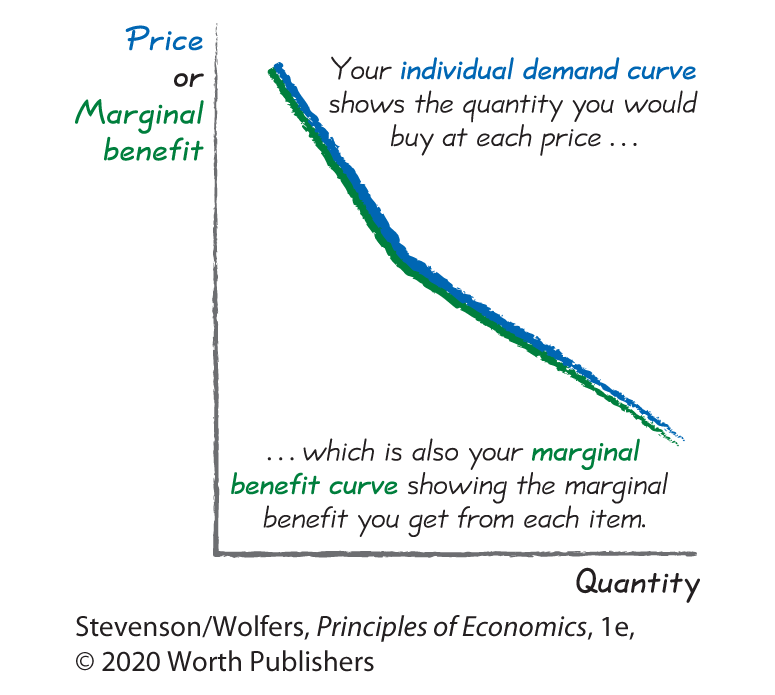
The most common question you’ll face as a buyer is: “How much should I buy?” The Rational Rule for Buyers distills the core economic principles down to one simple piece of advice: Buy more of an item if the marginal benefit of one more is greater than (or equal to) the price. Follow this advice consistently, and you’ll keep buying until your marginal benefit equals the price. In turn, your individual demand curve is your marginal benefit curve. And the tendency toward diminishing marginal benefits means that your marginal benefit curve—and hence your demand curve—is downward-sloping. You can see why economists say that understanding demand is all about understanding marginal benefits.

There’s also a more general idea at work here. In Chapter 1, we introduced the Rational Rule, which simply says: If something is worth doing, keep doing it until the marginal benefit equals the marginal cost. The Rational Rule for Buyers is just the application of this rule to your buying decisions, where the marginal cost of buying something is the price. Throughout your study of economics, we’ll discover that whenever you are trying to figure out how to make optimal choices—whether in your role as a buyer, seller, worker, boss, entrepreneur, investor, or anything else—the relevant rule will turn out to be an application of the Rational Rule. That’s the advantage of our principles-based approach: It highlights the similarities of good decision making across very different contexts. Stay tuned; we’ll see more of this in future chapters.
Market Demand
Managers find the market demand curve to be useful because it allows them to forecast how changing economic conditions will affect the quantity they will sell. When the price changes, this causes a movement along the market demand curve, and hence changes in the total quantity demanded. Because the demand curve is downward-sloping, a lower price will raise the total quantity demanded, and a higher price will reduce the total quantity demanded.
But there are also several factors that shift your demand curve. An increase in demand is a rightward shift of the demand curve at each and every price, while a decrease in demand is a leftward shift.
The interdependence principle leads us to six key factors that shift demand curves. These include changes in:

- Income: Higher income increases the demand for normal goods, but decreases the demand for inferior goods.
- Preferences: Demand for particular goods can increase or decrease as your desire for those goods change. Preferences can be changed by trends, advertising, changing lifestyles, and countless other factors. Advertisers will try to increase your demand for their products. Social pressure can also shift demand curves.
- Prices of related goods: Demand will increase if the price of substitute goods rises, or the price of complementary goods falls. Demand will decrease if the price of substitute goods falls, or the price of complementary goods rises.
- Expectations: If prices are expected to rise, today’s demand will increase; if prices are expected to fall, today’s demand will decrease.
- Congestion and network effects: If a good with network effects becomes more popular, demand will increase. If a good with congestion effects becomes more popular, demand will decrease.
- Type and number of buyers: Demand will increase due to population growth, immigration, or access to new international markets. Demographic change can also shift demand. This factor only affects market demand curves, not individual demand.
This chapter focused on consumers and how marginal benefits shape demand. In the next chapter, we’ll turn our focus to businesses, and how the marginal costs of production affect supply.