11.4 Changing Economic Conditions and Labor Market Equilibrium
It’s time to pull the threads of this chapter together. At this point, you’ve developed a powerful framework for understanding how the labor market operates. This framework illustrates how the wages in each occupation and the number of people each occupation employs are determined by the intersection of labor demand and labor supply.
A Three-Step Recipe
It follows that anything that causes a shift in labor demand or a shift in labor supply will lead the wages and employment opportunities within your occupation to change. And that’s what’ll make this framework so useful as you navigate your own career: You can use it to forecast how short- and long-term changes will affect wages, employment, and other conditions in any job that you’re considering. Look ahead, and you can adapt your career to take advantage of the positive shifts, and if you’re nimble, you can minimize the impact of adverse changes.
To forecast the effects of changing market conditions, use the same three-step recipe that you use to assess the consequences of any shift in supply and demand. Ask yourself:
Step one: Is the labor supply or labor demand curve shifting? (Or both?)
Remember that labor demand is all about marginal revenue product—the extra revenue an extra worker generates—so anything that shifts the productivity of workers or the value of their output will also shift labor demand. And labor supply is all about opportunity costs: The opportunity cost of working is not working—staying in education, working outside the market, or retiring; the opportunity cost of working in one occupation is not working in another; and the opportunity cost of working an extra hour is an hour of leisure. So anything that shifts these opportunity costs will shift labor supply.
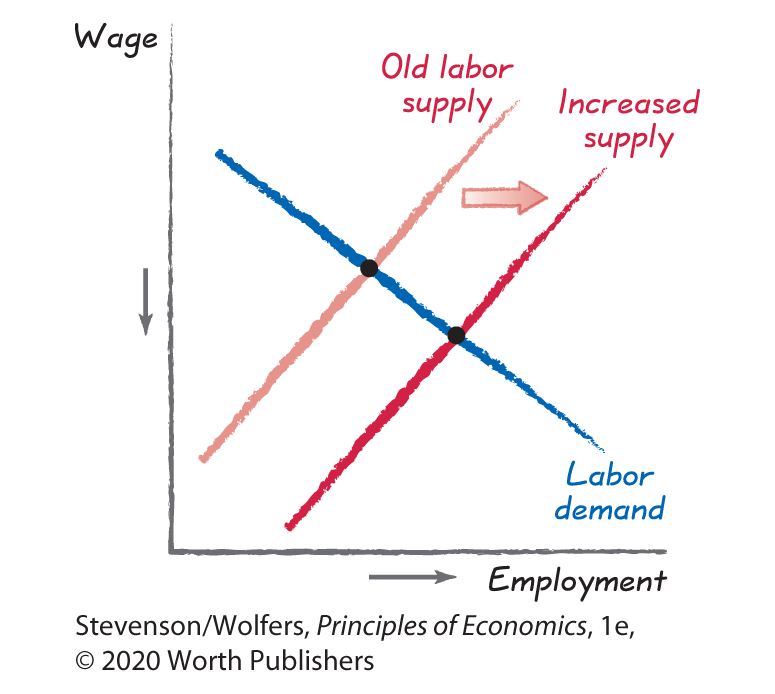
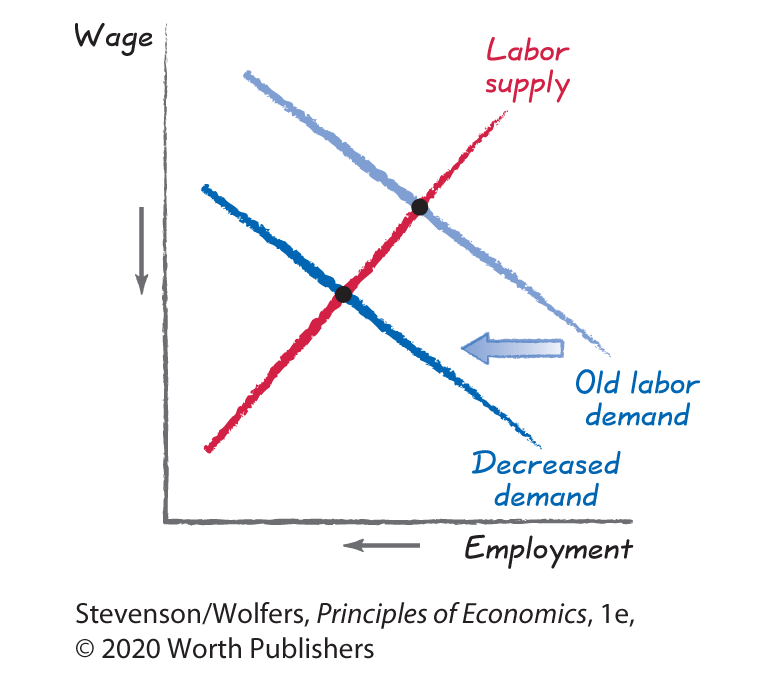
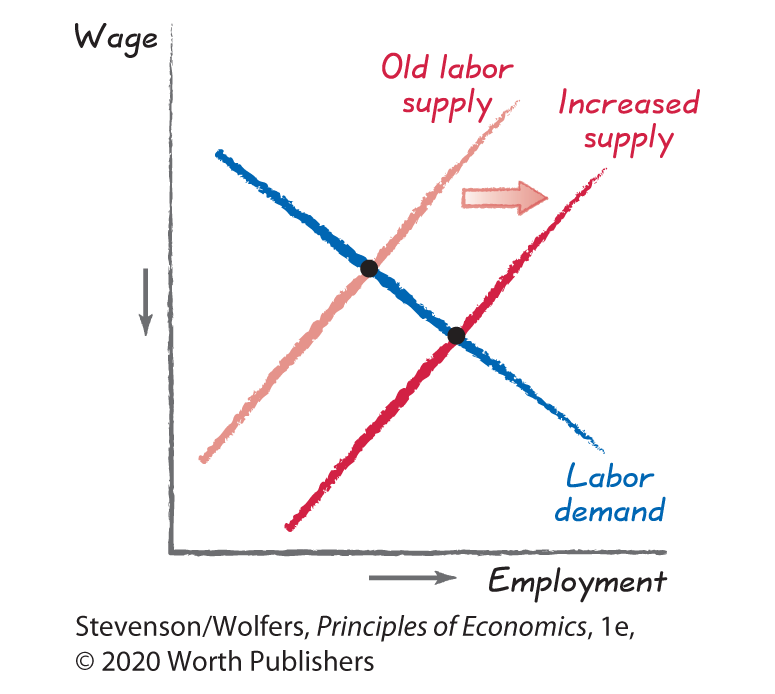
Step two: Is that shift an increase or a decrease?
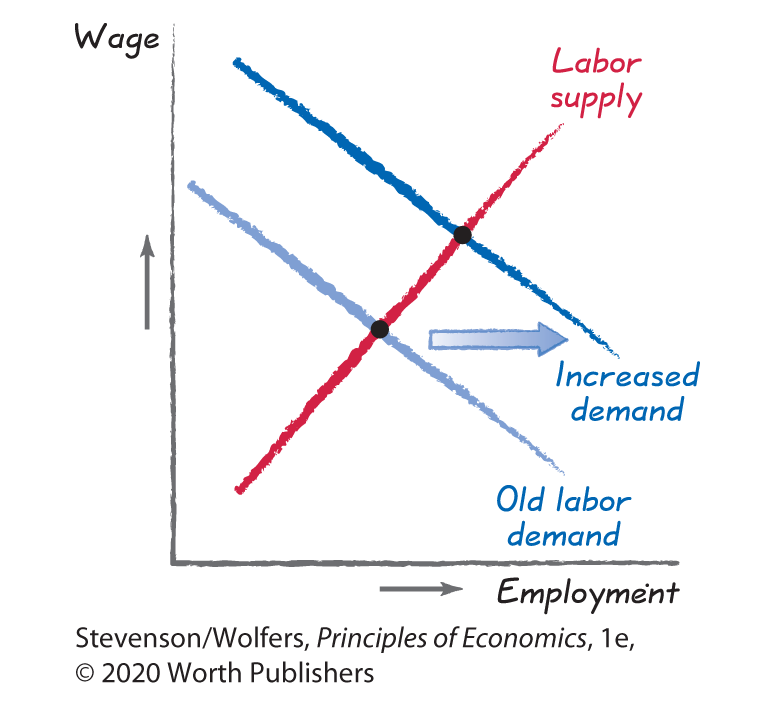
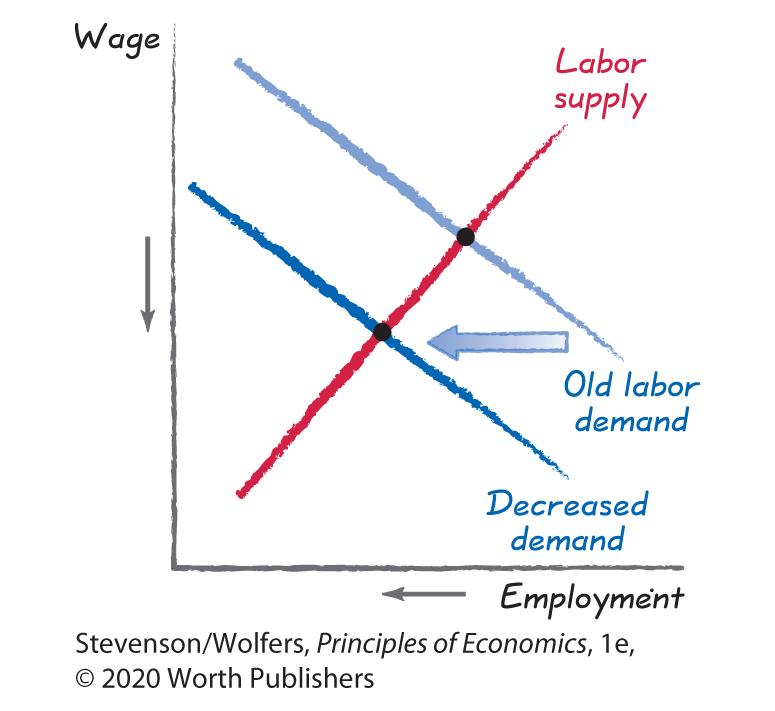
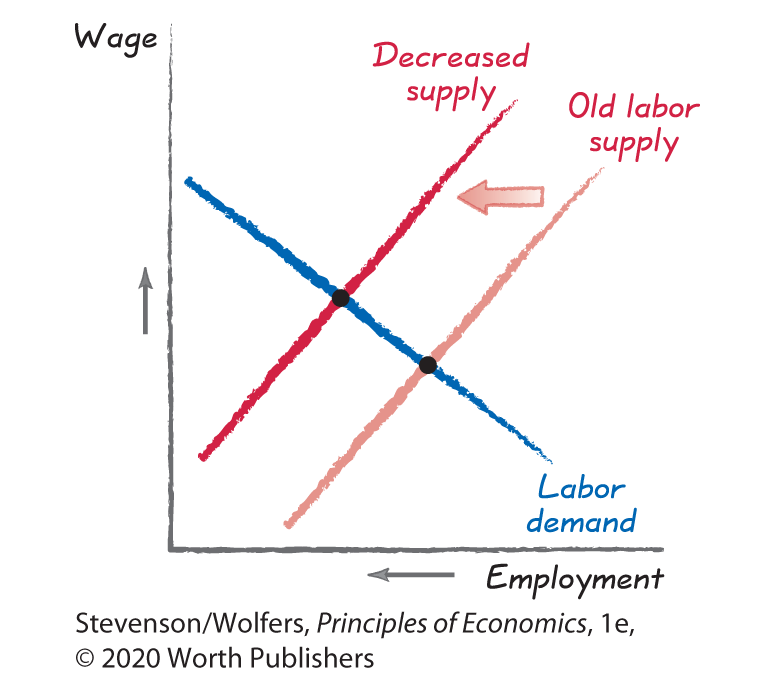
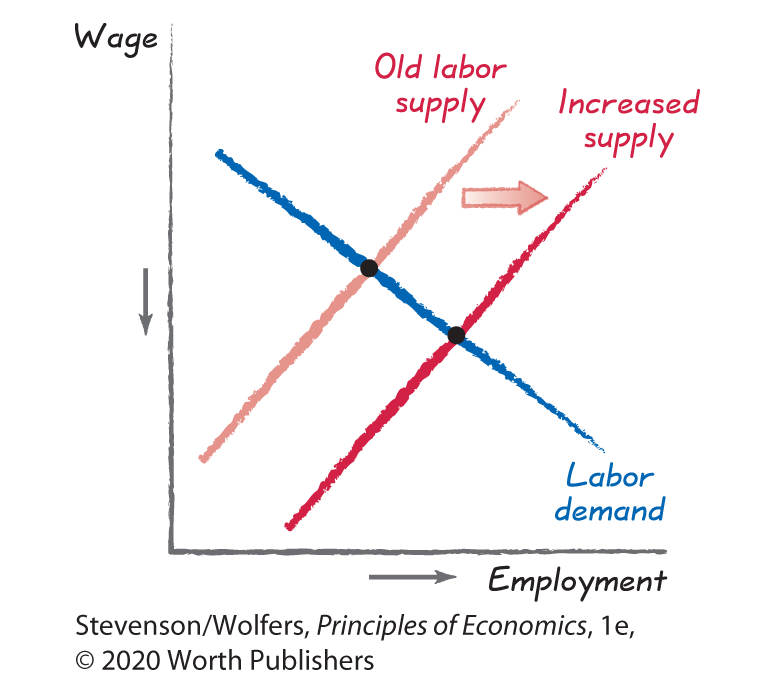
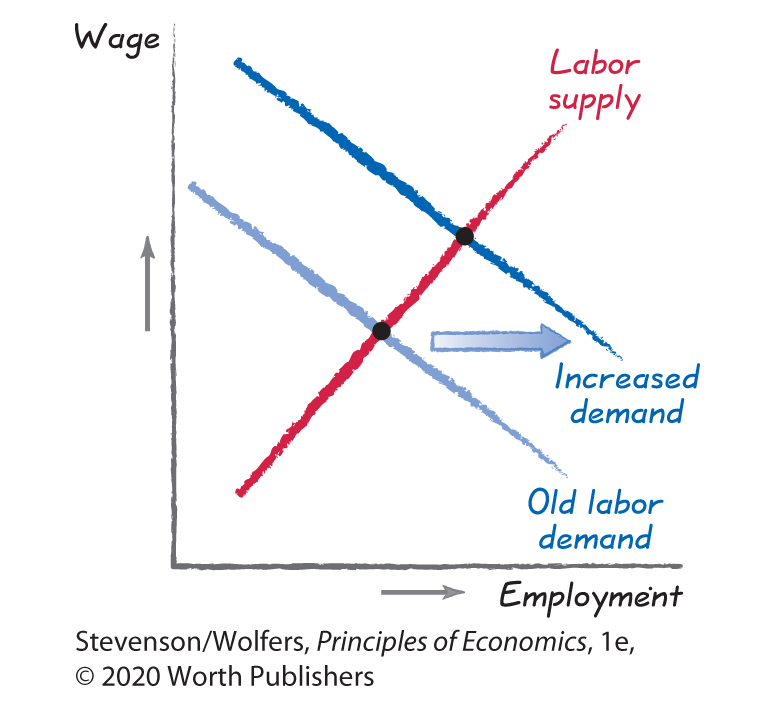
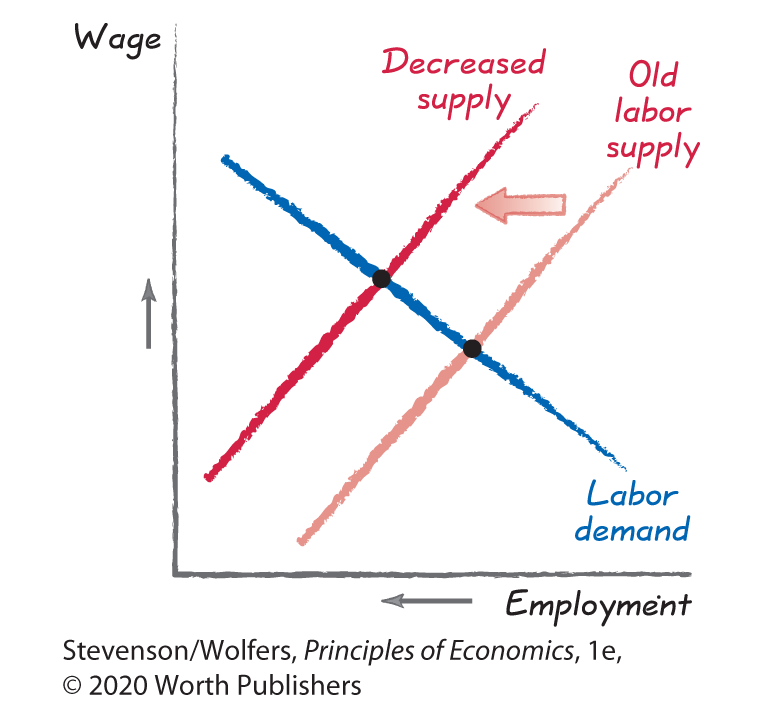
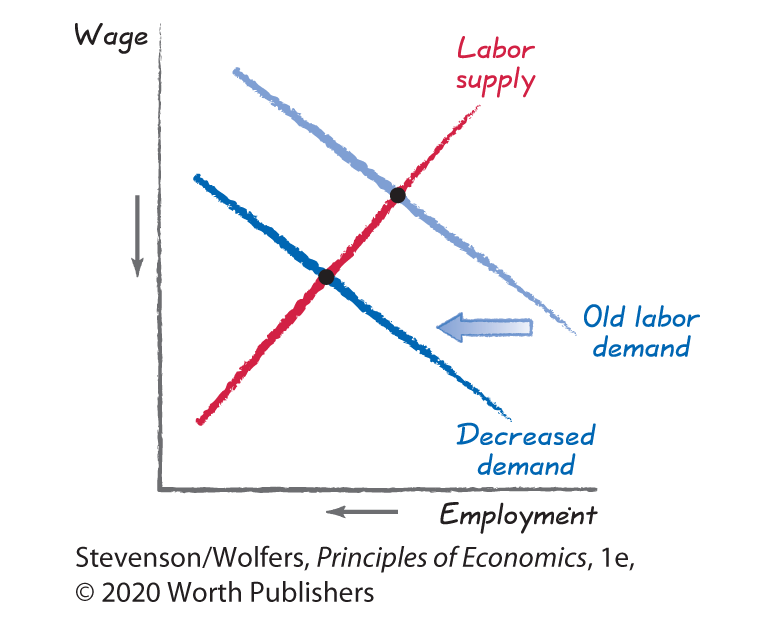
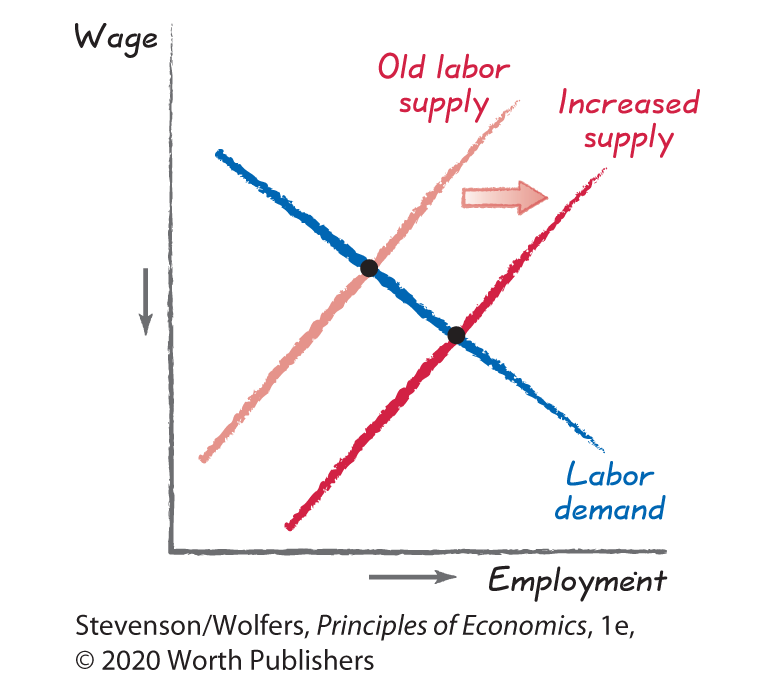
An increase in labor demand or an increase in labor supply will shift the corresponding curve to the right. A decrease in labor demand or a decrease in labor supply corresponds with a shift to the left.
Step three: How will wages and the number of jobs change in the new equilibrium?
Compare the new equilibrium with the old equilibrium.
Let’s start practicing, by evaluating how changing economic conditions might disrupt your labor market.
Do the Economics
- The price of statistical software and powerful computers falls. What happens to the labor market for data analysts?
- Cheaper price for complementary capital → An increase in labor demand
- Result: Higher wage, more jobs
- McDonald’s installs new kiosks at all of its restaurants, but doesn’t change the price of its burgers (so there’s no scale effect). What happens to the demand for cashiers?
- Substituting capital for labor → A decrease in labor demand
- Result: Lower wage, fewer jobs
- Congress passes an immigration bill reducing the number of foreigners with computer science degrees who can move to the United States. What happens to the labor market for computer programmers?
- Fewer potential workers → A decrease in labor supply
- Result: Higher wage, fewer jobs
- As the beef industry shrinks, the wages of large-animal vets have declined. What happens to the labor market for small-animal vets?
- Large-animal vets shift to working on small animals → An increase in labor supply
- Result: Lower wage, more jobs
- As baby boomers age, more people seek in-home elder care for their aging parents. What happens to the labor market for home-health aids?
- Rising demand for in-home elder care will raise the price, boosting the marginal revenue product → An increase in labor demand
- Result: Higher wage, more jobs
- Congress increases the generosity of unemployment insurance. What happens to the labor market in most occupations?

- An increase in the opportunity cost of work → A decrease in labor supply
- Result: Higher wage, fewer jobs
- Some economists believe that new videogames have made leisure time a lot more fun. What might this do to the labor market for young people?
- More enjoyable leisure represents a higher opportunity cost of work → A decrease in labor supply
- Result: Higher wage, fewer jobs
- Improvements in voice recognition software mean that court stenographers are no longer needed. What happens to the labor market for stenographers?
- A new technology that’s a substitute for stenographers → A decrease in labor demand
- Result: Lower wage, fewer jobs
- The federal government raises the minimum age to start collecting Social Security benefits from 62 to 65. What happens to the labor market for older workers?
- Lower opportunity cost of work (retirement is less tenable without social security) → An increase in labor supply
- Result: Lower wage, more jobs
- Nationwide budget shortfalls force many states to cut public school teacher pay. What happens to the labor market for private school teachers?
- Worse opportunities in alternative occupations → An increase in labor supply
- Result: Lower wage, more jobs
- Competition from Uber has forced limousine companies to cut their prices. What happens to the labor market for limo drivers?
- Lower output prices reduces marginal revenue product → A decrease in labor demand
- Result: Lower wage, fewer jobs
- A recession has led many colleges to reduce the financial aid they offer new students. What happens to the labor market for young people?
- More expensive college will lower the opportunity cost of work → An increase in labor supply
- Result: Lower wage, more jobs
