Whitney Battle-Baptiste and Britt Rusert
In his little-known speculative fiction “The Princess Steel” (ca. 1908–10), scholar, writer, and civil rights leader W. E. B. Du Bois weaves a tale about a black sociologist who stages a magnificent experiment on the top floor of a Manhattan skyscraper overlooking Broadway. At the center of this short story stands a megascope, a fictive technology that looks like a giant trumpet, laced with “silken cords like coiled electric wire,” and equipped with handles, eyepieces, and earpieces. When hooked up to the megascope, users are able to view the “Great Near,” Du Bois’s term for the always present but usually invisible structures of colonialism and racial capitalism that shape the organization of society. The vision produced by the megascope—a fantastical feudal allegory of primitive accumulation centered on an epic battle between two knights for possession of an African princess whose hair is made of steel—is generated in part by data contained in a massive set of volumes lining the wall of the laboratory, a vast set of demographic studies collected for over “200 years” by some kind of “Silent Brotherhood.” Dr. Hannibal Johnson, the sociologist and protagonist of the story, uses this data to plot what he calls the “Law of Life” onto a “thin transparent film, covered with tiny rectangular lines, and pierced with tiny holes,” and stretched over a large frame. He then goes on to plot what he calls “The Curve of Steel” onto a glittering, crystal globe suspended in the air and upon which the megascope’s feudal vision subsequently takes shape.1
In a story populated by mysterious scientists, annoying lovebirds, towering skyscrapers, battling knights, glimmering treasure, and a regal princess, it’s easy to miss that Du Bois’s “Silent Brotherhood” likely refers to an actually existing school of black sociology in the US South at the turn of the century, headed by Du Bois himself at Atlanta University.2 Furthermore, here at the beginning of his pulpy short fiction, Du Bois offers a narrative of what we would today call “data visualization,” the rendering of information in a visual format to help communicate data while also generating new patterns and knowledge through the act of visualization itself.
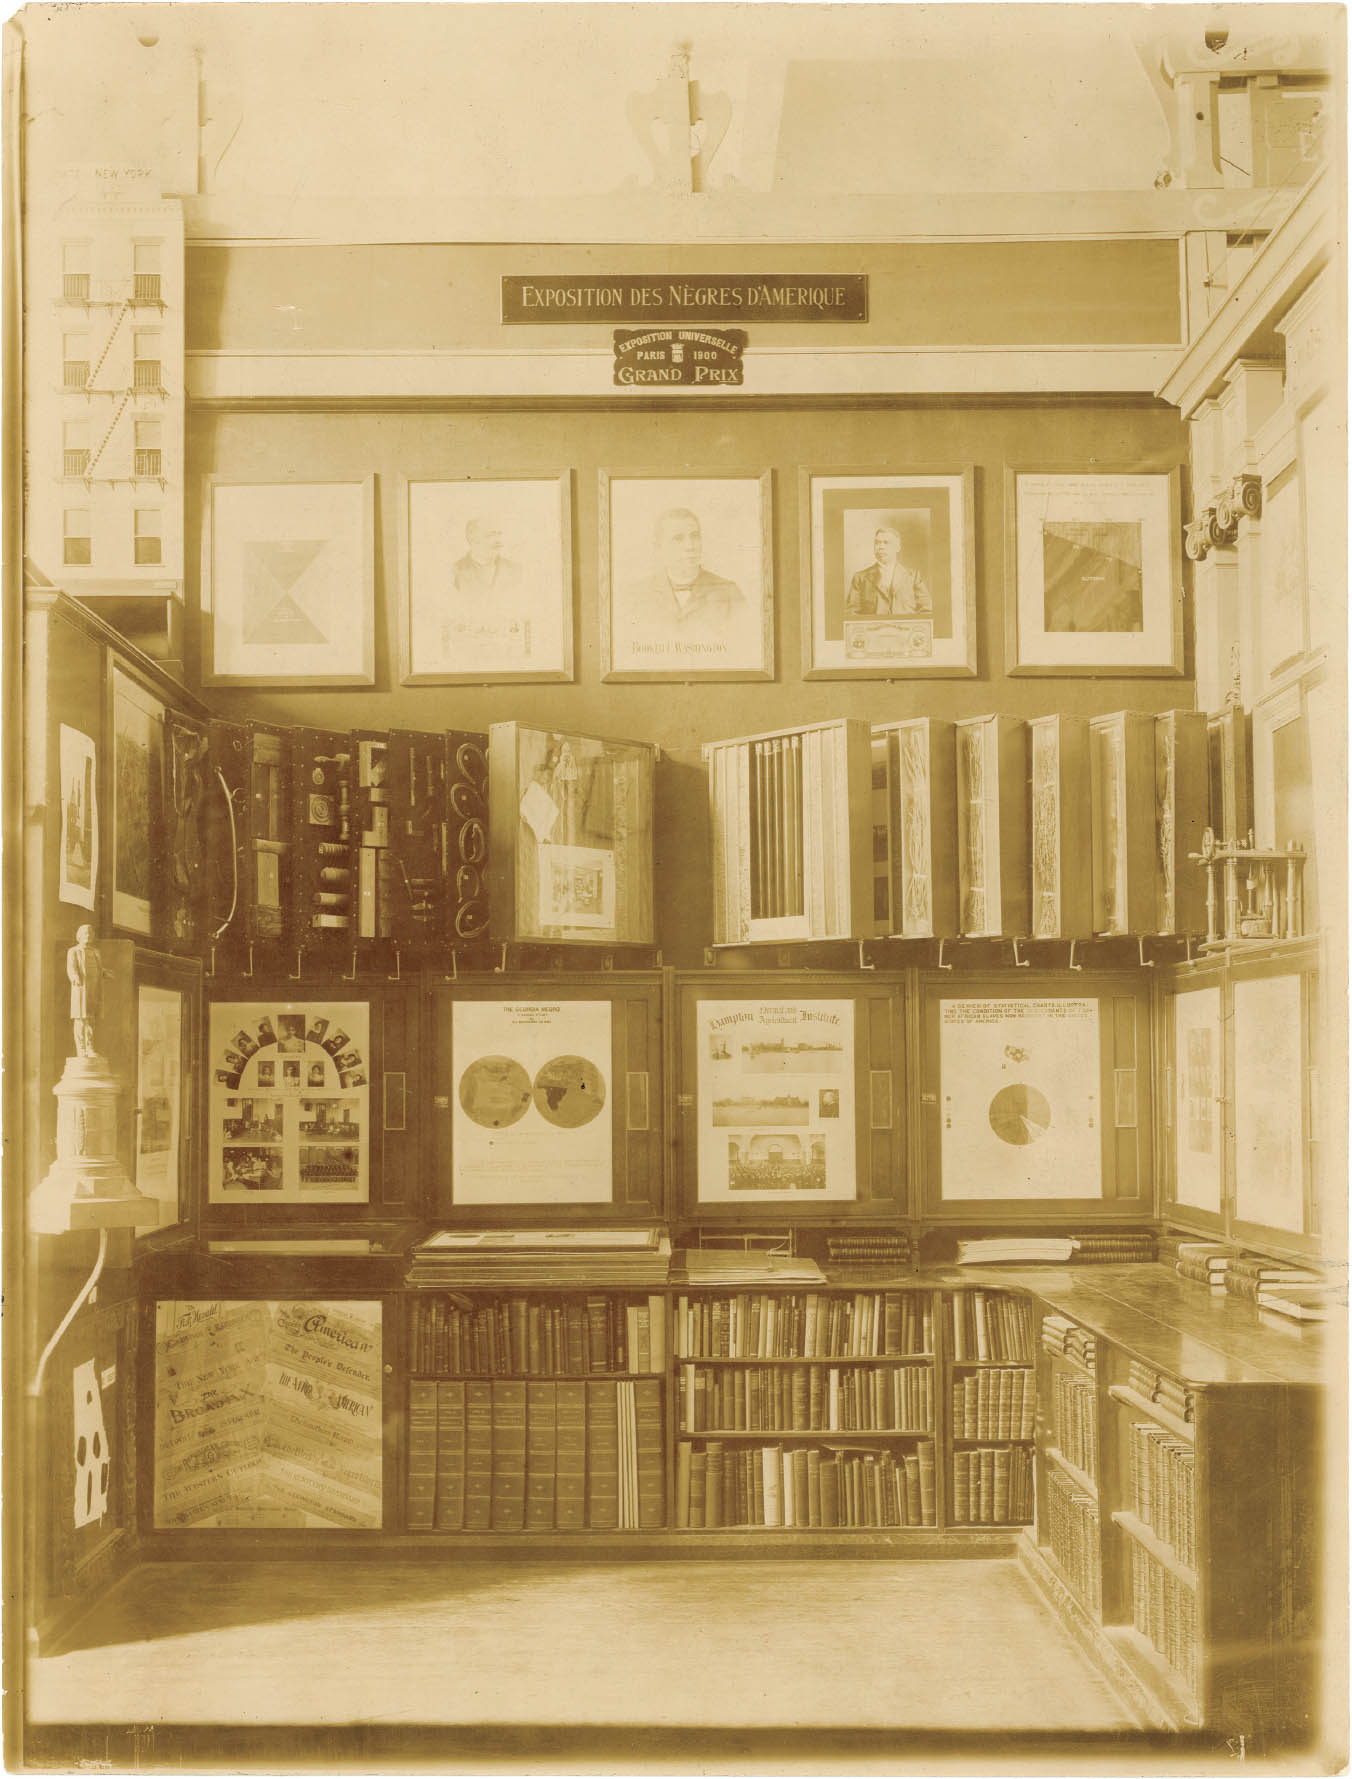
The visual projection of data in Du Bois’s sci-fi laboratory would be simply an interesting textual detail were it not for the fact that Du Bois himself had in 1900 contributed approximately sixty data visualizations, or infographics, to an exhibit at the Exposition Universelle in Paris dedicated to the progress made by African Americans since Emancipation. This Exposition des Nègres d’Amérique was organized by Thomas Junius Calloway, a lawyer, educator, Fisk University graduate, and editor of the Colored American newspaper in Washington, DC, who, with the endorsement and assistance of Booker T. Washington, successfully petitioned the United States government to include, as part of its showcasing of its industrial and imperial prowess as well as its commitment to social reform, an exhibit dedicated to African American life. The American Negro Exhibit featured many contributions by students and faculty at the Tuskegee Institute, Howard University, the Hampton Institute, and other black colleges and industrial schools. The installations that comprised the American Negro Exhibit were meant to educate patrons about the forms of education and uplift occurring at black institutions and in African American communities across the US South. The exhibit featured an eclectic set of objects, images, and texts, including framed photographic portraits of prominent African American leaders and politicians; tools, harnesses, and other agricultural products from black industrial schools; a bronze statuette of Frederick Douglass; and an on-site collection of over two hundred and fifty publications authored by African Americans and compiled by Daniel Alexander Payne Murray, a black intellectual, bibliographer, and librarian at the Library of Congress.
Calloway reached out to W. E. B. Du Bois, his former classmate and friend from Fisk, in the hopes that he would be willing to contribute a social study about African American life to the exhibit. Du Bois used this invitation as an opportunity to contribute two unique sets of data visualizations to the American Negro Exhibit. Heading a team composed of students and alumni from Atlanta University, Du Bois created a collection of graphs, charts, maps, and tables that were generated from a mix of existing records and empirical data that had been collected at Atlanta University by Du Bois’s sociological laboratory. Eugene F. Provenzo Jr., author of W. E. B. Du Bois’s Exhibit of American Negroes, notes that “most of the information for the charts was drawn from sources such as the United States Census, the Atlanta University Reports, and various governmental reports that had been compiled by Du Bois for groups such as the United States Bureau of Labor.”3
The first set of infographics created for the American Negro Exhibit was part of Du Bois’s The Georgia Negro: A Social Study, the study he prepared specifically for the Exposition Universelle at the request of Calloway. Representing the largest black population in any US state, Du Bois and his team used Georgia’s diverse and growing black population as a case study to demonstrate the progress made by African Americans since the Civil War.4 In addition to holding up Atlanta University’s home state as representative of black populations across the country, Du Bois and his team were interested in establishing the Black South’s place within and claim to global modernity.
The second set of infographics prepared by Du Bois and his team at Atlanta University was more national and global in scope. Titled A Series of Statistical Charts Illustrating the Condition of the Descendants of Former African Slaves Now in Residence in the United States of America, this set included renderings of national employment and education statistics, the distribution of black populations across the nation, a comparison of literacy rates in the United States relative to other countries, and other striking visualizations. Despite the existence of two separately titled series, important points of cross-reference and connection are visible across both sets of images. For example, the map depicting routes of the African slave trade (see plate 1), which served as the lead image for the Georgia study, situates Georgia (represented by a star) at the center of the map’s diasporic cartography, bringing the Georgia study into the orbit of the global scope of the second series while also maintaining its more local orientation.
While scholars have thoroughly explored the American Negro Exhibit, especially the photo albums curated by Du Bois and also exhibited as part of the Georgia study, this is the first time that the data visualizations are collected together in book form and reproduced in full color.5 We are particularly thrilled to present this collection of images in 2018, on the occasion of Du Bois’s 150th birthday celebration, and in conjunction with the work of the W. E. B. Du Bois Center at the University of Massachusetts Amherst, which also houses the W. E. B. Du Bois Papers. In addition to contributing a new vantage on the history of the American Negro Exhibit and African American participation in world’s fairs and expositions, we hope that the infographics might connect to other genealogies of black design and data visualization, from the centrality of visual design and format in Harlem Renaissance and Black Arts–era publishing, to the role of abstraction and conceptual aesthetics in black visual art in the twentieth- and twenty-first centuries.6 Produced at the fin de siècle, the infographics look back to a history of data visualization in the nineteenth century deeply connected to the institution of slavery, and the struggle against it, while looking forward to the forms of data collection and representation that would become central to representations and surveys of Harlem in the twentieth century. Indeed, these images anticipate the forms of “racial abstraction” that would come to define social scientific, visual, and fictional representations of Harlem beginning in the 1920s.7
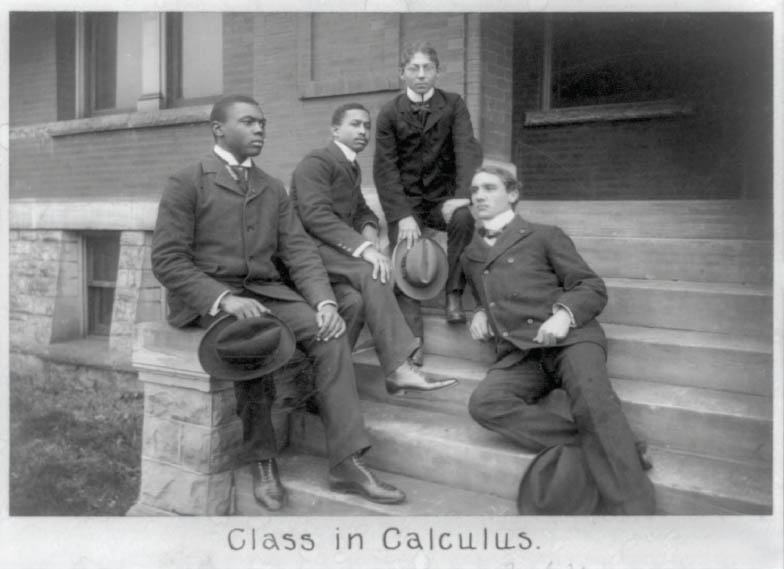
Fisk University, Nashville, Tennessee, ca. 1899.
Embedded within the consolidation of the social sciences—including sociology and statistics—in the late nineteenth century, the Du Bois data portraits reflect a moment just before the disciplines had hardened into the academic specializations and structures of knowledge that we are familiar with today. The cross-fertilization of visual art and social science here marks an important transitional moment in the history of the disciplines while offering alternative visions of how social scientific data might be made more accessible to the populations and people from whom such data is collected.
The collaborative nature of work that went into the construction of the images as well as their public exhibition illuminate Du Bois’s investment in a truly public sociology. Du Bois also turned to Atlanta alumni to construct a robust network of field researchers across the South. Black women were among the field researchers who contributed their expertise and labor to the Atlanta Studies.8 We might further speculate on how white working-class patrons touring the American Negro Exhibit in Paris interpreted and made meaning of this data on their own terms. Here, both viewers of the infographics and black study participants in the US South come into view as legitimate co-producers of sociological knowledge.
The striking aesthetic dimensions of the infographics are further worthy of reflection and study on their own terms. Indeed, the politics of visuality, and the very question of black visibility, were central to Du Bois’s thought, and his theory of double consciousness was expressed in a distinctly visual register.9 Du Bois used the term “double consciousness” to describe the experience of always seeing oneself through the eyes of another—a psychic alienation and social isolation produced by the “peculiar” condition of being black in America. This double or doubled consciousness was also, according to Du Bois, a kind of “second sight” that might be transformed from a curse into a “gift” that offered a unique and superior perspective on turn-of-the century race relations, sociability, and even existence itself.10 From his creation of the megascope in “The Princess Steel” to his appeal for a projector to enlarge and present his sociological data at Atlanta University, Du Bois’s thinking on the politics of the visual also extended to an interest in photography, film, and other visual technologies, as well as to the politics of access to these technologies. In addition to the infographics, the Georgia study also included three photo albums that visually represented the industry, beauty, and dignity of African Americans in the state. Deborah Willis notes that Du Bois, working as a compiler and curator of images solicited from Atlanta photographer Thomas Askew and other black Southern photographers, “used the camera as a collector of evidence to support his sociological findings.”11 We invite further reflection on the relationship between the Georgia study photo albums and the fascinating set of data portraits collected here. These charts, graphs, and maps visualize African Americans in ways that speak to but also diverge from the representational strategies used in black uplift photography at the turn of the twentieth century.
Looking back to his years at Atlanta University in his 1968 Autobiography, Du Bois wrote that he viewed the contribution of the infographics to the Paris Exposition as an opportunity to display the work of the Atlanta School of sociology to the “thinking world.” He goes on to note, “I got a couple of my best students and put a series of facts into charts....We made a most interesting set of drawings, limned on pasteboard cards about a yard square and mounted on a number of movable standards.”12 In a time when, as chronicled by Aldon Morris, the contributions of the Atlanta Sociological Laboratory were being obfuscated by the Chicago School of sociology, while a broader American culture was not ready to recognize the existence of a school of black sociologists in the US South, Du Bois turned to a visual medium—and the protomodernist aesthetics of turn-of-the-century data visualization— to gain the attention of an international audience.13 In opposition to the deeply allegorical and intentionally convoluted language that Du Bois deployed in his writings to convey the structures of oppression, alienation, and isolation under Jim Crow segregation—or what Du Bois termed “life within the Veil”—here Du Bois and his design team used clean lines, bright color, and a sparse style to visually convey the American color line to a European audience. This stylistic decision opens up questions about the aesthetics of the color line and their relationship to Du Bois’s famous proclamation in The Souls of Black Folk (1903) that “the problem of the twentieth century is the problem of the color-line” (see also plate 1: The Georgia Negro: A Social Study).14 This focus on modernist design, as well as the diasporic sensibilities of the images, further points to Du Bois’s interest in representing the Black South as an integral part of modernity, a “small nation of people” who shared more in common with the broader, future-oriented “thinking world” than with an insular, backward-looking United States, where Jim Crow segregation was the rule of the land. (See Mabel Wilson’s essay for a further exploration of the robust cartographic imaginary of Du Bois’s Georgia study.)
Later in his life, Du Bois recalled the contingencies and difficulties that surrounded the completion of this work for the Exposition Universelle, as well as the financial circumstances that nearly prevented him from accompanying his own exhibit:
The details of finishing these 50 or more charts, in colors, with accuracy, was terribly difficult with little money, limited time and not too much encouragement. I was threatened with nervous prostration before I was done and had little money left to buy passage to Paris, nor was there a cabin left for sale. But the exhibit would fail unless I was there. So at the last moment I bought passage in the steerage and went over and installed the work.15
This image of Du Bois traveling across the Atlantic in steerage—in close proximity to the hold of the ship—does not sit comfortably with our own image of Du Bois as a cultural elite and famous intellectual, nor does it reflect the same vision of racial progress and modernity represented in the infographics themselves. We see instead a Du Bois whose own person was less mobile than the graphs and charts sent ahead to Paris; a Du Bois who worked within the financial constraints of a black Southern college and was subject to uneven and precarious grant funding to support his research and travel.
Moreover, although non-white patrons could be more sure of their admittance to expositions in Europe than in the United States, all world’s fairs in the period, including the Paris Exposition, were deeply invested in visualizing social Darwinist theories of civilization that placed Europeans and Anglo-Americans above non-white peoples; they endorsed a vision of industrialization that equated progress with Anglo-Saxon superiority. While the American Negro Exhibit displayed the positive influence of activism and uplift within black communities in the United States, the broader logic of the Exposition, which imagined the white race as lifting up the rest of the world out of barbarism and backwardness, was still an imperial one.
Beyond the material and symbolic constraints posed by what Du Bois would recognize not just as a national but global regime of segregation by the end of World War I, the infographics are also marked by more material reminders of the weighty impress of a history of oppression on Du Bois’s present. A short write-up about the Atlanta University contribution to the Exposition Universelle in the Bulletin of Atlanta University (1900) includes a brief comment that one of the charts in the exhibit was displayed in a wooden frame carved by a former slave who lived in Atlanta.16 This elusive and fascinating detail regarding a physical object that has been since lost—a frame designed by an ex-slave— presents us with a stunning juxtaposition that points neither to historical progress nor to the overcoming of the slave past but to the ways that slavery continued to quite literally frame the present. Similarly, alongside the Georgia study’s data visualizations and photo albums, Du Bois included a three-volume, handwritten compilation of the Black Codes of Georgia, stretching from the slave codes of the colonial and antebellum period to the segregationist policies and laws of the present. In other words, once the data visualizations are contextualized within the broader exhibit and its contents, a much more complicated narrative emerges about the purpose and significations of these images. The presence of Georgia’s Black Codes, which sought to control and suppress black movement and social organization at every turn, ultimately conveyed not a utopian and happy narrative about black progress in a forward-looking, modern nation, but a sense of the gains that had been made by African Americans in spite of the machinery of white supremacist culture, policy, and law that surrounded them. In this way, the data portraits actually challenged the dominant framework of liberal freedom and progress that characterized both the American Negro Exhibit and the Paris Exposition.
After the Exposition Universelle closed in November 1900, the entire American Negro Exhibit was packed up, shipped, and displayed at a number of world’s fairs and other expositions back in the United States, gaining additional audiences—including African Americans— after its international debut in Paris. For example, a group of black clubwomen worked to bring the exhibit to the Pan-American Exposition in Buffalo, New York, in 1901. It’s clear that Du Bois also continued to think about the infographics he and his team prepared for the exhibit. In 1909, he even wrote Calloway to ask how he might secure the return of his exhibit from the Library of Congress, where artifacts and documents from the American Negro Exhibit had been deposited.17 The current existence of these images as a complete set in the collections of the Library of Congress (all of which have been digitized) suggests that Du Bois was either unable to secure their return or did not follow up with the library. While we can’t know what future plans Du Bois had for the infographics, we do know that they might take on a new life today, from inspiring forms of design and art-making connected to social justice work to their traction within digital projects and other initiatives that are, like Du Bois and his collaborators, envisioning how data might be reimagined as a form of accountability and even protest in the age of Black Lives Matter.18