Figure 4.1 Power in basic network exchanges: (a) two-node network, (b) three-node network, and (c) four-node network.
At the same time, as social beings, we are moved in the relations with our fellow beings by such feelings as sympathy, pride, hate, need for power, pity, and so on.
Albert Einstein
There exist a certain set of social dynamics that dictate how people form relationships. Social network analysis provides a context in which to understand how these forces work upon individuals. The framework of a hierarchy of social link motivation presented here is straightforward, designed by the authors, and serves to organize the vast research on social theory that drives link formation in networks.
Fundamentally, people need to feel valuable and this feeling is only validated in the presence of others. Cooley (1902) refers to this concept as the “looking glass self.” There are three components to this theory: (i) people consider how others perceive them, (ii) they imagine how others judge that appearance, and (iii) they develop self-identity through the perceived judgment of others (Yeung and Martin, 2003). The very activities that people pursue, the accomplishments that they take pride in are those that other people recognize as valuable. Psychologist Erik Erikson's theories on personality and identity have self-worth at the core of all stages of human development (Erikson, 1956; Marcia, 1966). Carl Rogers (1961) theories on personality and the self-concept are examples of social group validation of individual identity and self-worth. In essence people need to belong to a social group.
People are constrained, however, in the number of relationships they can maintain. British anthropologist Robin Dunbar (2010) suggested that there existed a cognitive limitation on the number of stable relationships a person can maintain. This did not include people who the individual knew in the past but had ceased a regular relationship with, nor did it include latent friends, where there was no regular contact. She used a model connecting the neocortical ratio to primary group size to predict that humans should have about 150 individuals in their primary social group. The neocortical ratio is the volume of the neocortex divided by volume of the remaining brain. Dunbar did not provide a precise definition of relationship. Killworth and Bernard (1979) conducted several empirical studies, which have shown this limit to be as high as 290 connections with a median of 231 links, which is based on empirical findings of observed human relations. Mayhew and Levinger (1976a, 1976b) show findings that suggest that the density of connections between actors is a function of the context of the relationship and the size of the population. Intuitively, we can also recognize that an individual has a finite amount of time in the day to invest in relationships. Thus, the number of links an actor maintains is a function of three main variables: the nature of the relationship (online, acquaintance, face-to-face friendship); the required amount of time invested to define that a relationship exists; and the cognitive limitations of the actor.
The need for self-worth to be validated by others and the actor's constraints in terms of time and cognitive limitations drive individuals to maximize the utility of their relationships (Lospinoso et al., 2009). They may choose to establish many low value ties, few high value ties, diverse ties across different social groups, among other strategies. This has several important implications for link formation in networks. First, individuals may derive different utility from different networks. Some networks may provide access to knowledge or resources, which make them valuable in another setting. Other networks may provide social entertainment. Different networks may provide love and security. Yet other networks may provide communities of interest for different hobbies, activities, and employment. Charles Kadushin (2012) identified these different networks as social circles.
Most individuals have membership in multiple social circles, and it is rare that two individuals will have all of their social circles in common. Feld (1981) explains this as Focus Theory. He describes social context as a set of foci and individuals. Individuals are related to the extent that they share a focus. Feld considers a focus to be a “social object,” which could be group membership, a work place, ethnic identity, attitude, and so on. He proposes that individuals' shared relations to foci create social circles and increase their likelihood for interaction. This is an explanation for overlapping patterns of network clusters. Maintaining membership in multiple social circles is also efficient from an optimization perspective. By maintaining relationships with a few individuals from disparate groups, an individual can have access to a wider variety of resources without the cost of establishing relationships with all members of the group.
Another key dynamic for network link formation is social exchange theory. People in positions of advantage within the network often exploit their position for advantage. Exchange theory was first presented by Homans (1958) and it suggests that all human relationships or social interactions are exchanges based upon an analysis of costs and benefits as well as analysis of alternatives. Social exchange theory evaluates the social associations analyzed in terms of the value of giving and receiving, and when the costs outweigh the benefits then the relationship breaks down.
The exchange process is complex as relationships can be interdependent and are context driven. Zafirovski (2005) observes that reciprocity compels exchange in social interaction, and relations do not continue where reciprocity is breached, as relations continue based upon the expectation that the interaction will be mutually beneficial. Blau (1994) believes the initial drive for social interaction is initiated by the perceived exchange of benefits, both intrinsic and extrinsic, regardless of cultural norms. Molm (1990) discovered that theories that neglect the effect of actors within given structural conditions are incomplete, and how much power an actor has and how it is used to respond to another's behavior are distinct determinants of exchange outcomes. Later research (Molm et al., 2000) on negotiated and reciprocal direct exchange showed that reciprocal exchanges produced stronger trust and commitment than negotiated exchange, and that behaviors indicating or confirming the partner's trustworthiness had a greater influence upon trust in the reciprocal exchange.
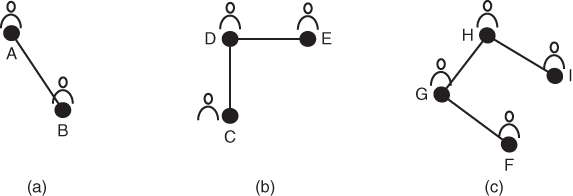
Emerson (1969) posits that reciprocity in social exchange links closely with the concepts of power, dependence, and cohesion. Power is derived from a position to control resources and hence wealth and is the property of a relation rather than an actor, because it is inextricably linked with the other's dependency (Emerson, 1962). It is not difficult to see how power can influence the outcomes of exchanges and stability of the associated networks. As networks can be combinations of complex relationships much research has been conducted at basic levels of exchange on very small networks in an effort to understand what happens at a more cellular level. A number of nodes are required to negotiate the split of given resources, commonly money. Figure 4.1 illustrates simple networks of two to four nodes in an exchange activity.
Figure 4.1 Power in basic network exchanges: (a) two-node network, (b) three-node network, and (c) four-node network.
The results are reasonably simple in a network of two nodes, say nodes A and B. The nodes negotiate and divide the resource, and the result is most commonly an equal split. In a three-node network consisting of nodes C, D, and E in Figure 4.1, node D has greater power as it is positioned between C and E and is able to negotiate with both these nodes. However, nodes C and E are only able to negotiate with node D. In the four-node network consisting of nodes F, G, H, and I, nodes G and H hold the greatest power as G can negotiate with F and H, and node H can negotiate with G and I. If any of the four nodes have a resource to share then nodes G and H are in the most favorable positions and can exert the most power on individual exchanges. They also stand to obtain the best outcomes. When you add other influences to relationships between nodes in a network, such as an organizational reporting responsibility, a homophilous belief or a reciprocal expectation, it becomes more difficult to isolate and quantify the effect of each influencing factor.
There are six key social forces that drive the formation of social links: homophily, reciprocity, proximity, prestige, transitivity, and balance. All of these drivers of link formation represent costs and benefits associated with establishing and maintaining links in a network.
Homophily deals with the tendency of individuals to form relations with those like themselves (Blau, 1977; McPherson et al., 2001). If two actors share common interests, beliefs, goals, race, gender, and/or culture, they are more likely to form connections than if they shared no common interests or features. This is often commonly termed birds of a feather flock together. Homophily increases the likelihood that alters will have values that reinforce the individual's self-worth. As people have multiple attribute characteristics, homophily must be evaluated across multiple dimensions, known as Blau-space (McPherson, 1983), named after the scientist who proposed the concept in 1977. Homophily is one of the most robust findings in social science.
Interesting studies have explored whether perceived homophily exists in networks, that is, peoples' perceptions of others' interests and beliefs drive their behavior. With perceived homophily, an individual's perceptions are updated through interaction, which may lead to dynamic changes in network behavior over time. Interaction can also create opportunities to modify ideology and value systems, which can contribute to social conformity and group think as actors become more similar in an unconscious effort to seek greater validation of self-worth.
Reciprocity is whether agents tend to form directed relationships with alters who initiate relationships with them. In other words, if agent A sends an email to agent B, does agent B tend to send emails back to agent A? From a utility perspective, it is easier to maintain a social relationship when the other actors take an active role in reaching out and reciprocating the relationship. Reciprocity may partially be an emergent property of homophily if two similar agents develop a reciprocal relationship due to their shared attributes.
Reciprocity has become a key aspect of social networking using social media and communications such as Facebook and Twitter blogs. Status is seen to be gained from the number of reciprocal contacts and conversations carried out and the number and prestige of connections are important for the perceived prestige of the individual. Communication between two peers would be expected to follow the following interaction format: user A sends user B a message and receives a reply, and the continuing exchange will be bidirectional and symmetric. However, if user A were to send multiple messages to user B who is a celebrity, it is highly unlikely that B will reply and the interaction is unreciprocated. Cheng and colleagues (2011) formulated an approach to predicting the symmetry of the interaction using node attributes that approximate the relative status of the two communication nodes. In closely knit groups based upon homophily the lack of reciprocity can weaken the ties between group members, making the group more fragile as members do not abide by the expected norms of the group.
Proximity is the organizational or physical distance between nodes. This can be organizational or physical. Organizational proximity refers to a semantic distance between groups in an organization. People that work together in shipping and receiving are closer in organizational proximity than they are to a person in manufacturing. They may have an even greater distance to a person in accounting, even if that section is physically closer to the shipping and receiving office. Within an organization, there are often common meetings, goals, and joint tasks, which provide opportunities for interaction. An individual in a different organization will often have conflicting demands. This phenomenon makes it easier for members of the same organization to interact than for members of different organizations. Thus, organizational distance creates a cost to link maintenance.
Physical proximity is the actual physical distance between individuals. Sailer and McCulloh (2011) showed that this was also based on perceptions. Individuals in an open office plan perceive distance based on how visible others are within the office, whereas with closed individual offices a metric distance equivalent to the number of paces an individual walks to interact with another is more appropriate. In either case, the closer actors are to one another, the more likely they are to interact and form relationships. Greater physical distance incurs a cost of link maintenance in terms of time to reach another node or in terms of the technological effort, such as a phone or email.
As groups form, social norms are established. A norm is a value of appropriate or inappropriate placed upon feeling, thought, or behavior. Friedkin (2001) suggests that shared belief in these values with influential others reinforces and validates the belief, thus creating the group norm. He further suggests that these norms provide an informal set of expectations, which provide opportunities for individuals to validate their sense of self-worth within the context of the group or social circle. An individual's choice to conform with the group is driven by their need for social acceptance and validation and a perception of how well the group's norms align with their positive attributes. Group membership can form an integral part of a person's individual identity.
The establishment of social norms provides a mechanism for two important concepts in social psychology, prestige and social conformity. Individuals who epitomize the social norms and values of the group not only derive a personal sense of self-worth, but also are perceived by others to be valuable. These individuals have high prestige and hold greater influence over the attitudes and ideology of group members. They are also able to influence group norms that may emerge in the future. Other members of the group will often choose to link to high prestige nodes for greater validation of their own self-worth.
Perceived motivation can influence individual status within the group as well (Ridgeway, 1978; 1982). Low status individuals who are perceived to be group-oriented combined with reasonable task proficiency tend to attain higher status levels over time. By contrast, individuals who are low status and are perceived to be self-oriented tend to remain low status. High status individuals tend to remain high status regardless of their motivation as long as their task proficiency remains high.
Prestige can also be achieved in terms of an individual's access to resources, knowledge, and other social circles. Within this context prestige can be deliberately improved. A node can strategically develop ties between social circles that will benefit one another, thereby increasing their value. They can position themselves within close proximity to others in the network, increasing their opportunities for social interaction. Individuals can demonstrate an adoption of group values making themselves more homophilous to others in the group. Finally, simply being outgoing may leverage the concept of reciprocity by reducing the link maintenance cost of others.
The concept of prestige enables high prestige nodes to maintain more links with less cost. As group members have a desire to connect to a high prestige node, they are willing to overcome other social costs such as a lack of proximity, reciprocity, or homophily, although nodes that exhibit low social cost are even more attractive. This does not mean that a prestigious node is unconstrained, however. They still must make some effort to maintain the relationship from their end. These nodes also must maintain social norms in order to retain their prestige within the group. This can sometimes be challenging if prestigious individuals choose to affiliate with social circles that may have competing social norms.
Individuals who do not adopt group norms will have reduced opportunity to validate their sense of self-worth. Conforming to the group norms provides them an opportunity to validate their sense of self-worth. This mechanism drives social conformity.
There is a social network group effect that contributes to conformity. That is, research shows repeatedly that groups can exert implicit pressure to influence opinions leading to higher conformity, more extreme views, and a group think mentality where contradictory evidence is ignored. For example, Solomon Asch (1955, 1956) conducted a study, where subjects were placed in a group, where the other group members were given information that was different from reality. For example, eight individuals (the subject and seven others) were shown three lines of various lengths and asked to verbally identify which line matched a given fourth line. The subject was positioned to answer after the seven other individuals. Most of the time, the seven other individuals would give a correct response, but in certain cases, the other subjects would agree on a wrong answer. Asch then measured how the subject would modify their answers based on the majority opinion. The objective of the experiment was to understand factors that would enable people to resist group/peer pressure.
The study found that 37% of the subjects conformed to the wrong responses given by the majority. It was not clear if the subjects actually believed their incorrect response (informational conformity), or if they were simply conforming to the group so they were not singled out (normative conformity). A variation of this experiment had one of the seven other individuals give correct responses, and the conformity dropped from 37% to 5.5%. These findings suggest that an individual's perception of reality, to include their attitudes, may be significantly influenced by other people to whom they are socially connected.
McCulloh (2013) conducted a social network variation of Asch's experiment using a platoon in the US Army. Social network data was collected on the platoon, recording directional ties of self-reported friendship and respect, creating two sets of network data on the same subjects. Four nodes that were highly central in both networks and four nodes that were peripheral in both networks were selected to be the subject of an Asch type experiment. Eight other nodes in the network were selected to serve as confederates of the experiment. Instead of asking participants to offer opinions on line length, the individuals were told that they were preparing for promotion boards and were being tested on military knowledge. Some of the questions were modified to offer an obviously wrong answer. The most ridiculous question was, “when do you apply a tourniquet to a neck wound? (i) when it is spurting blood; (ii) when it is coming from an artery; or (iii) never.”
This study demonstrated a profound network effect on conformity. Central nodes conformed to the group and provided wrong answers 7% of the time on average. Peripheral nodes, however, conformed 62% of the time. The strongest correlation between centrality and the number of wrong answers occurred with betweenness centrality in the friendship network with a correlation of  .
.
This study provides evidence of the need for social acceptance. Individuals who are peripheral and have need of social acceptance may conform as a way to gain group acceptance. Central actors who already have a sense of acceptance are free to identify the “wrong” answers without fear of group sanction.
Mcculloh et al. (2010) studied the social network effects on post-traumatic stress disorder (PTSD). They recorded data on the mental health of 1000 soldiers in a US Army brigade at three time periods; 2 months prior to deployment, 3 months into their deployment, and 2 months following their 1 year deployment to Afghanistan. They found that peripheral individuals in the friendship network were more likely to exhibit symptoms of PTSD and depression. In a similar series of studies on isolated groups at the South Pole, Jeff Johnson et al. (2003) discovered that peripheral individuals would often develop thyroid problems, which is related to depression. Thus, individuals may have a physiological need for social acceptance and conformity is a defense mechanism to achieve that acceptance.
In the famous Milgram Experiment (Milgram 1963, 1974) conducted at Yale University, Milgram studied the willingness of people to obey perceived authority figures, when their instructions conflicted with moral conscience. He found that 26 of the 40 subjects (65%) followed the immoral instructions. This suggests that people can be influenced to a greater degree, by a minority of people, if the minority is seen as authority figures. These authority figures derive their authority informally from epitomizing group norms, as well as formally. Thus nodes with high centrality may serve as an opinion leader for the group.
At the point where people have joined various social circles, derived some benefit from their associations, and potentially conformed to group norms, they are in a position to optimize the utility they derive from their social circles. There are several mechanisms for this behavior: transitivity, social capital, link optimization, and balance. These may not be conscious mechanisms, but they are powerful social forces that describe many dynamics of informal networks.
Transitivity of relations means that if there is a link from actor A to actor B, and a link from actor A to actor C then there is a tendency for actor B and actor C to form a link with each other. In other words, connections are formed through a common connection to a third party. The underlying social mechanism for transitivity may overlap competing social forces. If homophily has driven the links between actors A and B and between actors A and C, then there would be similar attributes that would drive the connection between actors B and C in a homophilous relation. On the other hand, if the connection involves time spent in social interaction, actors B and C would have greater opportunities to meet through their shared proximity to actor A. Therefore there are three potential confounded explanations behind transitivity. Transitivity may be an emergent network property based on (i) homophily, (ii) proximity, or (iii) brokered social relations from a common friend or acquaintance.
Modeling transitivity in statistical models and simulations can present major problems, which argue in favor of the emergent property perspective. If actors attempt to establish transitive links in a network, then the tendency would be for networks to have one giant fully connected component and many isolate nodes with no connection to the network. This usually does not represent observed network behavior. These models are degenerate in that the empirical data is extremely improbable under the models estimated from the same data.
An improvement to the concept of transitivity is geometrically weighted edgewise shared partners (GWESP) (Hunter and Handcock, 2006). This approach models a diminishing marginal return in the utility for additional shared transitive links. In other words, if two actors share a connection to a common alter, they are more likely to establish a link. If they have three alters in common they are even more likely. Four alters are more likely still. However, if they have 20–30 alters in common and have not established a link, there is probably a good reason for it. Thus, each additional shared alter is less important in terms of utility. The rate at which this decays is a geometric parameter in the GWESP model. This approach has much better modeling properties. It is rarely degenerate and thus supports the theory of utility as a mechanism of establishing social links.
Sometimes transitivity can be deliberately employed by an actor to increase their utility within the context of one or more social circles. One of the benefits of social relations is the access to knowledge and resources. Nodes that occupy a network position in between a key resource and others in the network derive informal power as discussed in Chapter 2. However, they also incur a social burden and cost to maintain relationships with the two groups (those with the resource and those requiring the resource). Brokering an introduction can provide an actor the opportunity to derive a sense of self-worth and value by facilitating a group's access to the resource, without the requirement to maintain the links, especially if the volume of resource flow is large (Feld, 1981).
Links do not always represent positive affinity and in some cases negative affinity may affect positive social relations. Balance (Heider, 1946; Cartwright and Harary, 1956) is an aggregate level measure that tests whether “the enemy of my enemy is my friend.” If two actors that are “friends” have the same affinity to another there is balance. If the two friends have differing affinity to another there is a cognitive dissonance. Cognitive dissonance (Festinger, 1957) is a discomfort resulting from holding conflicting views at the same time. For example, a person who smokes must reconcile their desire for a long healthy life with the fact that smoking is likely to cause lung cancer and other health issues. People have a strong desire to reduce dissonance by altering their views and beliefs or changing their behavior. The smoker might therefore deny the evidence of health concerns associated with smoking or they may attempt to quit smoking.
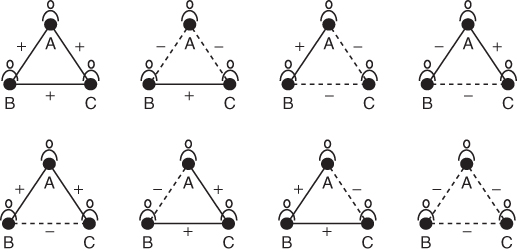
In a network application, when an actor has positive affinity for two alters who dislike each other, there is dissonance. He must reconcile his positive affinity with his “friends” to their negative affinity toward the third alter. This may cause the actor to change his views toward one of the other alters to reduce the dissonance. Consider the eight possible triads in Figure 4.2 given only positive and negative relationships. You can think of these as “love-hate” triangles. The top four triangles with an even number of negative ties are balanced. The bottom four triangles with an odd number of negative ties have cognitive dissonance. In these four cases there will exist a social force placing pressure on one of the unbalanced triads to move toward balance.
Figure 4.2 Eight possible signed triads.
Note the appropriate social force next to the explanation for the following statements (choose from social forces: Homophily, Reciprocity, Proximity, Prestige, Social Conformity, Transitivity, Balance).
Several theories have natural extensions to graph level measures and properties. Balance, in particular, lays the foundation for Structural Balance and Clusterability in networks that are briefly presented here.
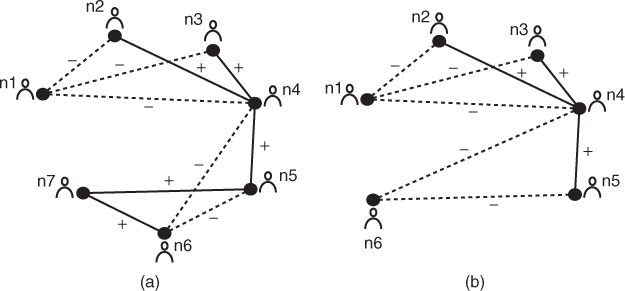
Structural Balance is a graph level measure that will lie between 0 and 1, just like centralization. A structural balance of 1 means a graph is perfectly balanced, and a 0 means none of the triads are balanced. Figure 4.3a and b is an example of unbalanced and balanced graphs. Each link in the two graphs is labeled as either positive or negative. Balanced triads will reflect one of the four structures in the top row of the signed triads in Figure 4.2 and unbalanced triads will demonstrate a structure in the lower triad row.
Figure 4.3 Two signed graphs: (a) unbalanced network and (b) balanced network.
Clusterability (Davis, 1967) is an aggregate level measure that describes how well the network can be partitioned into teams. Imagine a parliament of legislative body with two political parties. Suppose that one party's members all like each other, but dislike all members of the opposing party. The other party is similar with all its members liking each other and disliking all members of the opposing party. In this case, we would see a signed adjacency matrix that looks like this:
Draw the network depicted by the above signed adjacency matrix, A, and determine if any clusters are present.
Clusterability can be determined by reordering the nodes in the adjacency matrix to place positive and negative relations next to each other as shown in the adjacency matrix above. The first three nodes in the adjacency matrix have positive relations in the top left partition of the adjacency matrix, which shows links to other nodes in this group. There are negative ties to other nodes in the network. The lower right partition also has all positive links. This example network is therefore perfectly clustered with three nodes in each group. If there was any dissent within the parties, the graph is no longer perfectly clusterable. Unlike structural balance, clusterability is NOT a sliding scale measure. A graph is either clusterable or it is not.
Some actors in a network will employ various strategies to optimize the value they derive from a social network. Value can be defined in several ways. It may consist of the access to resources that they gain. It may be the power they derive from brokering resources. It may be the social acceptance value they derive from being central. There are several key strategies, which include structural holes, social capital, and link optimization.
An actor may attempt to maintain a position as the sole broker between two groups. Ron Burt (1995, 2009) describes the emergent network pattern as structural holes. Although the actor's position does provide him an informal power in the network, it can be very difficult to maintain. Most individuals view this type of position negatively and these actors can be sanctioned by the group in other ways. Others in the group will inevitably seek to develop redundant ties separate from the broker to reduce their dependence on him and increase their own utility in the network. Actors attempting to maintain structural holes, therefore, must spend time preventing links from emerging and this behavior reduces collaboration, knowledge, and resource sharing across the organization. Conversely, transitivity increases collaboration, knowledge, and resource sharing and can still provide the actor with informal power derived from his ability to connect to others.
The ability of an actor to connect to others in the network and provide access to knowledge and resources through their social connections is known as social capital (Bourdieu 1979, 1980, 2008; Coleman, 1988). There is value in collaboration and knowledge. Some managers do not understand this concept and actually unwittingly destroy social capital within their organizations. These managers see their employees chatting in the break-room, going to the designated smoking area to indulge their habit, or otherwise socializing instead of completing some assigned task. The managers view this type of interaction as the employee wasting time or having a poor work ethic. In reality, these social interactions provide unique opportunities for people in disparate parts of an organization to interact and exchange knowledge and information. These activities enable employees to establish new links throughout the organization. These employees now act as high betweenness nodes brokering knowledge and resources. Successful managers will often attempt to create unique opportunities to facilitate social interaction and collaboration and view chatting in the break-room as a valuable investment in organizational capacity and social capital.
Social capital does not come free. There is a cost in terms of time, social expectations, and resources to develop and maintain friendships. Not all actors within an organization will provide the same value, so social capital investments must be made wisely. Link optimization can facilitate the efficient acquisition of social capital.
Link Optimization is a concept proposed by Cornell sociologist Matthew Brashears (2011). He describes two aspects of social relations: bandwidth and latency, which is referred to in this text as frequency and intimacy, respectively. Frequent positive interactions with an individual will increase the perceived utility of the connection. A friend or coworker that you see several times a week will usually feel like a stronger, more valuable connection than someone you have not seen in years, all else being equal. Intimacy also increases the perceived utility of the connection. As people share secrets, experiences or exchange favors, their level of intimacy increases, but this intimacy does not necessarily entail high frequency of interaction.
Consider two potential actors, a household nanny and your best friend since childhood. The nanny has frequent interaction with you, whereas you might not have seen your childhood friend in years and only speak on the phone a couple times per month. Although the nanny has some level of intimacy in that she works in your home and deals with your children, she has probably not shared the depth of intimate experiences with you as your childhood friend. If you had an important decision to make or needed a favor, who would you feel more comfortable calling upon? On the other hand, if you wanted to know about what happened on last night's episode of your favorite television program, who would you be more likely to ask?
The two aspects of social relations can be plotted as shown in Figure 4.4. The  -axis shows the frequency of interaction and the
  -axis shows the intimacy. Different categories of social connections can be expressed in different quadrants of the chart. Quadrant I may include close family members or a spouse. Quadrant II would consist of old, yet close friends or family. Quadrant III consists of strangers. Quadrant IV is made up of coworkers or people with membership in civic organizations. Pareto optimality curves can be expressed over the space represented in Figure 4.4. Relationship strength follows the gradient moving from quadrant III to quadrant I. As the strength of the link increases, the derivative benefit or utility also increases. Unfortunately, the cost associated with maintaining the link may also increase. Connections in quadrant I will have additional expectations associated with maintaining a friendship. In addition to the time cost, they may be called upon for favors and be required to tolerate inconvenience for the sake of maintaining the relationship.
Figure 4.4 Pareto optimality space.
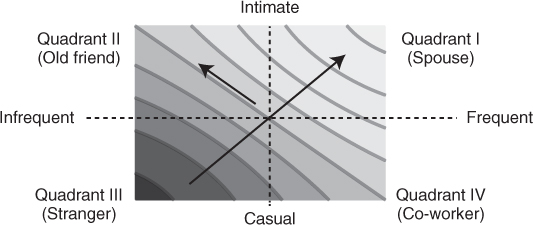
Orthogonal to the strength of relationship is the latency of relationship. Alters classified in quadrant II do not require much investment of time and resources to maintain the association; however, they may still be called upon when needed. This may drive individuals to invest in intimacy to facilitate latent associations as well as develop strong connections. Recently, social media has significantly enabled latency by lowering the cost of maintaining links. This enables people to keep alters in a place where they can be called upon for their utility value when needed with little to no maintenance cost.
In some cases, online media can significantly reduce the costs to maintain a link. Without the cognitive and temporal limitations on the number of links a node can have, some nodes can amass very large numbers of connections. This is common for Web site connections, where once a link is established, there is no cost required to maintain the link. Popular Web sites are able to exploit their prestige and position in the network to acquire more and more links. This enables scale-free networks where there exist hub nodes with many links, although most nodes have relatively few links. The term scale-free is derived from the power-law distribution of node degree, which does not have a scale parameter in the distribution. This type of network structure is not possible in face-to-face networks where cognitive limitations on degree exist. People are not unaware of this phenomenon. A card in the mail is often more meaningful than a “happy birthday” on Facebook.
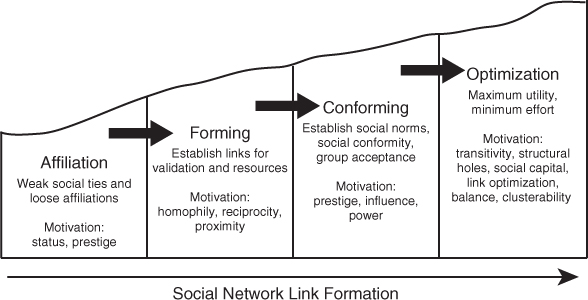
To present theories of social links in a unified frame, the authors posit a hierarchy of motivations in the formation of social links. The hierarchy comprises four stages: Affiliation, Forming, Conforming, and Optimization (see Fig. 4.5). In stage 1 (Affiliation), nodes attempt to validate a sense of self-worth through social acceptance or access resources by identifying and affiliating with social circles. This stage is characterized with largely weak social ties to loose affiliations, where there exists a perceived benefit. The status of alters may affect interactions when people first meet in this stage. Thus, prestige is an important social force during this stage. In stage 2 (Forming), nodes attempt to establish links with alters that present the greatest probability of success in terms of validation or resources. Social forces such as homophily, reciprocity, and proximity are paramount. As an actor establishes themselves in the social group, they eventually move to stage 3 (Conforming). In this stage, actors exhibit characteristics of social conformity as they attempt to gain greater group acceptance and establish relationships with high prestige alters. Social forces such as prestige become primary. With an adequate level of group acceptance, a node moves to stage 4 (Optimization). In stage 4, nodes attempt to maintain or increase their utility derived from relationships while minimizing their effort and social costs to maintain links that have been established. Concepts such as transitivity, structural holes, social capital, link optimization, balance, and clusterability provide more significant motivators for link formation.
Figure 4.5 Four stages of link formation.
During situations when small groups are forming and all actors enter a social circle at the same time, there are no established opinion leaders, group norms, or high prestige nodes. This affects the dynamics of link formation. In this situation, stage 1 has already occurred by the assignment of individuals to the group. For example, a cohort of graduate students admitted to a masters degree program have all applied for and been accepted into a program of study. The individuals passed through stage 1 Affiliation in their application process. They will have decided that the graduate program is a worthy pursuit that provides them some sense of self-worth or increased status by hopeful attainment of the degree. Thus the small-group formation begins with nodes in stage 2 Forming. Tuckman (1965) and Tuckman and Jensen (1977) describes this as the first stage in small-group formation, which he labels as “testing and dependence.” Individuals determine who they will study with, who they will ask for peer assistance on assignments, and who they will seek social relationships with. With no established authority figures, individuals moving into stage 3 conforming have difficulty in determining what social norms to conform to and whom the group sees as prestigious. This manifests itself with Tuckman's “intra-group conflict.” Individuals attempt to assert roles and group values that further their own objectives. As individuals progress into stage 4 optimization, they establish their role in the newly formed group as well as the relationships that maximize their perceived value. Through this process, the group will establish social norms and individuals who epitomize those norms will increase in prestige. Tuckman refers to this as “development of group cohesion.” This is where the group establishes a group identity and established routines. At this point, Tuckman introduces an additional stage for small-group development, which he labels “functional role relatedness.” In this stage, the group reaches its highest level of productivity. Tuckman combines group formation with task activity and summarizes the combined model as “forming, storming, norming, and performing.” Table 4.1 shows stages of social link motivation with corresponding stages of small-group development. In this newly formed group, as new individuals join, group norms and functions are already established. New actors will still test relationships and establish dependence through homphily, reciprocity, and proximity. However, as individuals move toward the subsequent stage, they will have greater tendency to conform to established group norms and there is less intra-group conflict. As these actors optimize their relationships, they assume a new role in the group identity and aid the group in fulfilling its functional role.
Table 4.1 Stages of Social Link Motivation and Stages of Small-Group Development
| Social link motivation | Small-group development |
| Stage 1—Affiliation | |
| Stage 2—Forming | Stage 1—Forming: testing and dependence |
| Stage 3—Conforming | Stage 2—Storming: intra-group conflict |
| Stage 4—Optimization | Stage 3—Norming: development of group cohesion |
| Stage 4—Performing: functional role relatedness |
The following are the main points covered in this chapter
4.1 Use the three concepts of the “looking glass self” to describe your sense of self-identity.
4.2 How many social circles do you affiliate with? List them and provide a short description of the group. What value do you gain from those relationships?
4.3 Construct a Blau-space. Think of two social circles and two attributes of individuals that might be in those social circles. Draw  and
and  axes corresponding to the two attributes and plot individuals from the groups based on your numerical evaluation of their attributes. Draw circles that encompass each of the two groups. Do they overlap? What conclusions can you draw about relationship formation?
4.4 How does proximity drive the formation of social relations? How can a common employee lounge area in an office increase collaboration? If you were a manager of a knowledge intensive organization, what kind of policies and practices would you implement to increase social interaction?
4.5 What strategies can an individual employ to increase their prestige within a social group?
4.6 Balance theory applied to a two-party political system would suggest that all members of one political party have affinity for each other and animosity for the opposing party. Why is this not observed in real networks? Can you think of any examples of real-world clusterable networks?
4.7 Consider the last time you entered a new social setting. Perhaps it was your arrival at college, starting a new job, or attending church for the first time. What characteristics did you look for in those individuals whom you initiated relationships with? Why did you develop the relationships you did?
Asch, S. E. (1955). Opinions and social pressure. Nature, 176:1009–1011.
Asch, S. E. (1956). Studies of independence and conformity: I. A minority of one against a unanimous majority. Psychological Monographs: General and Applied, 70(9):1–70.
Blau, P. M. (1977). Inequality and Heterogeneity: A Primitive Theory of Social Structure. Free Press.
Blau, P. M. (1994). Structural Contexts of Opportunities Structural Contexts of Opportunities. University of Chicago Press.
Bourdieu, P. (1979). The three states of cultural capital. Proceedings of the Social Science Research, 30(30):3–6.
Bourdieu, P. (1980). The social capital. Proceedings of the Social Science Research, 31(31):2–3.
Bourdieu, P. (2008). The forms of capital. In Biggart, N.W., editors. Readings in Economic Sociology. Blackwell Publishers Ltd.
Brashears, M. (2011). Homophily and link atrophy. In Quantification, Metrics and Modeling, Durham, NC. Duke University Workshop on Weak Social Ties.
Burt, R. (1995). Structural Holes: The Social Structure of Competition. Harvard University Press.
Burt, R. (2009). Structural holes: The Social Structure of Competition, Social Science Research Network Working Paper Series.
Cartwright, D. and Harary, F. (1956). Structural balance: a generalization of heider's theory. Psychological Review, 63(5):277–293.
Cheng, J., Romero, D., Meeder, B., and Kleinberg, J. (2011). Predicting reciprocity in social networks. In Privacy, Security, Risk and Trust (PASSAT), 2011 IEEE Third International Conference on Social Computing (SocialCom), pp. 49–56, October.
Coleman, J. S. (1988). Social capital in the creation of human capital. The American Journal of Sociology, 94:95–120.
Cooley, C. H. (1902). Human nature and the social order. In Scibner's Conference, New York, pp. 183–184.
Davis, J. (1967). Clustering and structural balance in graphs. Human Relations, 20(2):181–187.
Dunbar, R. (2010). How Many Friends Does One Person Need?: Dunbar's Number and Other Evolutionary Quirks. Faber and Faber.
Emerson, R. (1962). Power-dependence relations. American Sociological Review, 27(1):31–41.
Emerson, R. (1969). Operant psychology and exchange theory. In Robert, B. and Bushell, D., editors, Bevahiorial Sociology, pp. 379–408. Columbia University Press, New York.
Erikson, E. (1956). The problem of ego identity. Journal of the American Psychoanalytic Association, 4(1):56–121.
Feld, S. (1981). The focused organization of social ties. American Journal of Sociology, 86(5):1015–1035.
Festinger, L. (1957). A Theory of Cognitive Dissonance. Stanford University Press.
Friedkin, N. (2001). Norm formation in social influence networks. Social Networks, 23(3):167–189.
Heider, F. (1946). Attitudes and cognitive organization. The Journal of Psychology: Interdisciplinary and Applied, 21(1):107–112.
Homans, G. (1958). Social behavior as exchange. The American Journal of Sociology, 63(6):597–606.
Hunter, D. R. and Handcock, M. S. (2006). Inference in curved exponential family models for networks. Journal of Computational and Graphical Statistics, 15(3).
Johnson, J., Boster, J., and Palinkas, L. (2003). Social roles and the evolution of networks in extreme and isolated environments. Journal of Mathematical Sociology, 27:89–121.
Kadushin, C. (2012). Understanding Social Networks: Theories, Concepts, and Findings. Oxford University Press, illustrated edition.
Killworth, P. and Bernard, H. (1979). Informant accuracy in social network data iii. Social Networks, 2:19–46.
Lospinoso, J., McCulloh, I., and Carley, K. (2009). Utility seeking in complex social systems: an applied longitudinal network study on command and control. In Social Networks and Multi-Agent Systems Symposium (SNAMAS-09), Edinburgh, Scotland. Heriot-Watt University, SSAISB.
Marcia, J. E. (1966). Development and validation of ego identity status. Journal of Personality and Social Psychology, 3:551–558.
Mayhew, B. H. and Levinger, R. L. (1976a). On the emergence of oligarchy in human interaction. American Journal of Sociology, 81(5):1017–1049.
Mayhew, B. H. and Levinger, R. L. (1976b). Size and the density of interaction in human aggregates. American Journal of Sociology, 82(1):86–110.
Mcculloh, I., Geraci, J., Turner, J., and Matthews, M. (2010). Network centrality and PTSD. In Proceedings of SunBelt XXX, Social Networks and Health. International Network for Social Network Analysis.
McCulloh, I. A. (2013). Social conformity in networks. Connections.
McPherson, M. (1983). An ecology of affiliation. American Sociological Review, 48(4):519–532.
McPherson, M., Lovin, L., and Cook, J. (2001). Birds of a feather: homophily in social networks. Annual Review of Sociology, 27(1):415–444.
Milgram, S. (1963). Behavioral study of obedience. Journal of Abnormal Psychology, 67:371–378.
Milgram, S. (1974). Obedience to Authority: An Experimental View. Harpercollins.
Molm, L. (1990). Structure, action, and outcomes: the dynamics of power in social exchange. American Sociological Review, 55(3):427–447.
Molm, L., Takahashi, N., and Peterson, G. (2000). Risk and trust in social exchange: an experimental test of a classical proposition. American Journal of Sociology, 105(5):1396–1427.
Ridgeway, C. L. (1978). Conformity, group-oriented motivation, and status attainment in small groups. Social Psychology, 41(3):175–188.
Ridgeway, C. L. (1982). Status in groups: The importance of motivation. American Sociological Review, 47(1):76–88.
Rogers, C. R. (1961). On Becoming A Person. Houghton Mifflin.
Sailer, K. and McCulloh, I. (2011). Social networks and spatial configuration–how office layouts drive social interaction. Social Networks.
Tuckman, B. W. (1965). Developmental sequence in small groups. Psychological Bulletin, 63(6):384–399.
Tuckman, B. W. and Jensen, M. (1977). Stages of small-group development revisited. Group & Organization Management, 2(4):419–427.
Yeung, K.-T. and Martin, J. L. (2003). The looking glass self: an empirical test and elaboration. Social Forces, 81(3):843–879.
Zafirovski, M. (2005). Social exchange theory under scrutiny: a positive critique of its economic-behaviorist formulations. Electronic Journal of Sociology, 2:1–40.