Chapter 5: Subgroup Analysis
We must remember that one determined person can make a significant difference, and that a small group of determined people can change the course of history.
Sonya Johnson
Learning Objectives
1. Know the difference between Newman, Consecutive Correlation (CONCOR), and user-defined grouping algorithms.
2. Develop a blockmodel of a social network based on one of the grouping algorithms.
3. Demonstrate the ability to create and interpret a hierarchical clustering diagram, density matrix, reduced network, and attribute analysis table.
5.1 Subgroups
Subgroup analysis is an important approach for understanding the structure of a network as well as assessing organizational risk in networks. Subgroup analysis is carried out to more fully understand the clustering of nodes into subgroups, usually linked by a common factor or positioned close to each other within the network (Wasserman and Faust, 1994; Krackhardt, 1994; Kadushin, 1995). A substantial amount of prior research has been carried out on the groupings of actors who interact frequently and on how individuals are influenced by these interactions. Network groups can have sparse or dense interactions within the group. Early organizational studies reported that large organizations comprise separate subgroups showing dense interactions (Freeman, 1992). Subgroups within organizations were found to link in order for the organization to evolve or for reasons of management efficiency (Simon, 1962; Granovetter, 1973). Organizations of today are focused on teams and group connectivity and can affect the efficiency and effectiveness of work practices, competitive advantage, and ultimately organizational survival. Interactions between groups impact not only strategic alignment and performance in the attainment of organizational goals but also the creation and sharing of knowledge that in turn feeds innovation. Analysis of the interactions between group members and external nodes is also of interest when measuring the isolation of the group. In some circumstances isolation may be desirable, but undesirable in others.
In this chapter, we must first paint the context for which subgroup analysis is useful. An overview of organizational theory is presented as a foundation to aid our understanding of groups within organizational contexts. The structural importance of subgroups is then discussed including derivation of the probability of groups forming at random. With this context in place, three popular subgroup heuristics are presented and compared: Newman–Girvan (2004), CONCOR (Breiger et al., 1975), and user-defined grouping approaches. Common methods for analyzing the groups are demonstrated on the Newman–Girvan grouping heuristic.
5.2 Organizational Theory
Organizational theory is a collection of sociological and psychological theories of groups for the purpose of improving productivity, maximizing efficiency, and facilitation of group problem solving. There are three common perspectives for understanding organizational theory: classical, neo-classical, and environmental. The classical perspective is concerned with increasing efficiency and productivity by designing organizational structures, rules, and expertise. An early pioneer in the study of organizations, Frederick Taylor (1911), introduced scientific management for “knowing exactly what you want men to do and then see in that they do it in the best and cheapest way.” He identified four principles: (i) scientific measurement of performance, (ii) training of workers, (iii) cooperation between management and workers to ensure productivity, and (iv) division of labor where workers and management specialize in specific tasks and roles.
Another classical theory is Bureaucracy theory, introduced by Max Weber (Gerth and Wright Mills, 1948), which focuses on the part of an organization that implements rules, laws, and functions of the group. Individuals assume well-defined roles in this organization with established policies for conduct and performance. Neutral parties, for example, make decisions for career advancement based on individual performance, thus removing personal bias from the process.
There are several important limitations for viewing organizations from the classical perspective. Most important is Taylor's initial assumption…“knowing exactly what you want men to do…” Scientific management and bureaucracy are better suited to production and manufacturing processes or standard administrative functions, where the task is well defined and repetitive. For knowledge-intensive organizations focused on creative problem solving or knowledge development, there is no concept of “what you want men to do.” It is by definition of purpose left undefined. Furthermore, the classic approach omits human needs and concerns. Human error, the variability of performance, motivations, and individual goals are rarely considered with this approach. These limitations provide the basis for a neo-classical approach.
The most fundamental principle in the neo-classical perspective is the Hawthorne effect (Mayo, 1933, 1945; Whitehead, 1938; Roethlisberger and Dickson, 1939; Roethlisberger, 1941), which emerged out of a series of human produc tivity experiments at Western Electrics Hawthorne Works facility outside of Chicago, IL. The Hawthorne effect is a phenomenon where individuals alter their behavior as a result of their awareness that they are being observed and measured. This introduced a social-psychological dimension to workplace productivity. Mayo's work in particular asserted that humans were unique and motivated differently and are not interchangeable parts. His work has been criticized as counter to Taylor's scientific management approach. However controversial, Mayo paved the way for organizational theorists to study motivation, employee satisfaction, peer social relations, and leadership in organizations.
Within the context of social link theory (Chapter 4), motivation, employee satisfaction, and peer relations can perhaps be better understood. An individual worker will initially affiliate with an organization in order to access financial or other resources of benefit. The nature of this organization becomes a social circle with an inherent group culture. Individuals are driven to form social relations to gain acceptance. Individuals conform to the organizational culture to achieve validation and prestige within the culturally defined norms. These standards might be performance driven, qualification based, or derived from interpersonal relations. Financial incentives might provide a sense of value in certain organizations, such as financial investment firms or large corporations. We argue that it is not so much the money as it is the value it conveys that is important. In the US military, status is derived from combat tours and specialized military qualifications such as ranger, or paratrooper. Financial incentives are not as effective as status in motivating this workforce. Other extensions of the Hawthorne studies have revealed non-financial incentives for productivity. Thus, an understanding of social link theory provides an alternate frame of reference to understand group and individual motivation. This is at the heart of informal power brokerage. One may ask why a low ranking individual, who is highly central within an organization's social network, may have high informal power, which is more influential in motivating group behavior than the formal power a designated leader is assigned. We contend that this is precisely the issue that Mayo was concerned with understanding, and social network analysis provides an insightful frame of reference to conceptualize this phenomenon.
The most recent perspective in organizational theory is the environmental perspective. This approach argues that there is no universally best practice for organizing, leading, or decision making for a particular type of organization. Organizational design must therefore not only consider the function of the organization, but it must also contend with internal social dynamics of the individual members, current and desired organizational culture, informal power brokers and opinion leaders, changing external environment that may affect the organizations purpose, and more. This approach requires a manager to understand the social terrain of their employees and recognize that the organization may not actually be interacting as programmed.
Regardless of perspective, organizations can be classified into one of six structure types (Daft and Armstrong, 2009): prebureaucracy, bureaucracy, postbureaucracy, functional, divisional, and matrix. The prebureaucracy structure lacks any standardization of role or task and a central leader makes all decisions. This type of structure is usually confined to small organizations engaged in completing simple tasks.
The bureaucracy is defined as an organization that has standardized roles and is focused on efficiency. Weber proposes three criteria for a bureaucracy: (i) clearly defined roles and responsibilities, (ii) hierarchical structure, and (iii) value for merit (as defined by the organizational culture). This structure is well suited for larger organizations engaged in well-defined activities. Again, the primary advantage of the bureaucracy is efficiency; however, it is usually achieved at the cost of reduced flexibility and innovation.
The postbureaucracy (Heckscher and Donnellon, 1994), also referred to as organic, is the opposite of a bureaucracy. There are no standardized roles, responsibilities, or formal leadership. There is no hierarchy. Decisions are made through discourse and consensus. This type of organization is common among cooperatives, community organizations, and nonprofit organizations. It encourages participation and empowers individuals who may not otherwise have a voice in the decision-making process. The primary advantage of this organization is its flexibility, innovation, and commitment of membership; however, these goals are achieved at the cost of efficiency.
The functional structure is defined as an organization where groups are formed based on specialized expertise. For example, there may exist a sales team, an engineering division, and an accounting office. Or in a manufacturing process, casting, milling, shaping, joining, and assembly might all fall in separate divisions, where production flow moves back and forth between divisions and competes with other product lines for processing. Functional structures increase skill capacity through divisional mentorship, training, and oversight. However, they lose some efficiency in cross-divisional collaboration that might inhibit the development of new products and cross-disciplinary problem solving. This structure is best suited for organizations that conduct a limited set of tasks or produce a limited amount of products at high volume and low cost.
The divisional structure is constructed such that it has each functional element within it and can operate almost independently from other divisions. Sometimes divisions are organized geographically such as the United States, Australia, or EU divisions. Alternately, divisions may be organized around product lines such as consumer goods, commercial goods, and industrial goods. Each division may even have its own marketing and sales departments. The advantage of this structure is its flexibility to adjust to changing environments and operate independently; however, it comes at the cost of reduced functional expertise.
The matrix structure combines the functional and divisional structures. The organization frequently uses teams to accomplish tasks. Matrix structures may have weak/functional management, where a project manager oversees the product, whereas functional managers retain most decision making and control over the functional employees. Other organizations may have a strong/project management, where project managers control the project and functional leaders provide technical expertise and assign resources as needed. Balanced management shares responsibility equally between functional managers and project managers. This organizational structure strikes a hybrid between other structures with the associated strengths and weaknesses.
Depending on the organization's purpose and function, subgroup analysis provides a valuable frame of reference for understanding organizations. Social links may be defined between individuals as affinity, advice seeking, communication, collaboration, perceived usefulness, frequency of interaction, or other forms of relationship. Identifying subgroups by defined organizational structure allows the network analyst to evaluate whether the organizational structure is performing as designed or if a new structure might improve performance. Additionally, methods such as Newman grouping can identify self-organizing subgroups that may provide insight into organizational design.
The purpose of a manager or leader in any organization is to define goals and motivate organization members to maximize their productivity and efficiency. Social network analysis provides powerful tools and theory to understand important social dynamics that affect every aspect of an organization. The remainder of this chapter will present several techniques and theories for understanding subgroups within social networks. Identifying subgroups also allows an investigator to study networks of organizations in addition to individual actors.
5.3 Random Groups
Consider for a moment that the probability of a node being connected to another node occurs completely at random with the flip of a coin (probability is 0.5). Then, the probability of getting a unique sequence of 1s and 0s is  . Therefore the probability of two nodes being exactly structurally equivalent (have exactly the same connections) is also
  . In an eight-node network for example, the probability of two nodes being structurally equivalent is
  . If we looked at a network of only 30 nodes this probability would be 0.0000000186. Therefore, even in small networks the probability of two nodes even knowing similar people is quite small. However, in practice it is not unusual for people to have similar acquaintances. This is because there is some reason for the social interactions, such as shared membership in an organization or some of the social forces presented in Chapter 4. The reason for structural grouping in networks is precisely what makes subgroup analysis so important.
5.4 Heuristics for Subgroup Identification
Networks can be partitioned into subgroups based on the similarity between nodes. There are several ways a node can be similar, however, which has led to multiple approaches for assigning group membership. Three approaches are presented in this chapter: Attribute Defined, CONCOR (Breiger et al., 1975), and Newman–Girvan (2004).
5.4.1 Attribute Defined
The simplest approach to assign nodes to subgroups is by a predefined attribute. This is often done in organizational studies where the attribute is the work section within an organization. For example, a company might have sections such as shipping and receiving, production, sales, customer service, research and development, and management. There is usually a desire to understand how collaborative these sections are with one another. One might hope that there is a lot of interaction between customer service and research and development or between production and sales for example. Assigning individuals by a defined attribute allows exploration of intergroup collaboration.
Assigning nodes to groups based on a predetermined attribute is essentially a straightforward method to defining the groups without the use of any algorithm or heuristic approach. The attributes may represent node characteristics to study potential homophilous social circles, also known as Blau-space. Alternatively, the attribute might be the pre-designated grouping such as formal structures within an organization. When groups are pre-designated, subgroup analysis methods such as block models can be used to explore organizational collaboration and function.
5.4.2 Consecutive Correlation (CONCOR)
Consider an adjacency matrix for a social network. The CONCOR heuristic correlates the rows or columns of the adjacency matrix, creating a new matrix that contains the correlation between node connections. CONCOR then takes iterative correlations of this new matrix. This process will converge such that nodes are correlated with a  or a
or a  , thus partitioning the network into two groups. This procedure can be executed multiple times, each time bifurcating the network in two. Therefore, executing the algorithm three times should partition the network into eight groups. It is possible, however, that no nodes would be assigned to one of the groups in the case of structural equivalence between nodes.
CONCOR is typically used to identify role redundancy within a network. There is a certain amount of redundancy that is necessary within an organization. Identifying nodes that are similar in their connections can assist the analyst in strengthening and coordinating activities of redundant nodes. In other cases, there may be too much redundancy, such as after a merger, acquisition, or joint venture. Management may wish to reassign individuals to other activities within the organization or make other labor decisions. CONCOR can assist by identifying similar individuals.
5.4.3 Newman–Girvan Grouping
Another approach is the Newman–Girvan grouping, commonly referred to as simply Newman grouping. The Newman grouping iteratively identifies edges that are high in betweenness. This is similar to betweenness centrality; however, the algorithm looks for the edges that fall on geodesics most frequently. The highest edge in betweenness is removed and the edge betweenness is recalculated. The next edge that is highest in betweenness is removed and so forth. This process is repeated until a specified number of subgroups are found or until a specified ratio of in-group links to out-group links is achieved. Thus, the number of subgroups can be specified or the algorithm can determine the number of subgroups.
The Newman group is excellent for identifying network clusters. The clusters are naturally formed groups that essentially have no probability of occurring at random, as shown earlier. An analyst can explore the network to attempt to identify the reason for the social grouping. This is a common approach when there are no attribute defined groups.
Check on Learning
Which subgroup analysis method is used to find clusters of related nodes and/or cliques?
Answer
Newman–Girvan grouping. The attribute defined groupings do not necessarily consist of related nodes. They could be anything that the analyst defines. The CONCOR grouping identifies nodes with similar connections, which usually identifies role redundancy, but not necessarily clusters. The Newman–Girvan grouping iteratively deletes links with high betweenness, revealing clusters of related nodes.
5.5 Analysis Methods
We examine three analysis methods for investigating subgroups in a network. They are the group membership method, the hierarchical clustering method, and the block model method (White et al., 1976). These methods will be demonstrated using example network graph and adjacency matrix (Fig. 5.1 and Table 5.1).
Table 5.1 Adjacency Matrix for Example Graph
5.5.1 Group Membership
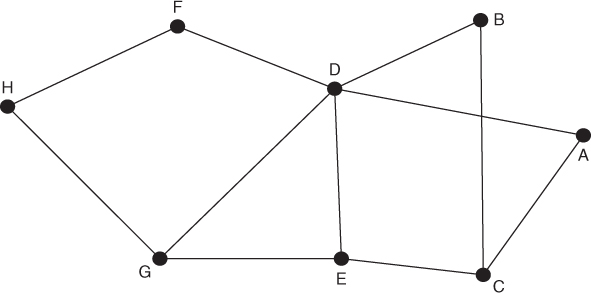
The group membership analysis method investigates the assignment of nodes to different groups. It can be seen in Table 5.2 and Table 5.3 that the Newman grouping and CONCOR grouping will group the nodes in the network differently. In the Newman grouping, the groups are close together in the network. Looking once more at the Example Network graph (Fig. 5.1), Group 1 comprising nodes A, B, and C appears at the right of the network. Group 2 consisting of nodes D, E, and F appears in the center of the network. Nodes G and H, forming Group 3, appear at the left of the network. In contrast, the groups in the CONCOR grouping are based on the correlation or similarity of connections. Nodes A, B, and H are all similar in their connection to node D and their lack of connections to nodes E and F. As node C is connected to node E, it is excluded from this group. Nodes C, D, and G are similar in their connections to Group 1; however, none of them are connected to each other. This group may fulfill similar or redundant roles in the organization. Nodes E and F are similar in their connection to Group 2 and their lack of connection to Group 1.
Table 5.2 Newman Grouping
| 1 |
3 |
A,B,C |
| 2 |
3 |
D,E,F |
| 3 |
4 |
G,H |
Table 5.3 CONCOR Grouping
| 1 |
3 |
A,B,H |
| 2 |
3 |
C,D,G |
| 3 |
4 |
E,F |
Check on Learning
Which grouping algorithm do we need in order to find out the following information from our social network of employees and clients? There are only two node types in our network: agent (employee) and agent (client). Employee node information includes their name, store location, department, gender, and pay level. Client node information includes their name, address, age, and gender.
1. Does gender matter when linking employees and clients? We want to know which female employees connect with female clients, female employees with male clients, and finally male employees with male clients.
2. We want to remove duplications in the relationships between employees and clients. Which employees are connected to the same clients?
3. We want to know who works in the same department. All employees have links with the other employees in their department but few links with employees in other departments.
4. We want to minimize our pay costs. Which employees present the highest cost in pay and which are the lowest pay cost?
5. Who are the clients who connect with employees in more than one department?
Answer
1. Newman grouping.
2. CONCOR grouping.
3. Attribute grouping on department, and Newman grouping.
4. Attribute grouping on pay level.
5. CONCOR grouping.
5.5.2 Hierarchical Clustering
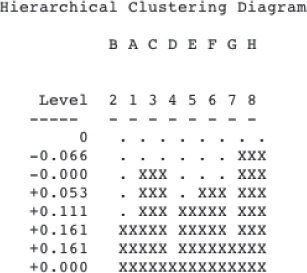
The hierarchical clustering diagram depicted in Figure 5.2 provides a visual chart of the similarity between nodes in a network. The dots along the top row indicate that at some level all of the nodes are isolated. At the next level, nodes G and H have the closest relationship. At the next level, nodes A and C have the closest relationship. At the next level, nodes E and F have the closest relationship. Then, at the next level, node D is added to the E–F group. Then B is added to the A–C group. At this point, the network is clustered into three groups, which is what the Newman grouping returned as the optimal number of subgroups. However, you could continue grouping and connect the D–E–F group with the G–H group and finally connect the whole network as one complete group. This diagram provides some insight into the group formation and the sensitivity of the network to a grouping threshold.
5.5.3 Block Model
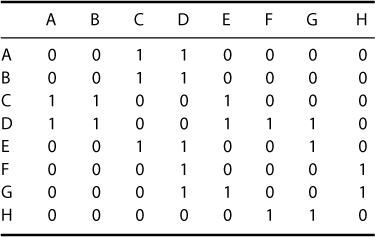
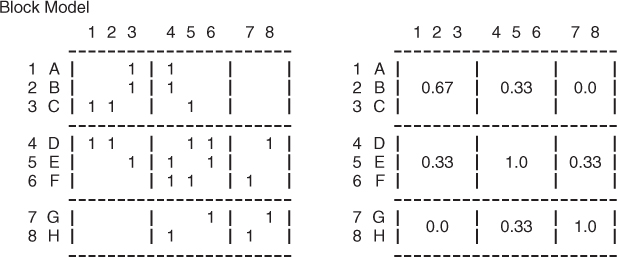
Once the groups have been determined, a block model diagram depicted in Figure 5.3 provides some very important insight into group dynamics. The nodes are arranged in the rows and columns of the adjacency matrix such that they are listed next to other nodes within their group. Lines are drawn between the groups. Compare the block model (Fig. 5.3) to the original adjacency matrix, Table 5.1. In this case the original adjacency matrix is listed in the same order as the subgroupings, but this is not always the case.
Block densities can be determined by calculating the number of links in each block divided by the number of possible links. For this example, in the upper left block between nodes A,B,C, and themselves (1,2,3) there are  or six possible links. Recall that the diagonal of the adjacency matrix is undefined, disregarding the possibility of reflexive links. There are actually four links present out of the six possible, so the block density is 0.67. The block connecting A, B, C to D, E, and F (4,5,6) has
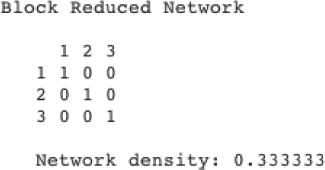
  or nine possible links, as the diagonal is included in this block and all potential entries are possible. The block density is therefore three out of nine possible or 0.33. The block densities provide insight into the coordination and connections between subgroups in the network. Figure 5.4 depicts the construction of a reduced network where the nodes of this new network are the subgroups and the links are connections between subgroups. This is extremely powerful for exploring collaboration within an organization. Subgroups with high informal power and brokerage or diffusion reach can also be determined.
There are three ways to determine the connections between subgroups. The fully connected approach would argue that for a subgroup to be connected to itself or another group, all of the nodes of one group must be connected to all of the nodes of the other group. Under this criterion, subgroup 2 is connected to itself because D is connected to E and F and E is connected to F. Subgroup 3 is connected to itself because G and H are connected to each other. Subgroup 1 is not connected to itself because node A is not connected to node B.
The minimally connected approach would argue that if one member of one group is connected to one member of another group, there is a connection between the groups. Under this criterion, the only groups that are not connected are Groups 1 and 3, because there are no connections between node G to A, B, or C and there are no connections between node H to A, B, or C.
The most widely accepted method for determining subgroup links in a reduced network is to compare the block density with the original density of the network (input network density). In this example, the original network density is 0.393. The only block densities that exceed the input network density are those along the diagonal. Thus the input network density approach would identify cohesive subgroups.
The external/internal link analysis can provide some further insight into how well groups collaborate with each other within the network. This analysis compares the number of internal links within the subgroup to the number of links that nodes in the subgroup have with nodes outside the subgroup. The silo index provides a score that ranges from  to 1 to show how isolated a particular subgroup is. If 50% of the links from a subgroup are internal or external, then the silo index is 0. If a subgroup has more internal links than external links the silo index will be positive (Table 5.4).
Table 5.4 External/Internal Link Analysis
Example 5.1
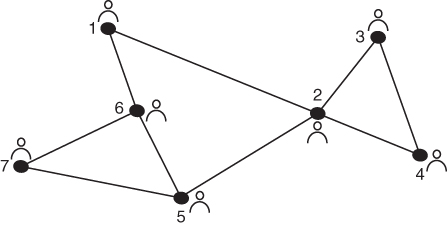
For the network depicted in Figure 5.5 determine the Newman grouping.
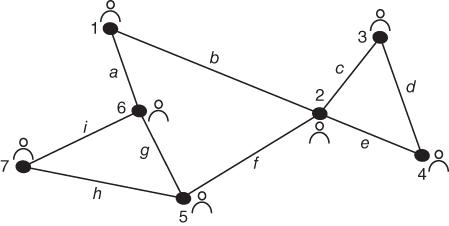
The first step of performing a Newman grouping is to label the edges so that they can be treated as nodes for betweenness calculations. Figure 5.6 illustrates the process.
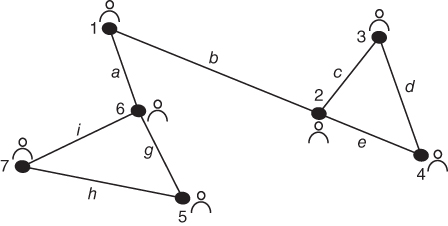
Next, we calculate edge betweenness for the entire network using the methods given in Chapter 2. In this case, edge “f” has the highest betweenness and is therefore removed. See Figure 5.7. At this point it is intuitively clear to see that edge “a” and edge “b” have the same betweenness. We randomly choose “b,”, but one might choose “a” as well based on some prior iteration of the algorithm. After removal of edge “b”, we see the first fracture of the network into two separate pieces illustrated by Figure 5.8.
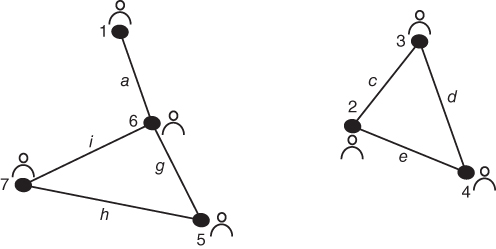
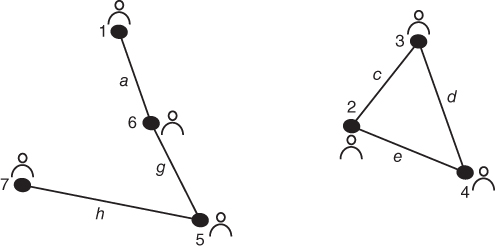
Calculating edge betweenness again reveals that edges “i” and “g” have the same betweenness value. Choosing “i” arbitrarily produces the network depicted in Figure 5.9.
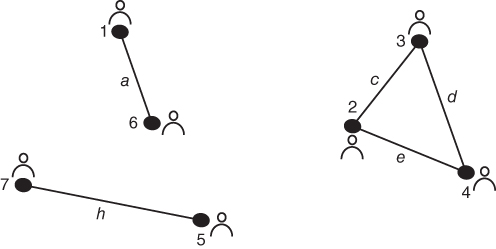
The final edge betweenness calculation identifies “g” as the edge to be removed giving us the final version of the network with three clusters identified. Figure 5.10 depicts the network after the final iteration of the Newman grouping algorithm.
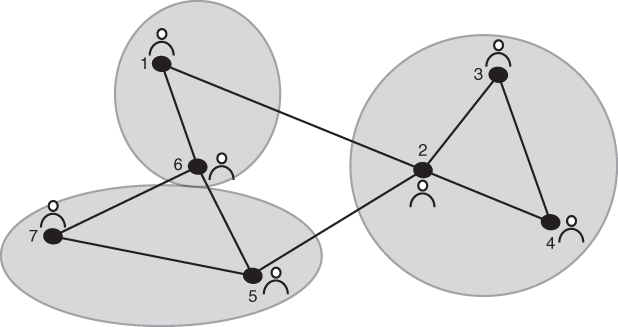
Figure 5.11 is the Newman grouping for the network. Now we can see that the closest ties are nodes 1 and 6, 5, and 7, and 2, 3, and 4.
Example 5.2
Using the Newman grouping of Example 5.1, create a hierarchical clustering diagram for the social network.
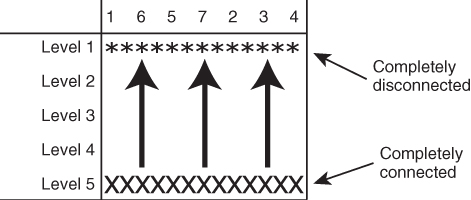
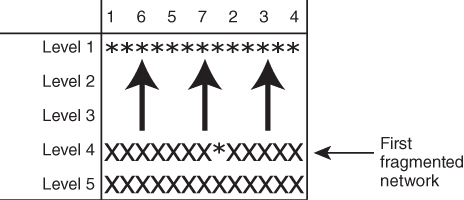
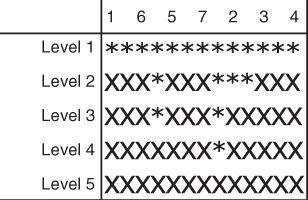
To create the hierarchical clustering diagram by hand, label a table's columns with the closest ties next to each other, and the rows by the number of steps (or levels) it takes to proceed from a completely connected network to a completely disconnected network (Fig. 5.12). Next, taking note of successive iterates of the Newman algorithm, determine the structure of the first nonconnected network. In this case, it appears in Figure 5.8. We note the structure, and our diagram slowly begins to fill with very useful information as to the emergence of subgroups based on structure (Fig. 5.13).
The final form of the hierarchical table shows the progress of the Newman algorithm from a connected network to a fully fragmented network with no ties (Fig. 5.14).
5.6 Summary
Where the network is an organization, the type and structure of the organization will provide the foundation for groupings within the network and the density of interactions between groups. Factors such as the hierarchy (bureaucratic, post-bureaucratic, or organic) and structure (functional, divisional, matrix) will be reflected in the groupings evident in the organizational network graph.
Networks can be grouped using different algorithms; the choice of algorithm will depend upon the nature and structure of the network and the objectives of the research. Clusters can be identified based on the position of nodes in the network, the structure of their relationships with surrounding nodes or by specific attributes that nodes may display. Subgroup analysis provides the analyst with information regarding the clustering of nodes, the existence of cliques, whether the clusters are internally or externally focused, how the clusters link together, and the effect all of these may have on the network and its operations.
The following are the main points relating to subgroup analysis covered in this chapter:
- The Newman–Girvan algorithm (Newman groups) groups nodes based on progressively removing edges high in betweenness, reflecting naturally formed clusters.
- The CONCOR algorithm divides the network into two groups multiple times to identify nodes that are similar in their connections.
- Attributes associated with nodes can be used to define subgroups, removing the need to perform analyses using the Newman and CONCOR algorithms.
- Hierarchical clustering and block model diagrams illustrate in a tabular format the grouping of nodes into clusters and illustrate how these clusters are connected.
- An analysis of external versus internal links for subgroups will indicate the extent of isolation (siloing) from the rest of the network.
Chapter 5 Lab Exercise
Subgroup Analysis
Learning Objectives
1. Analyze subgroups in a network using the Newman clustering algorithm.
2. Analyze subgroups in a network using the CONCOR clustering algorithm.
3. Analyze subgroups in a network using Attributes.
4. Visualize a network and color nodes by Newman, CONCOR, or Attributes.
Enter the data for the network Subgroups1 into ORA. The tables of data for this network can be found in Table B.8 in Appendix B. Save the meta-network as Subgroups1.xml.
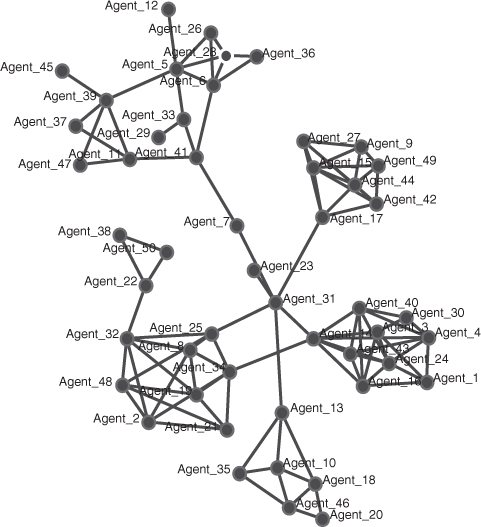
Visualize the network and save the network diagram as a .jpg. The Subgroups1 network should look like as follows:
Newman Subgroups
Newman grouping is based on Betweenness. The links between agents within a subgroup will have a purpose, so Newman clustering will show groups of agents with a reason to connect. Generate a Locate Subgroups report, select Newman grouping and ensure the following options are turned on:
- Create group membership network
- Create block diagram/silo analysis
- Create hierarchical clustering diagram
And also at the bottom
- Add a new meta-network with the located groups
Generate the report in HTML format and enter the location for the file and your report filename.
Save your subgroup reports.
This report will not only produce an HTML report, but also a new meta-network showing the groups and how they are linked. Visualize the new meta-network. The Newman groups are shown as the additional pink nodes and links.
Check the hierarchical clustering diagram, blockmodel, and block densities and find the silo index via external/internal link analysis in the Newman report.
1. Look at the hierarchical clustering diagram, the blockmodel, block densities and external/internal link analysis. In your own words explain the silo index results. How isolated are the groups and how much interaction do they have with other groups? How dense are the groups? How are the groups connected? What do these reports tell you about collaboration between the subgroups?
2. You will now have an extra meta-network Subgroups Network Groups. What is included in this meta-network? Visualize the Agent

Newman group's network. What does this network tell you? What do the remaining networks tell you? Use the visualizer and editor to explore these networks: Agent

Agent, Newman block density, Newman block model.
3. Select the Agent node class and investigate the adjacency matrix via the Editor. What is different?
4. Look at the structure of the network. Assume this is a service firm and the subgroups are departments with different roles. What type of organizational structure is reflected (e.g., functional, divisional, matrix)? What type of structure would enable individuals to move from project to project depending on their expertise and availability, and thus share ideas from their broadened experience? How would you go about increasing the interaction in the current structure and what effect would this have on the network structure?
5. Where are the weak points in this network? Where could an adversary successfully attack the network to reduce the cohesion and fragment it? How could you protect the network against such attacks?
Visualize the Subgroups1.xml network and color the nodes by Newman grouping. To do this select Display in the visualizer, Node Appearance, Node Color, Color Nodes by Newman grouping. You will see that the network diagram shows groups in seven different colors.
CONCOR Subgroups
CONCOR grouping is based upon structural equivalence. It will highlight redundancies in the network where nodes have similar connections. Generate the Locate Subgroups report using CONCOR for this meta-network. Select CONCOR and use level 1 for this exercise. The group should bifurcate into two groups. Use the same options as previously:
- Create group membership network
- Create block diagram/silo analysis
- Create hierarchical clustering diagram
And also at the bottom
- Add a new meta-network with the located groups
Look at the results for the two groups. Now run the report again but this time set three levels for this exercise. Your report should produce eight groups; however one or two may not have many entries.
1. Explain the results for the block model and external/internal link analysis.
2. Look at the additional networks generated by the CONCOR analysis. Visualize these and analyze what these tell you.
3. Select the Agent node class and investigate the adjacency matrix via the Editor. What is different?
4. This organization has some obvious redundancy as shown by the report. Highlight those areas where redundancy is occurring by circling them on the network graph so that management can decide how to redeploy agents in those areas being duplicated.
Visualize the Subgroups1.xml network and color the nodes by CONCOR grouping. To do this select Display in the visualizer, Node Appearance, Node Color, Color Nodes by CONCOR grouping. Enter the Number of Splits as 1. The network will be shown in two colors and groups that are structurally equivalent will have the same color. Display it again but this time, enter the Number of Splits as 2. How many different colored CONCOR groups are there? There should be 4.
Grouping by Attribute
You can also group nodes together by attributes. Where Newman and CONCOR analyze groups are based on links, groups can also form based on common attributes.
Add the attribute data from Table B.9 in Appendix B to the Agent network in the Subgroups1.xml meta-network. The attribute to be added is the project to which they are currently assigned.
To add an attribute to a node type, select the Agent node class and then the Editor tab. On the right-hand side select Create in the Attributes section. Name the attribute Project and the Type will be Number Category. Select Create, then Close. You can now enter in the data from the above table.
Run the Locate Subgroups report. Use the entire meta-network Subgroups1, and only this network (do not include other networks generated by Newman or CONCOR analysis). Select the Newman, CONCOR, and Attribute grouping algorithms, then choose the attribute Power. Look at the groupings of nodes, the blockmodel and the external/internal link analysis. The nodes in these groups are quite distributed, so the silo index for each group will be a relatively high negative figure, illustrating that the nodes have more links outside their clusters than within. Compare this with the silo index for the Newman and CONCOR groupings.
Once completed, visualize the network and display the node color by the Project attribute. Display, Node Appearance, Node Color, Color Nodes by Attribute or Measure, choose the Project attribute and select the colors you wish for each project number by clicking on the color swatch, or accept the default color assigned. Your network will now color the nodes by the project on which they work.
In this laboratory exercise you have generated Subgroup reports and analyzed their contents in relation to the example network. You have produced subgroup analyses using the Newman and CONCOR algorithms and also grouped by Attributes. Visualizations of the network produced groups of nodes based upon Newman and CONCOR groups as well as attributes.
Exercises
Use the above networks to complete the following exercises.
5.1 Calculate the Newman grouping without the use of technology.
5.2 Create a hierarchical clustering diagram for each network.
5.3 Create the block density matrix for each network.
5.4 Compare your groupings and models for these three networks and briefly explain the differences.
References
Daft, R. L. and Armstrong, A. (2009). Organization Theory and Design. Nelson Education.
Freeman, L. (1992). The sociological concept of ‘group’: An empirical test of two models. American Journal of Sociology, 98:55–79.
Gerth, H. H. and Wright Mills, C. (1948). From Max Weber: Essays in Sociology, Chapter 4. Routledge & Kegan Paul, London.
Granovetter, M. (1973). The strength of weak ties. American Journal of Sociology, 78(6):1360–1380.
Heckscher, C. and Donnellon, A. (1994). The Post-Bureaucratic Organization: New Perspectives on Organizational Change. Sage, Thousand Oaks, CA, EUA.
Kadushin, C. (1995). Friendship among the french financial elite. American Sociological Association, 60(2):202-221.
Krackhardt, D. (1994). Graph theoretical dimensions of informal organizations. In Carley, K. and Prietula, M., editors, Computational Organization Theory, pp. 89–111. Lawrence Erlbaum Associates, Inc.
Mayo, E. (1933). The Human Problems of An Industrial Civilization. MacMillan, New York.
Mayo, E. (1945). The Social Problems of an Industrial Civilization. Harvard Business School.
Roethlisberger, F. J. (1941). Management and Morale. Harvard University Press, Cambridge, MA.
Roethlisberger, F. J. and Dickson, W. J. (1939). The Early Sociology of Management and Organizations, volume 5 of Management and the Worker. Routledge.
Simon, H. A. (1962). The architecture of complexity. In Proceedings of the American Philosophical Society, volume 106, pp. 467–482. American Philosophical Society.
Taylor, F. W. (1911). The Principles of Scientific Management. Harper & Brothers, New York and London.
Wasserman, S. and Faust, K. (1994). Social Network Analysis: Methods and Applications. Cambridge University Press.
Whitehead, T. N. (1938). The industrial worker. In The ANNALS of the American Academy of Political and Social Science. Harvard University Press.
 . Therefore the probability of two nodes being exactly structurally equivalent (have exactly the same connections) is also
  . In an eight-node network for example, the probability of two nodes being structurally equivalent is
  . If we looked at a network of only 30 nodes this probability would be 0.0000000186. Therefore, even in small networks the probability of two nodes even knowing similar people is quite small. However, in practice it is not unusual for people to have similar acquaintances. This is because there is some reason for the social interactions, such as shared membership in an organization or some of the social forces presented in Chapter 4. The reason for structural grouping in networks is precisely what makes subgroup analysis so important.
 or a
or a  , thus partitioning the network into two groups. This procedure can be executed multiple times, each time bifurcating the network in two. Therefore, executing the algorithm three times should partition the network into eight groups. It is possible, however, that no nodes would be assigned to one of the groups in the case of structural equivalence between nodes.
 or six possible links. Recall that the diagonal of the adjacency matrix is undefined, disregarding the possibility of reflexive links. There are actually four links present out of the six possible, so the block density is 0.67. The block connecting A, B, C to D, E, and F (4,5,6) has
  or nine possible links, as the diagonal is included in this block and all potential entries are possible. The block density is therefore three out of nine possible or 0.33. The block densities provide insight into the coordination and connections between subgroups in the network.
 to 1 to show how isolated a particular subgroup is. If 50% of the links from a subgroup are internal or external, then the silo index is 0. If a subgroup has more internal links than external links the silo index will be positive (
 Newman group's network. What does this network tell you? What do the remaining networks tell you? Use the visualizer and editor to explore these networks: Agent
  Agent, Newman block density, Newman block model.