Chapter 8: Sources of Data
It is a capital mistake to theorize before one has data.
Sir Arthur Conan Doyle
Learning Objectives
1. Understand modes of data.
2. Understand boundary specification (population, sampling, realist, nominalist).
3. Understand snowballing.
4. Know the collection methods for social network data.
5. Explain concepts: roster versus free recall; free versus fixed choice; rating versus ranking.
6. Understand issues surrounding anonymity.
Methods of data collection and the way we represent data have a large influence on the results we will obtain from using social network analysis tools and methods. Research data is collected to help us understand a situation under study and to test hypotheses about what is happening within that context. Careful consideration must be given to the matching of data types and formats with the research questions. We need to be clear about what we are trying to achieve in collecting data and analyzing a particular network, and the data we need to collect to answer the underlying questions. Once we are clear about the objectives, we can design the most appropriate approach to data collection and its coding in the network.
8.1 Network Sampling
There are two types of data in social network analysis: structural and composition. Structural data describes pairs of dyads or triples of triads. It also includes information such as topology. Composition data consists of attributes and measures on the individuals in question. For example, measuring the age, gender, race, socioeconomic status, and height of individuals are all forms of composition data. Kinship, affiliation in organizations, and friendship are all forms of structural data.
Nodes in a network do not have to represent the same thing. Some nodes can be people; other nodes can be locations, organizations, beliefs, events, tasks, resources, etc. If a network contains multiple types of nodes it is multi-modal. If for example, nodes were used to represent people and locations, the network would have two modes. If the network also had events, the network would have three modes, and so on. Therefore, the number of modes refers to the number of different types of nodes in the network.
An important concept in collecting network data is the boundary specification (Wasserman and Faust, 1994). This refers to a problem of determining whom to include in a social network study. There are two classic approaches: the realist and the nominalist. The realist approach identifies the group based on the member-defined identity. The New York Giants have defined members that belong to the team. An Army platoon has members that definitely belong to that group. The nominalist approach defines a group for some scientific objective. For example, if someone wanted to study the interactions between psychologists, they might define a group as the individuals who have published papers in the American Journal of Psychology. While there are certainly people who might consider themselves psychologists who have not published in this journal, the group is convenient for the research question under investigation.
For many social network studies, groups are small enough to collect data on all individuals in the network. In some cases, however, the group is too large. The population refers to all individuals in the group being studied. A sample refers to a random subset of these individuals. A sample in a network sense is a bit different than in a traditional statistics sense, because we are most interested in preserving the network structure that is representative of the population. For example, in a social network study conducted at the US Military Academy to understand a cadet military chain of command, all individuals in one cadet regiment were selected. There were not enough resources to collect data on all cadet leaders within the Academy, therefore only a limited number of cadets could be studied. If these cadets were chosen at random from across the Academy, it might be reasonable to assume that a commander in first regiment would not communicate with a commander in fourth regiment due to distance and the difference in the chain of command. Therefore, the entire chain of command in the fourth regiment is chosen, so that this regiment might be considered a representative random sample of the structure of a chain of command at the Academy.
Another method of collecting data on large groups is snowballing, also known as respondent-driven sampling (Goodman, 1961; Salganik and Heckathorn, 2004). In snowballing an agent of interest is selected and all of the other agents connected to this first agent are selected. These nodes are called the first-order connections. Next, the agents connected to all of the first-order connections are identified. These nodes are called second-order connections. This type of data collection is often useful to explore the social network space surrounding some agent of interest.
Several concerns arise in snowball sampling. One concern is that the size of the network can grow quite rapidly as this process continues. Another concern is that individuals not relevant to the social group under research might be included. For example, if a criminal investigator was building a gang network based on warrant-supported phone tapping, there may exist nodes in the network that are not affiliated with the gang. In addition to gang member to member communication, they may also communicate with family members, non-gang affiliated friends, and others. A common approach to handling this problem is to use the “2.5 degrees” rule-of-thumb. This involves snowballing three degrees from the initial seed node, or third-order connections. Then remove all pendant nodes (nodes with only one link into the network). In a sense, this screens out individuals who are not likely to be affiliated with the group under study.
Check on Learning
True or False. The rule of thumb for snowballing is to include first-order connections, second-order connections, and third-order connections, then remove any nodes with only one link into the network.
Answer
True. This method ensures that the sample size is not overwhelming and limits the scope to those individuals who are most likely to be of interest.
8.2 Measuring Links
There are many ways in which nodes may be linked together. A person may have a set of individuals they consider friends in a friendship network. There may be other people they go to for advice. Other people might be kin relatives. Some people might be affiliated by common membership in organizations. There are six categories of relationships that we may wish to measure in a network.
Individual Evaluations: These are relations defined by the judgment of individual actors, such as friendship, trust, and respect. These relationships are most common in social network analysis.
Transaction: This relationship involves the transfer of some material resource, such as lending money and buying. Once the resource is passed from one actor to the next, the original actor no longer has that resource. This type of link is used primarily as a proxy for some other relationship. In order for one actor to give a resource to another actor, they must have some other type of relationship ranging from acquaintance to stronger affinity.
Transfer: This relationship involves the transfer of nonmaterial resources. Unlike transaction, both agents may possess the resource after transfer, such as communication, knowledge, or sexually transmitted disease.
Affiliation: Some agents may share affiliation with the same organization, live in the same house, or attend the same school with each other.
Formal: This relationship is formally established and does not require the opinion of the node. For example, a chain of command follows this relationship.
Kinship: Similar to the formal relationship, but with more defined meaning (i.e., sibling, parental, tribal).
All relationships can tell us something about the network and the how people within it associate or show common ties. Relationships may be binary (0 or 1), negative or positive ( or
or  ), carry a specific value (exact number such as dollars, speed or distance, etc.). The absence of a link may also be significant in some networks, such as linking evidence to suspects in a criminal network. The social network researcher must determine the most appropriate way to design and measure the value of a relationship and how it should be defined, based on the research question.
There are important conceptual and theoretical differences between positive, negative and null ties. In a positive tie network, a node high in betweenness centrality is in a position to broker information and resources between actors in the network. This allows that highly central node to hold informal power. This is not necessarily true for a null network or negative tie network. Two nodes in the positive tie network with no link between them may represent a null tie, where there is no relationship between the actors. It could also represent a negative tie, where the actors dislike each other. In a negative tie network, betweenness centrality (and other node level measures) loses its conventional interpretation.
Example 8.1
Consider a network, where the links represent dislike instead of liking. A node on the path of dislike derives no informal power, positional advantage, or positional disadvantage. Keep in mind that in the negative tie network, two nodes that do not have a dyadic link may either like each other, or have no relationship at all.
Treatment of negative and null ties is an area of active research. For our purpose, we present the issue as a data collection concern. When collecting social network data, it is important to keep in mind that there are many ways in which two nodes might be related. Sometimes, the absence of relationship (null tie) is the interesting network to explore. Other times it is the positive tie network, negative tie network, or another type of relation completely. Two nodes that consider themselves friends do not necessarily trust one another. Two nodes that communicate for work related issues may or may not engage in gossip or discussions about their personal life. Data collection design must carefully consider the relationships of interest and determine the value network centrality measures may or may not provide in light of those relationships.
There are several ways to collect data regarding relationships in social networks. The key methods we discuss are questionnaires, interviews, observation, archival records, and e-mail.
Questionnaires are the most common method of collecting social network data. Subjects may be asked about many different relationships. There are several key experimental design considerations for questionnaires.
The first consideration is roster versus free recall. The roster design will provide the subject with a list of possible choices. The free recall method on the other hand requires the subject to remember who his friends are without any prompting from the questionnaire. For example, if you ask a subject to name their close friends, the roster method may provide them a list of people in their workplace, of whom they can choose others to link to. In this method, they are not able to select individuals that are not on the list. Research has shown that people can often forget close friends if they are not prompted and that free recall is more affected by how recently a subject has interacted with others than by the closeness of a relationship. Humans also tend to categorize acquaintances. Therefore, they are more likely to recall certain subgroups and leave out others based on their individual categorization. Some feel, however, that the roster method limits the potential relationships that a subject can name and therefore biases the study.
Example 8.2
McCulloh and Geraci (n.p.) conducted a study of post-traumatic stress disorder (PTSD) which included social network data on a US Army Infantry Brigade consisting of almost 1000 soldiers. Data was collected prior to the brigade's deployment to Afghanistan, 2 months into their deployment, and after they returned from deployment. The first questionnaire asked respondents to “list their close friends within the [military] unit.” Example responses were “Bubba,” “My wife,” “Big Joe,” “Smitty,” and other unusable responses. They were able to identify usable data from only 2 out of 12 companies in the brigade.
There were two challenges that the researchers faced. The first was the impracticality of providing respondents with a roster consisting of 1000 names on it. The second was the concern associated with prompting the respondent. Qualitatively, they determined that most relationships between soldiers were within the company level of the organization. Companies consisted of between 50 and 170 soldiers, depending upon the manning and purpose of the company. During the second iteration of data collection, respondents were provided company rosters. They were asked to place a check next to the individuals they considered to be a close friend. Usable data was collected on all companies surveyed. However, some respondents that completed surveys were not included on the roster, because they had been recently transferred into the unit after the roster was made. This provided another source of error in the study.
Roster and free recall both have strengths and limitations. A design decision must include considerations such as feasibility, size of the network, accuracy of the roster, among other issues. The third iteration of data collection used the same protocol as the second iteration.
Another consideration is free versus fixed choice. Free choice allows the subject to select as many potential others to link to. The fixed choice design, on the other hand, limits the number of others to some defined number. If you wanted to know close friends, the free design would allow the subject to name 3 or 30. The fixed choice design sets a number; for example 5; and then the subject must name exactly five friends. If they only have three close friends, they must arbitrarily choose two more. If they have six close friends, they must leave one out.
Yet another consideration is ratings versus rankings. Rankings require a subject to list the ranking of the strength of ties. For example, if you were investigating friendship with the ranking approach, you would ask the subject to rank order his friends from one to however many friends he has. The ratings approach measures the strength of relationship, allowing for ties. For example, if you investigate friendship with the rating approach, you would ask the subject to rate his friendship on a scale of 1 to 10. Some argue that if possible, you should always attempt to obtain rankings over ratings when possible, because there is higher resolution in rankings. However, if an individual has a few close friends, more regular friends, and some acquaintances, the ranking difference between a close friend and a regular friend would appear the same as the difference between close friends. Ratings, on the other hand, may not align with the culturally defined categories intended for collection.
Usually when we use a ratings approach, we prefer the Likert style scale, which is a five-point (0–4, 1–5) or seven-point scale (0–6, or 1–7). This scale allows a midpoint for exact ambivalence, extremes, but requires the user to push a little more to either the middle or extreme for other ratings. Research has found that 3- and 10-point scales can be more biased by people completing the survey than the five- or seven-point scales. However, it is often wise to use a scale that has been established in the literature in order to establish credibility in your research.
It is also very important to note that people can assess friendship differently. Strength of friendship of 6 to one person may seem like a 5 to someone else. It is wise to ask an objective question where possible for ratings. For example, instead of asking to rate their friendship on a scale of 1–7 where 7 is a close friend and 1 is an enemy, it may be more wise to ask, do you avoid this person, are you acquainted with this person, do you like this person, do you associate outside of work, do you go to each others house to socialize, do you go on vacation together, are you in an intimate relationship with this person. This makes the assessment of relationship more objective and consistent between nodes and dyads.
A different approach to questionnaires is interview. Interviews are used when questionnaires are impractical or the investigator lacks enough knowledge about the subject group to design appropriate questions. In some cases, interviews are used on the front end to provide insight into the nature and type of relationships and composition data that are important for the group under study. Interviewing is probably the most challenging method of data collection for the researcher. Effective interviewing requires the interviewer to gain rapport, convince people to open up, record accurate notes, begin and end the interview. These skills must be developed with practice.
Another data collection approach is direct observation. Observers need to be precise and consistent with their identification of relationships. One study at a military training event required the observer to record the number of statements/commands sent between members in a platoon chain of command during convoy operations. Early missions had very little communication where density was less than 0.3. Later missions had high communication with density greater than 0.8. The density of this network was highly correlated with the notional casualties incurred in the mission.
Archival records are another source of data. Many relationships can be defined for a set of records. A classic example is author co-citation networks. This establishes a link between individuals who have coauthored papers together. One famous mathematician, Paul Erdos published a large number of academic papers. Mathematicians like to track how many shared coauthors they are away from Paul Erdos. This is called an Erdos number. The lower the Erdos number, the more prestigious the mathematician.
A specific form of archival records is e-mail data. Most e-mail exchange servers maintain header information from e-mail traffic. This data consists of the TO, FROM, CC, BCC, SUBJECT, E-MAIL MESSAGE ID, and the date and time stamp. The header information provides necessary data to construct an e-mail communication network. E-mail communication does not necessarily reveal friendship, trust, or advice seeking. The volume of e-mail activity is usually more a function of an individual's role within the organization and their personal e-mail habits. Some people will e-mail the person sitting next to them. Others will walk to another room down a hallway to speak to someone face-to-face. However, the presence of an e-mail link between people demonstrates that there is at least some level of relationship between actors. Attribute defined subgroup analysis can help average actor e-mail behavior across groups and provide subgroup to subgroup communication behavior.
8.3 Data Quality
When we discuss data, there are several concepts that refer to how good the data is (Wasserman and Faust, 1994).
Accuracy refers to the reported information being actually correct. It is well established that if you ask someone to tell you the people they spoke with last week, they will usually forget someone. They may also report someone who they spoke with 2 weeks ago, but not last week. There are several reasons that people report inaccurate information. Bernard (2013) offers four key reasons.
People who participate in a survey or interview have a stake in the process and will attempt to answer all of the questions. They may or may not understand the question, but will still try to provide an answer. Some respondents will provide responses that they think the researcher is looking for whether or not it is accurate.
It is easier for people to remember some things more than others. Memory is fragile. It is easier to remember recent events, rare events, and significant events. Common behavior over a long period of time causes people to estimate their behavior rather than report their actually memory of the events.
Social network data collection is a social encounter. Individuals will tend to respond in ways that offer them a perceived advantage. For example, boys tend to exaggerate reports of their sexual experience, while girls tend to minimize reports.
People use rules of inference because they are unable to remember actual events. Freeman et al. (1987) asked people to list those who attended a colloquium at their university. People tended to report those who usually attended the colloquium, rather than those who actually attended.
Some forms of data collection are more accurate than others. Questionnaires and interviews rely on human memory for the data and are often less accurate than direct observation, archival records, or e-mail data. It is possible, however, that an observer failed to notice some interaction or the context in which interaction may have occurred. Just because data is more accurate, does not mean it is of better quality.
Validity refers to whether the measurement captures what it is supposed to. For example, using e-mail data to measure a friendship network may not be valid. It is likely that a person may e-mail coworkers, receive junk mail, and have links to others who are not necessarily friends. Asking the person would reveal real friends from other non-friend links. There is often a trade-off between accuracy and validity.
Reliability refers to consistency in the measurement. A measure is reliable if the same measurement can be recorded multiple times and the same results are obtained.
Finally, measurement error occurs when there is a discrepancy between a true relationship and the value that is recorded.
Several techniques can be used to improve the quality of data collection. Cued Recall is a process where respondents review records such as phone logs, letters, or membership rosters to cue their memory. This approach has not been shown to create 100% accuracy, but it has been demonstrated to improve a respondent's accuracy.
Landmarks is a method where people are provided a mental landmark such as the birth of a child, graduation, or major news event and ask people to report activity since the event. Offering a respondent multiple landmarks may help reduce their tendency to rely on rules of inference for responses.
Restricted Time is a technique where the recall period is kept short. The short time period allows people to focus and provide more accurate responses.
8.4 Additional Ethnographic Data Collection Methods
Cultural domain analysis is a method to map the cultural domains of social groups. Cultural domains are the classification schemes that people use. For example, if you were to ask a group of people on the beach to identify which of the three animals is not like the others: DOLPHIN, SHARK, DOG; they are likely to say “DOG.” The other two live in the water. If you asked the same question of a group of biologists, they might be more likely to respond, “SHARK,” because the other two are mammals and the shark is a fish. Neither response is right or wrong. They are simply different cultural domains by which people classify things.
Cultural domains are determined by asking respondents a question requiring a free list response. For example, Casey and McCulloh (2012) asked people in public markets in Mosul, Iraq what are characteristics of a hero? Respondents were then encouraged to list as many responses as they could and were prompted, “what else?” The earlier a person listed a response and the more common the response is across respondents, the more salient the response.
Networks can be created from cultural domains in different ways. Social networks can be constructed based on actor similarity in responses. Two-mode networks can be constructed where the respondents are agents, and the responses are the second mode. Relational algebra can fold the two-mode network into a social network based on a salience-weighted threshold or a (response response) network can be created based on common respondents. Subgroup analysis of these networks can reveal differing cultural groupings.
Name Generators are used to construct ego networks. A respondent is asked questions such as “who would you ask for a loan,” “who would you ask for work related advice,” and “who would you ask about employment opportunities.” Name generators are used to build networks, where the population is ill-defined, with no convenient boundary specification. Name generators are often used in conjunction with snowball sampling to identify social groups.
A challenging method of collecting network data comes from text analysis. Terrorism experts will read through intelligence reports, summaries, news media, and more to extract important relationships between terrorists. Financial experts will listen to the speeches of central bankers and financial news reports to extract meta-networks pertaining to finance. Criminal investigators will extract meta-networks of evidence from witness statements and other forms of text.
Here, we present a systematic approach for extracting meta-networks from text based upon the Caleb methodology frequently used in intelligence analysis. The first step is to determine the context or application area for the text extraction that is most relevant to the research objectives. Are you building a terrorist network, financial network, crime scene network, or something completely different.
Second you must decide on your meta-network ontology. The basic ontology consists of Agents, Knowledge, Tasks, Resources, and Organizations. If you are investigating terrorism, you may want to include events and locations. If you are investigating financial networks, you may wish to include stocks. If you are investigating crime, you may wish to include evidence. There is no set ontology that the analyst must use. Rather, it is tailored to the particular application.
Third, you must decide on what meta-relations that will be explored. Are you looking at Agent  Agent networks? Agent
  Organization networks? Task
  Resources networks? You do not have to consider all ordered pairs of network relationships and you can include multiple types of relationships within a meta-relation. For example, in the Agent
  Agent meta-network, you can investigate friendship networks, trust networks, kinship networks, and many more. All of these networks may include the same individuals. The investigator defines the relationships or links.
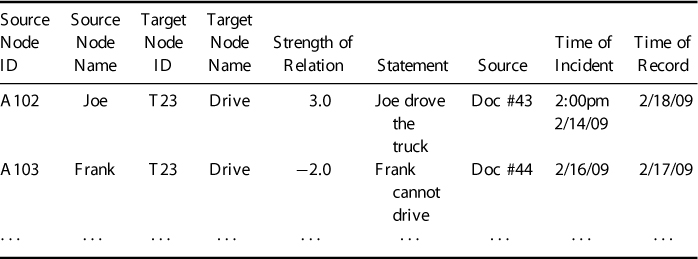
Fourth, once these decisions are made, the analyst can begin to explore the document and record structural data ready for analyses. For each set of network relations the information displayed in Table 8.1 should be recorded. The analyst may create a separate table for each set of relationships. The source and target node ID columns provide the nodes for the network. The strength of relation provides potential weight for the links. The statement and source provide validation of the relationship. The time columns allow data to be segregated into time periods for future longitudinal analysis.
Table 8.1 Caleb Methodology Table
8.5 Anonymity Issues
In defining the dataset required for the analyses the boundaries must be defined, that is, what data do we want to collect from whom, and do we need to ensure anonymity of the participants? Once we have identified who we need to collect from we then need to determine how many participants, and what level of detail is needed in the data. Do we need to include the entire network or will a sample give sufficient rigor to our findings? If a sample is to be collected, what size sample are we seeking and from where will we draw this sample to ensure no bias in selection of participants? In some cases informed consent and/or anonymity will be required, particularly where sensitive information is being analyzed, in such cases as networks of drug users, contagious diseases with anti-social connotations or suspects of crime networks. The process of replacing an identity with a code is straightforward, however those who know the network well will be able to reverse engineer the coding and identify or infer identities just from their positions in the network or relationships. Kadushin (2005) observes that data collected on individuals or social units is the very point of the research, not incidental to it. Borgatti and Molina (2003, 2005) also highlight the importance of identities in the building of sociograms where named connections are important to the construction of the network. Borgatti suggests the researcher be cognizant of who is to see the data and what the data will be used for, and consider whether the participants would be strengthened or weakened by the results of the analysis, observing that the stakes are higher in the managerial context than in academia. Borgatti and Molina (2003) recommend two principles to guide the researcher: avoiding harm to innocents and providing value to participants.
However, in most cases social network analysis provides a wealth of information not only about the people by their attributes but also their position in the network, the network structure and the relationships between those in the network. In some cases meaning cannot be derived unless the participants are identified. Anonymity is suitable where the research is focused on the structure and dynamics of the network, however, where participants are requested to identify people they trust, report to, or with whom they collaborate, for example, then anonymity will generate results of limited value.
8.6 Summary
Our ability to answer research questions with confidence depends directly upon the quality of the data gathered and the application of appropriate analyses to that data. Deciding on what data to gather, its format, and the methods of collection will affect the accuracy, validity, and reliability of the data. Bias in data collection and collation should be minimized to ensure valid deductions from our findings. The key points discussed in this chapter are
- There are two types of social network analysis data: structural data comprising of pairs of dyads and triples of triads, and composition data comprising of attributes and measures relating to the individuals.
- When defining boundaries in social network analysis it is important to preserve the network structure, so care must be taken when deciding upon criteria for inclusion in data gathering. In large networks where all individuals cannot be included the criteria for inclusion in the chosen sample must reflect the best data set available to achieve the research objectives.
- Snowballing should set the boundary for sample inclusion to no more than three order connections from the initial node of interest.
- Relationships in networks fall into six main types: individual evaluations (value placed on relationship by the individual), transaction (resource is passed and source no longer possess the resource), transfer (resource is passed but both agents possess the resource), affiliation, formal, and kinship.
- Link values can be binary (0 or 1), negative/positive (+ or
 ), or carry a specified value, and nonexistence of links may also be significant.
- Data in questionnaires can take several formats: roster providing possible choices, free recall requires the respondent to think of the answer, free choice permits the respondent to select the number of inclusions, fixed choice sets limit to the number of inclusions, ranking requires the respondent to rank their choice in order and rating enables the respondent to scale the strength of the relationship.
- Data quality considerations include accuracy, validity, and reliability, measurement errors should be minimized by the use of cued recall, landmarks, and restricted recall time periods.
- Cultural domain analysis and name generators can be used to gather data to populate a network.
- Extracting meta-networks from text can be achieved through the following steps: determine the context and objectives, decide upon on the meta-network ontology, identify the relevant meta-relations to be explored and the associated networks, collect data and populate in tables of relationships ready for analyses.
- Determine whether the data collected requires anonymity, considering most social network analysis provides valuable information about the position and relationships of named entities.
Exercises
8.1 Ask 10 people to list their friends. Keep encouraging them to list more. When finished, ask them to categorize their friends. In other words, how do they know the people? What kind of friend are they? What do they do together? Then, go back through the list and ask them to categorize each friend. In general, categories should be clumped together. Why is this? What can this tell you about possible bias in free recall?
8.2 Are there any individuals in your 10 respondents that are listed in other respondent's friend lists? If so, are they reciprocally listed? What technique involves using the first respondent to develop the list of subsequent respondents? What are strengths and weaknesses of this method?
8.3 There are six categories of relationships presented in this chapter. Compare, contrast, and provide examples of a relationship for each category.
8.4 Discuss the data quality issues with the following methods of social network data collection:
1. e-mail;
2. interview faculty of an elementary school;
3. questionnaire to collect friendship and respect relations in a military unit of 100 soldiers;
4. observe student interaction in a second grade classroom.
References
Borgatti, S. and Molina, J. (2003). Ethical and strategic issues in organizational social network analysis. The Journal of Applied Behavioral Science, 39(3):337–349.
Borgatti, S. and Molina, J.-L. (2005). Toward ethical guidelines for network research in organizations. Social Networks, 27(2):107–117.
Casey, K. and McCulloh, I. (2012). Hts support to information operations: An example of integrating hts into coin operations. Military Intelligence, 37(4):28–32.
Freeman, L. C., Romney, A. K., and Freeman, S. C. (1987). Cognitive structure and informant accuracy. American Anthropologist, 89:311–325.
Goodman, L. A. (1961). Snowball sampling. Annals of Mathematical Statistics, 32(1):148–170.
Kadushin, C. (2005). Who benefits from network analysis: ethics of social network research. Social Networks, 27(2):139–153.
Salganik, M. and Heckathorn, D. (2004). Sampling and estimation in hidden populations using respondent-driven sampling. Sociological Methodology, 34(1):193–240.
Wasserman, S. and Faust, K. (1994). Social Network Analysis: Methods and Applications. New York, NY: Cambridge University Press, pp. 30–33.