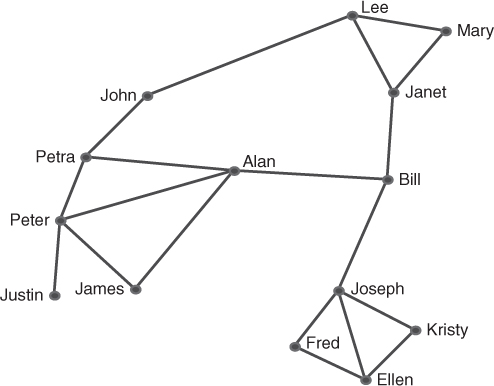
Figure 9.1 Undirected network graph.

Irrational action is the logical result of poorly defined performance measures.
Eli Goldratt
Every decision we make in life is based upon an unconscious evaluation of the risks and benefits that could result from our decision. Even the decision to cross a road involves a subconscious evaluation of consequences—and the impact will be different depending upon how heavy the traffic flow is, quality of sight of oncoming vehicles, whether we are crossing at traffic lights or a pedestrian crossing, the weather conditions, and so forth. We would normally make sure we are well informed about the consequences of decisions that hold high risk before we commit to a decision. According to the Oxford English Dictionary (http://oxforddictionaries.com/definition/risk the term risk originates from the early to mid-1600s and is defined as “the possibility that something unpleasant or unwelcome will happen,” “a situation involving exposure to danger,” and “expose (someone or something valued) to danger, harm, or loss.”
The ISO 31000 standard on Risk Management (ISO 31000, 2009) defines risk as “effect of uncertainty on objectives” where an effect is a deviation from the expected that can be either positive or negative, and objectives can relate to financial, health and safety, and environmental goals and these can apply at strategic, organization-wide, project, product, and process levels. The standard also describes uncertainty as “the state, even partial, of deficiency of information related to, understanding or knowledge of an event, its consequence, or likelihood” (ISO Guide 73:2009, Definition 1.1).
Risk analysis is a fundamental management tool. It enables us to make more informed decisions that hopefully result in better outcomes than decisions based upon no analysis. The determination of risk can provide more peace of mind for the decision maker as the more information we have regarding a situation, that is, situational awareness, the more confident we can be about the outcome of our decisions. Risk comes in many forms and in the context of an organization is concerned with the nonreaching of objectives.
Vulnerabilities are shortcomings that leave the organization open to exposure. The fact that you have no firewall installed on your computer network is vulnerability. Threats are unwanted happenings that could cause loss, events that take advantage of vulnerabilities, that is, the threat that your computer system may be hacked and your credit card details stolen. Risk is the probability that a threat may happen and in the case of having no firewall installed the probability that your system will be hacked will be pretty high. Risk is also used frequently to mean threat. The impact of the threat is usually noted in dollar terms by estimating the losses that would result if a threat were to occur. The impact of your system being hacked could be the loss of all your data and the cost of retrieving it, or loss of sales and/or customer confidence if your system needs to be constantly available or even loss of life if your system is an emergency response or life dependent system.
The ISO risk management standard (ISO 2009) also describes the internal and external factors that should be considered when managing risk. The external environment in which the organization seeks to achieve its objectives can include:
The internal environment in which the organization seeks to achieve its objectives can include
All these factors can have an effect on the outcomes of our decisions, and it is wise to consider the relevance of such factors in our evaluations of risk.
In the case of networks risk can relate to either nonattainment of the objectives of the system under study via imbalance within, or threats to, the network structure or dynamics. Traditional risk analysis relates to the nonattainment of objectives by identifying assets and threats, quantifying or qualifying the impact of occurrence of the threat or losses, and the probability of occurrence. Threats in traditional risk analysis relate directly to the objectives—customer satisfaction, profits, achievement of goals, etc. While also related directly to achievement of objectives, threats to networks take a slightly different form.
Social network analysis provides us with extensive measurements for analysis of an agent's position in the network and their influence based upon their centrality. Position in the network, however, can be used to positively support cohesion in the network and jointly support organizational goals or alternatively can be a threat to the ongoing operation of the network. It would be easy to assume that the person with the highest degree centrality is the most influential; however, this is not always the case. The agent who has the highest degree centrality and is most connected to others may not be the most critical. Many influential nodes have connections only to other nodes in their immediate cluster or clique, connecting solely to those nodes that are already connected to each other. People have access to different information and have varying influences across the network and we need to identify who is the right source of information, who is crucial to the flow of information and has access to resources and knowledge, and who is able to influence others in the network.
Social network centrality measures provide insight into key people within the organization (Chapter 2). Network centralization measures provide an indication of how much a network is dominated by a few highly central nodes (Chapter 3). Individuals with high betweenness centrality have influence and power in the network. If only a few individuals show high betweenness then power is held by these few, or they are responsible for too many key areas and are candidates for high stress. Such powerful individuals are targets to remove from the network and in some cases these individuals remove themselves from the network through absence and sickness. Their absence can cause setbacks to achievement of the network's objectives. The ideal situation in a well-performing network is a spread of comparable betweenness values. Some people may indicate high betweenness but lower degree centrality, and these individuals are key figures in connecting otherwise separated groups. These boundary spanners have access to information and ideas from clusters outside their immediate groups, and are not only able to see a much bigger picture but are also able to filter information flowing from one group to another.
High closeness centrality measures indicate good access to informal information such as ideas, opinions, beliefs, and events. Individuals with strong closeness are influential in the network as they lead in forming norms and attitudes, and hence contribute greatly to building the culture of the group. The role and actions of people with strong closeness centrality should be studied in the analysis of risk in light of the objectives of the network. As opinion leaders such individuals are key to change, so their inclusion in planning, problem solving, idea generation, and change management is prudent.
Individuals who display high eigenvector values have the power to connect with many other influential people outside their immediate connections. In organizational risk terms they have the ability to form a social elite within the group, building norms and expectations that others in their group will relate to. These norms and values may, or may not, be in line with the desired culture of the overall organization network. Knowing who and how individuals with high eigenvector influence others will aid those investigating network risk or building an organization culture.
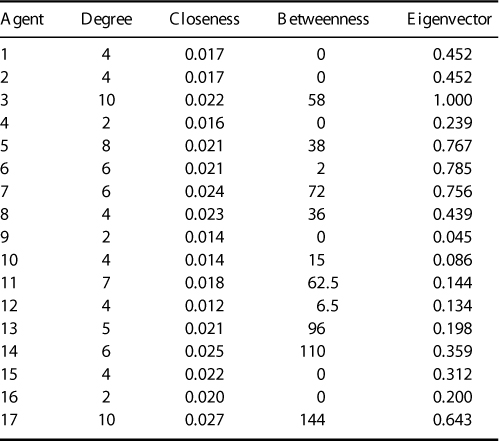
Consider Figure 9.1 and Table 9.1.
Figure 9.1 Undirected network graph.

Table 9.1 Unscaled Centrality Measures
People are the most valuable asset in an organization, as people have knowledge, they complete tasks, manage resources, and so forth. People are thus essential components for in-depth analysis in organizational networks together with knowledge, resources, roles, etc. for consideration in relation to risk. Take the example of removal of key people from the network—if a key person is a boundary spanner their removal could result in fragmentation of the network and groups or clusters becoming isolated from the main network. When a node is removed all thelinks in and out are also removed. This would result in information flows not reaching the isolated group and the communication between nodes becoming completely localized. If the person removed had access to key resources or knowledge, then the isolated cluster would no longer have access to these. The removal of links between nodes also poses a threat to achieving organizational objectives. Key links can provide bridges between clusters and changing the value or character of a link can also result in clusters becoming isolated from others in the network.
The networks in Figure 9.2, Figure 9.3,and Figure 9.4 illustrate a small social network. Bill (the circled node) in Figure 9.2 is a boundary spanner, connecting three groups of nodes. Bill is a key figure in the diffusion of ideas and information, but he could also be a choke point or may pass on a particular view of the information or even misinformation. In a disease contagion network he could be the social butterfly spreading the disease due to his links. If this network was a department in an organization, moving Bill to another department will remove him from this network. Similarly if this was a criminal network, the police could remove Bill from the network by jailing him for some illegal activity thus achieving the same result, fragmenting the network. Figure 9.3 shows the networks after Bill is removed: it has fragmented into three separate groups. In order to function more efficiently again, it will be necessary to develop new links or replace Bill with another person.
Figure 9.2 Social network before the removal of Bill.
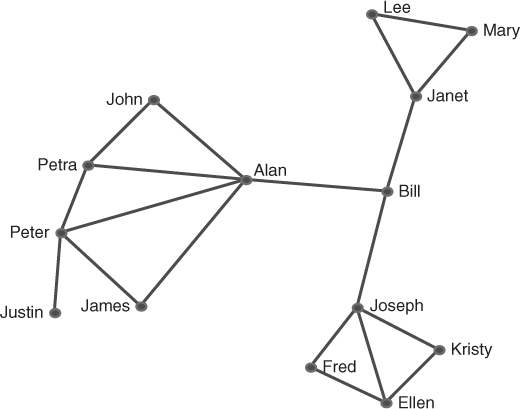
Figure 9.3 Fragmented social network after the removal of Bill.
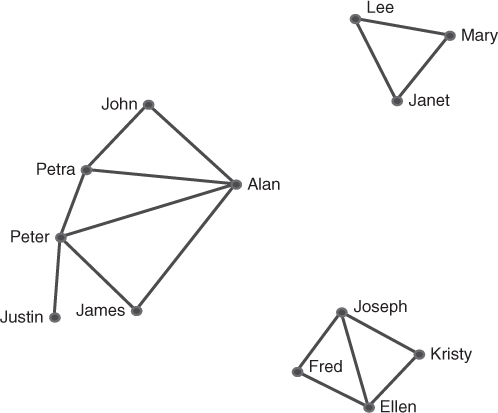
Figure 9.4 Removal of the link between Bill and Alan.
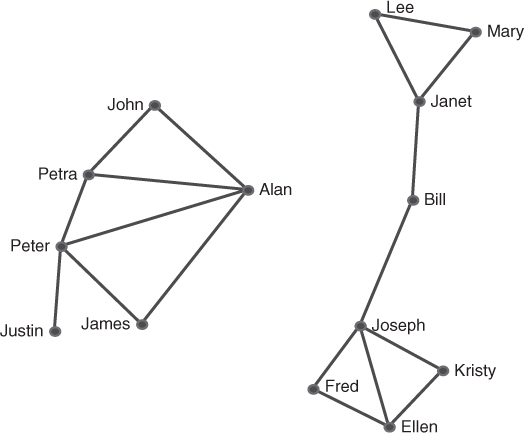
Removal of links can also fragment a network and the more important the link, the more fragmentation will result. The links between Bill and Alan, Janet and Joseph are bridges connecting the three groups. By removing the link between Bill and Alan the network will separate into two groups (Figure 9.4). Alternatively if the link between Bill and Janet is removed, the network will separate into different groups and Janet, Mary, and Lee will form a group separated from the others. Similarly the removal of the link between Bill and Joseph will result in Joseph, Fred, Kristy, and Ellen forming a separate group fragmented from the rest of the network.
Changing the values of attributes in nodes and links can also cause a breakdown of flow in a network (e.g., a communications network or electrical power network), particularly where the strength of the link changes a node attribute value and determines whether a subsequent link is made to another node. Social network analysis does not focus on determining if there are significant relationships between attributes of nodes or links; this is better achieved by employing exponential random graph models for static networks or stochastic actor oriented models for longitudinal networks. Both of these models are beyond the scope of this text.
The structure of the links can also affect network operations. Taking the network in Figure 9.2, John needs to collaborate with Lee in order to achieve one of his goals, but the current structure means John has to communicate with Lee via Alan, Bill, and Janet. If any of these links breaks down, then John and Lee are not able to share information. If John and Lee were to decide to make a direct connection with one another, the power of Alan, Bill, and Janet would be diminished. Alan's power in particular would be diminished if John no longer needed to link with him (Figure 9.5). Although John and Lee would more easily achieve their goals this new route may bypass certain checks and balances imposed on the previous journey through Alan, Bill, and Janet. It also means that crucial information may be lost by the interim nodes as the connection no longer takes that path.
Figure 9.5 John and Lee make a direct link.
Let us enlarge this network so we now include knowledge, resource, and task nodes associated with a few people. Sometimes, a person who is on the periphery of a social network has unique knowledge, resources, skills, etc. that make them valuable to the organization in ways that social network analysis does not detect. Assume Figure 9.5 is a network of terrorists and their task is to produce bombs (Figure 9.6). James, who has relatively low centrality, has access to the raw materials (Resource 1). Access to the knowledge to make the bombs is held by Ellen (Knowledge 1), who also has low relative centrality. In order to produce the bombs (Task 1) James needs to collaborate directly with Ellen to bring together the knowledge and resources to complete the task so links must be established for this to take place.
Figure 9.6 Linking of knowledge and resources for Task 1.
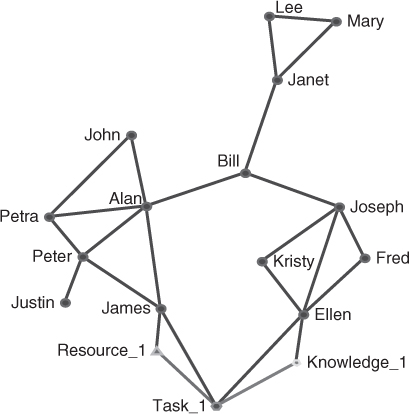
Specialization is a network measure that describes the importance of a node in terms of their unique access to knowledge, resources, tasks, etc. Specialization is calculated much like betweenness centrality. Recall that betweenness centrality measures the frequency that a node lies on potential paths between other nodes. In the same way, specialization measures the frequency that a node lies on potential paths between the unique node, such as knowledge, and other agents within the network.
In the network in Figure 9.6, there are 14 agent nodes and 1 knowledge node. Therefore, there are  paths between the knowledge
  and each agent. If there were two knowledge nodes there would be
  paths. Shortest paths in this network are given in Table 9.2.
Table 9.2 Geodesic Path Calculation for Ellen, Bill, and Alan

As the target node is not counted as being in the middle of the path, the maximum possible opportunities a node has to broker the unique source node is  , thus the denominator in the knowledge specialization network is 13. The knowledge specialization measures are calculated for Ellen, Bill, and Alan:

Ellen brokers knowledge to the rest of the network. Although her betweenness centrality is 0 in the social network, her power comes from her unique access to knowledge. Bill and Alan do not have the same knowledge as Ellen; however, their centrality in the network allows them to broker Ellen's knowledge to others in the network. It might be the case that if all knowledge throughout the network were included in the model, that Bill and Alan would have higher relative specialization scores than Ellen. For example, if John had an equally important sole access to a different type of knowledge, similar to Ellen, then there would be two knowledge nodes. This would increase the number of geodesic paths from 14 to  paths. However, Ellen would still only broker her unique knowledge. This would lower her specialization score to
  , meaning she brokers half the knowledge in the network. Alan and Bill, however, would still have a role in brokering John's knowledge in the same manner that they brokered Ellen's knowledge. In this way, Alan and Bill's centrality in the network is observed.
Suppose we are now on the side of the peacekeepers and we wish to stop the production of the bombs. In order for Task 1 to be jeopardized we need to remove either key nodes or links. We can remove either James and/or Ellen nodes, or remove Knowledge 1 and/or Resource 1 nodes. Alternatively we can sever the links so that the key people, resources, and knowledge never get to the task. In a practical sense this could mean stopping the transport of goods or knowledge or redirecting it away from the destination of the bomb-building task. In many cases the peacekeepers will have limited resources to deploy and restrictions on their activities, so analysis is needed to ascertain the most effective and efficient means of stopping Task 1 with the resources at the peacekeepers' disposal.
In meta-networks we can study the actual connections of knowledge, resources, and roles, etc. with those that are needed in order to carry out tasks, ensuring the people with the appropriate access to resources and knowledge are allocated to specific tasks. Network analysis measures have the ability to highlight weaknesses in the allocation of knowledge, resources, tasks, and roles. Risks can be highlighted where specialist knowledge or resources are required to carry out given tasks and these are not reflected in the network connections. Imbalance and risk are evident in networks where important knowledge and resources are held by only a small number of members. Individuals with high knowledge specialization are often vital to the operations of the network and are also targets for the availability or obstruction of mission critical information or assets.
An organization network consists of agents, knowledge, task, and resource nodes. Agents are assigned tasks that require specific knowledge and access to resources. List five specific threats that could be faced by this network.
Many threats could be listed, here are just a few:
In addition to those situations discussed earlier there are many other events that can threaten the nonachievement of objectives, including underperforming individuals, unconnected individuals, unbalanced workload, inefficient distribution of resources and knowledge, and duplications and omissions in task allotment. Network analysis offers an ability to identify vulnerabilities in an organization network's design structure based upon analyses of the node position in the network and the relationships among the people, knowledge, resources, and tasks entities. For example, Reminga and Carley (2003) and Carley et al. (2011) suggest the following as some measures of risk in organizational environments: cognitive demand, hub and authority centrality, workload, specialization and exclusiveness, situational awareness, weak points, isolates, Simmelian ties, and fragmentation.
Cognitive demand identifies agent nodes that are well situated in the network with a large number of links to other agents, tasks, and events, but lack the connectivity to knowledge and resources required to carry out their complex tasks. This requires the agent to connect to others to acquire the needed knowledge and resources to meet their requirements and fulfill their objectives. The ORA software names this measure Emergent Leader and calculates it on agent by agent matrices. Agent nodes with low cognitive demand are noted in ORA as the least integrated overall identified by the cognitive effort each agent invests to complete its tasks, connect to others, and the like. These nodes are unlikely to become formal leaders of the group.
Workload measures the extent of the knowledge and resources an agent uses in order to perform their required tasks. An agent with a high workload is involved in complex tasks and has the resources and knowledge to complete those tasks. Complex tasks are those with high demand for knowledge and resources. The workload measure is calculated in ORA from matrices of agent  knowledge, agent
  resource, agent
  task, knowledge
  task, resource
  task, and is only calculated if they all exist.
Complete exclusivity identifies those agent or organization nodes that have ties to knowledge, resources, locations, tasks, or events that other entities do not have. In contrast, specialization identifies agent or organization nodes that have ties to knowledge, resources, locations, tasks, or events that are comparatively rare in the network, that is, that few other entities have. For example, Ellen in Figure 9.6 has complete exclusivity, because her knowledge specialization is 1.0. Bill and Alan, however, do not have complete exclusivity, even though they have relatively high specialization in the network. These measures are calculated respectively using the agent  knowledge, agent
  resources, agent
  locations, agent
  tasks, and agent
  events matrices.
Isolates are nodes isolated from the rest of the network, having no links to any other node in the network. Although a node may be an isolate in the network under study, the node may be well connected in other networks that are not included in the scope of the network being analyzed.
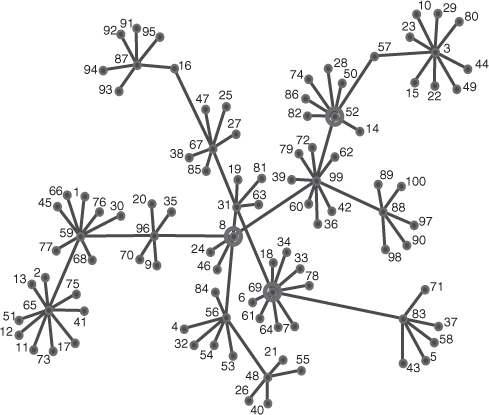
In some networks there are nodes that are critical to the continued cohesion and operation of the network. Removal of these critical nodes will fragment the network. There are also nodes that are critical for diffusion of information across the network. Removal of these critical nodes will stop the flow of information resulting in nodes on the periphery of the network not receiving potentially critical information. Bill was a critical node in the network in Figure 9.2. It is important to be able to identify both types of critical nodes. Nodes that are critical to the continued cohesion of the network are identified in ORA and other automated social network analysis tools by determining those nodes whose removal most fragments the network. This fragmentation measure is determined by the number of nodes that can reach each other. Nodes identified to be critical to diffusion across the network are those that reach all other nodes in the network. This is calculated in ORA by measuring the distance weighted reach, which is the average distance to all other nodes in the network. Figure 9.7 illustrates a network showing the spread of an interesting image attached to an e-mail. Determination of the critical set to ensure maximum diffusion identifies nodes 8, 52, and 69 to be the most important for the spreading or dissemination of the image. These nodes are circled in Figure 9.8. This critical set is different from the set of nodes that will most splinter the network if removed. Removal of nodes 3, 8, and 65 will result in maximum fragmentation, and these three nodes are circled in Figure 9.9. Whereas the critical set for diffusion concentrates on the crucial nodes required to disseminate the information efficiently through the network, the fragmentation critical set concentrates on those nodes that can effectively partition and break the network apart.
Figure 9.7 The network showing the spread of an interesting image by e-mail.
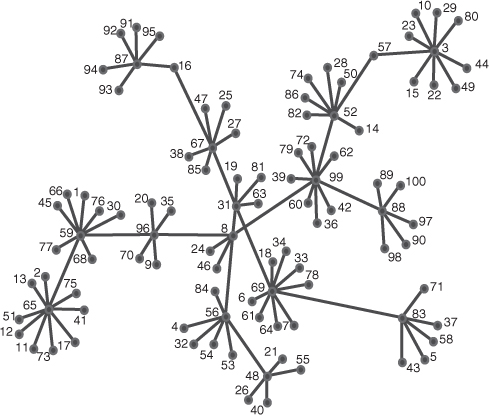
Figure 9.8 The three most critical nodes to the diffusion across the network, nodes 3, 8, and 65.
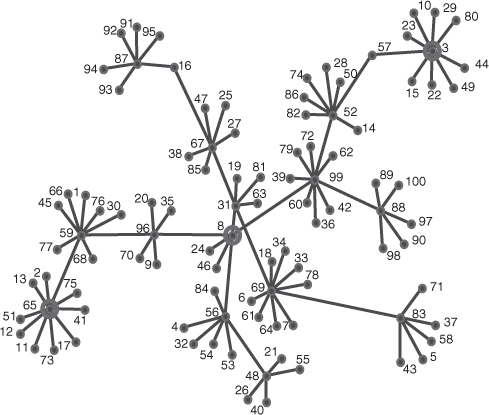
Figure 9.9 The three most critical nodes if removed would most fragment the network, nodes 8, 52, and 69.
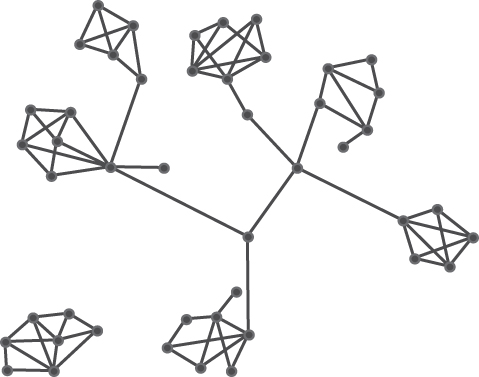
Isolation of groups within the network can produce strong, insular beliefs. The lack of connection with nodes outside the group can result in “group think” where the group leader becomes the “opinion leader” and members follow in order to be included as part of the group. This type of network structure is often associated with terrorist groups (Figure 9.10), where cells work in isolation, connected through opinion leaders who act as boundary spanners. This isolation can aid the generation and reinforcement of extreme or uninformed views and beliefs as the links are confined to internal communications, which strengthen the social norms and values of the cluster. In reality, terrorist groups will adapt to a structure that provides maximum defense against their threat. In Afghanistan, for example, North Atlantic Treaty Organization (NATO) was so effective at targeting the boundary spanners in the Al-Qaeda network that they abandoned the cellular structure to create thicker, more robust ties across the organization. In this manner, Al-Qaeda was still able to carry out attacks following the removal of cellular leaders within the network.
Figure 9.10 Cellular structure associated with clandestine networks.
The silo effect can be measured by calculating the proportion of internal to external links (a feature of the locate subgroups report in ORA). This was demonstrated in Chapter 5. Isolated groups will show a high proportion of internal-only links and highly collaborative groups will have a good balance between internal and external links. A high proportion of external links indicates that a group is not cohesive and lacks strength and also focus.
Study the cellular structure of the graph in Figure 9.10 depicting a terrorist network.
Task 1: It is your assignment to fragment this network of perpetrators. You have limited resources to get this task completed. Circle the nodes you would remove in order of their removal until the network is just a set of unconnected subgroups. HINT: remove the boundary spanner that links the most subgroups first and then view the network again before choosing your next target. You can achieve the goal with the removal of only two nodes. Can you find them?
Task 2: You are the leader of this network and you wish to strengthen it against attacks from those who wish to fragment it. Again you have limited resources to complete this task. Explain how you would build up the network to make it more robust with the minimum resources. HINT: which is more effective: building bridges between subgroups or building connections between the spanners and subgroups to which they are currently not connected?
In an organizational network it is important that the structure of the network is appropriate for the type of organization, its objectives, and activities. Daft and Armstrong (2009) classifies organizations into “efficient” and “learning/adaptive” organizations. Routine tasks are performed repetitively in efficient organizations with only the occasional need to face new challenges. An efficient hierarchical structure with centralized decision making is commonly the preferred structure of these efficient organizations. For example, organizations that manufacture electronic devices are frequently structured “efficiently” to maximize production levels. Efficient organizations prefer well-documented procedures and formal reporting. Managers will be more central in the organization, reflected by high centrality measures.
In contrast a learning organization will be dealing with new challenges frequently, requiring adaptability and problem-solving capability. The need to adapt and solve problems to succeed requires greater collaboration, sharing of knowledge and resources, and more decentralized decision making. Centrality measures for individuals in a learning organization will be higher and more evenly distributed across the network. This is due to the need for increased linkage between all network components. An efficient organization structure (with high centrality of senior managers and low centrality of employees at lower hierarchical levels) will present risk and vulnerability to a learning organization.
To illustrate the difference between efficient and learning organizations, consider a company with 400 employees and an owner. If all employees had direct access to the owner, he would quickly exceed his capacity to maintain useful links with anyone. Recall the limitations on the number of social links a person can maintain (Chapter 4). However, the link the owner chooses to drop might be the one that connects him to the next innovative idea of solution to a problem. The goal of an efficient organization is to assign managers who can review ideas and decisions and determine if they are worth the decision maker's time. Unfortunately, the manager might misinterpret the owner's goals or simply make a mistake. Thus, most organizations must strike a balance between efficiency and learning/adaptive.
Figure 9.11 illustrates a network representing an IT security applications development organization, a firm based upon a real small-medium enterprise developing specialist security software. We will call this organization InterSec Pty Ltd. (a pseudonym). This is an efficient organization, comprising 17 agents, 9 resources, 12 types of knowledge, and 14 tasks. The organization structure needs to be efficient in Daft's terms due to the repetitive nature of the work, with clear procedures and quality controls. The tasks are segmented and each task requires specialist knowledge. As is common in efficient organizations, the manager is highly central to the activities, the relationships are minimal and centered upon completing tasks, and little collaboration takes place outside each worker's area of responsibility.
Figure 9.11 The efficient structure of InterSec Pty Ltd. in the agent  agent network.

The hierarchical decision-making structure of InterSec Pty Ltd. is evident in Figure 9.11, with relationships only between those working together, between supervisor and worker and managerial reporting. Centralized decision making is evident, involving the more senior managers who are also those at the center of hubs; A1-SecManager, A2-BAManager, A3-DevManager, and A4-QualManager. The firm's allocation of knowledge, resources, and tasks to development projects reflected a logical, sequential, and traditional approach as reflected in Figure 9.12. In this diagram the circles represent agents, triangles represent resources, five-sided pentagons denote knowledge areas, and six-sided hexagons represent tasks.
Figure 9.12 Total network for InterSec Pty Ltd. as an efficient organization structure.

This organization noticed that their growth was not in line with other similar organizations in their field, and they wanted to attract and produce more innovative security products. Senior management believed they had excellent staff with exceptional skills and knowledge, and wanted to encourage more collaboration and innovation in their application designs. By restructuring reporting lines and increasing collaboration InterSec formed a more dense and integrated structure, one that generated more opportunity for the spread of ideas and innovative solutions. Their new structure was more in line with Daft's learning organization. Figure 9.13 illustrates the agent by agent network for the new organizational structure and Figure 9.14 shows the new structure for the same individuals, resources, knowledge, and tasks. The increased number of links is prominent, reflecting more collaboration between individuals resulting in a greater sharing of knowledge and more distributed decision making. Notice that the managers are now no longer the only major hubs.
Figure 9.13 Learning organization structure in the agent × agent network for InterSec Pty Ltd.
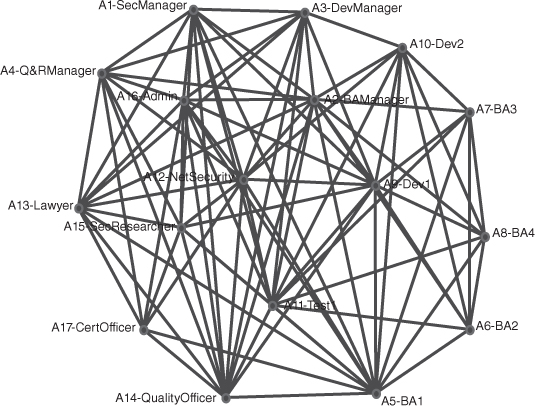
Figure 9.14 New total network for InterSec after changing structure to a learning organization.

Comparing the two structures shows the efficient organization in Figure 9.11 has less links across the network, evidence of less interaction and integration and less sharing of knowledge and ideas. This meta-network reports high levels of exclusive knowledge, resources and tasks, and low workload, situation awareness and weak knowledge, resource and task points, particularly for the nonmanagement employees, thus increasing the risks faced by the organization. Senior managers make most of the decisions and are central to the network and risk being single points of failure. If these central nodes are removed the network is likely to fragment into unconnected subnetworks, thus seriously affecting performance levels.
The density of the network for the efficient organization structure is smaller than that for the new learning structure (Figure 9.14), which contains a greater number of hubs and a higher density overall reflecting a greater level of communication, collaboration, and knowledge sharing.
The more decentralized structure of the adaptive organization structure solves the single point of failure problem, reducing and spreading the risk. Specialization in key areas of knowledge, resources, and tasks is reduced and there is increased situation awareness and more balanced workload. There is increased flexibility in the new structure enabling regeneration of lost nodes or links due to the greater cohesion reflected by the enlarged number of links.
As each organization will be different, there is no common list of threats, so a risk analysis should be carried out to identify possible threats to the network in question and possible changes that could minimize these threats. Four common organizational threats are presented with useful network analysis measures that may help identify and inform strategies to mitigate organizational risk.
As organizations become large, it is no longer possible for someone to know everyone in an organization or to know who has important resources, knowledge, skills, experience, etc. We define large as greater than 250 agents in the network. This threshold is based on the cognitive limitations a human has in maintaining social links. Agents in the organization will naturally optimize their perceived value in social connections by brokering, specialization, and experience. However, this may lead to a suboptimal solution, or individuals may attempt to gain and hold informal power in ways that benefit them, but are detrimental to the organization as a whole. Four social network measures may provide indicators of this type of threat.
High centralization will show that a few individuals dominate the network. Betweenness centralization will show power imbalance. Closeness centralization may reveal risks for communication across the organization. High centralization must be interpreted carefully, however. Highly central individuals could be serving a role to connect individuals with organizational assets in a positive way or they could be acquiring high informal power in a manner that is not consistent with the organization's direction. Depending upon the organization's size and purpose, the organization may need these individuals. In this case, there should be multiple actors filling this role so that the removal of a key node does not seriously impact the organization's ability to function.
An agent's specialization measure can also show how a few individuals can dominate the network in a slightly different way. Individuals high in specialization might have skill sets that are highly expensive to replicate in terms of education or experience. In this situation, it may not be practical to hire additional individuals to reduce the organizational risk. However, if it is an issue of organizational education/experience, training and professional development programs can help diversify knowledge, skill, and resource awareness across the organization.
High fragmentation will show that the network is vulnerable to having critical organizational assets cut off from the rest of the organization. This might involve outsourcing something, where the organization has an idle capability. It might result in lost sales due to ignorance of the sales staff. The organization might even be paralyzed as they are forced to rebuild connections within the organization to function. Fragmentation is rarely beneficial in an organization and usually requires concerted effort to thicken the network.
A large diameter is another measure that can show significant distance from one end of the organization to the other. Managers might be able to develop relationships between distant ends of an organization to reduce the diameter and thus increase the ability of agents to access organizational resources. As a rule of thumb, a diameter less than or equal to three has ready access to all organizational resources. This is based on research on cognitive social structures, which shows that an individual knows their friends (one degree), has a pretty good idea of their friend's friends (two degrees), and might know some of their friend's friend's friends (three degrees). Beyond three degrees of separation, however, the likelihood of awareness approaches zero. Thus, a diameter no larger than three provides reasonable awareness of other agents in the organization.
Efficient organizations have hierarchies that are meant to enable high degrees of supervision and protect the time of decision makers by delegating authority to lower-level managers. These activities can sometimes result in certain managers being overloaded/overworked, while other managers are relatively unburdened. This situation is not an optimal use of employees, and in some cases can lead to organization risk if the overloaded manager resigns, is sick, or is otherwise removed from the network. Cognitive overload is detected with high network centralization and high cognitive demand.
Learning adaptive organizations are meant to facilitate collaboration and interaction across the group. A silo effect occurs where a portion of the organization is isolated from the larger group producing a silo. Silos inhibit collaboration and prevent learning organizations from functioning as intended. The silo index, presented in Chapter 5, identifies subgroups of the organization that tend to be isolated and insular. Reducing these silos requires deliberate thickening of the network, specifically oriented at the agents in the silo subgroup. The fragmentation measure may also provide indications of silos.
Organizational culture is the set of values and beliefs held by members of the organization. Typically, this consists of things such as the value placed on education versus experience; importance of the worker versus the manager; how to deal with customers, or the value an employee provides evaluated by time at work versus some other performance measure. Informal leaders in the network occupy positions of opinion leadership and are able to alter the organizational culture and implement change. In previous chapters, we alluded to the importance of identifying these individuals and seeking their buy-in for important decisions. These individuals also have the ability to implement unwelcome organizational change. Informal leaders are those high in one or more of the node-level centrality measures. These individuals should be identified and managed to ensure the desired organizational culture is maintained.
Managers may implement strategies to thicken a network to create redundant connections and increase collaboration. This is very desirable for knowledge-intensive organizations and learning/adaptive organizations. It may not be good to thicken the network in an efficient organization, because each connection requires time and resources to maintain the links and can distract from the task an individual is intended to perform. Strategies for thickening a network are based in the theories of social link formation presented in Chapter 4. It is important to keep in mind that relationships and affinity cannot be forced. Therefore, a manager must simply create opportunities for link formation and interaction. This will come at a cost of less time spent on an actual billable task; however, the thickened network provides increased value to the organization as a whole. This is often called social capital.
Proximity is the simplest approach for thickening a network. At Apple, there was a single bathroom that employees had to use. Many Apple employees have a “bathroom story” where they met someone from a diverse part of the organization. During US military operations following the US–Iraq war, the Northern Division established a coffee bar, where soldiers in the division headquarters could get free coffee. This had an observed effect of significant thickening of the social network and increased collaboration across the staff.
Proximity can be physical. In this sense, creating an open office plan or assigning people to desks/cubicles near each other can increase their opportunity for interaction.
Proximity can be organizational. People can be assigned to teams. The team leader will naturally facilitate collaboration through meeting, working groups, etc. These teams can be formally assigned as in a divisional organizational structure, or they can be organized in ad hoc working groups as in a functional organizational structure.
The most effective structure for increasing collaboration is to matrix the physical and organizational structures. Do not assign people to working locations near other people in their same organizational structure. If people are assigned to product lines, for example, do not sit them together. Instead, have employees from different product lines sit near each other. This will increase the effort that a product manager will expend to manage his personnel who are dispersed across the office; however, it will provide greater opportunity for those employees to meet people working on different product lines, gain greater situational awareness, exchange ideas, and expand their individual social capital.
Homophily can be used to thicken the network by making certain traits known to others. Some organizations use a Web site to highlight individual employee profiles. Military uniforms provide a wealth of information about service members, what theaters of operation they have deployed to, special skills such as airborne or combat diver. Social forums are sometimes offered such as a weekly bible study or exercise group. These strategies all take advantage of homophily to increase the social capital of individuals and thicken the social network.
Transitivity and balance can also provide mechanisms for increased collaboration. Ad hoc project teams and short-term projects may provide opportunities to put people from diverse parts of the organization together. These individuals may introduce members of the ad hoc team to others in their long-term section based on transitivity. If there are issues of affinity and dislike, carefully constructed team assignment based on balance theory may help alleviate organizational conflict.
There are endless methods to increase the volume of connections in an organization. This is typically more advantageous for learning/adaptive organizations than for efficient organizations. All strategies will consume resources, so the value realized in a thicker network must justify the expense. This section highlights some easily implemented strategies for thickening a network. The reader is encouraged to review Chapter 4 and reason through additional strategies that may increase collaboration in their organization.
Thinning a network is essentially the inverse problem of thickening a network and it is also based in the theories of social link formation presented in Chapter 4. Efficient organizations may wish to thin a network to increase time spent on task performance and reduce social interaction. In criminal and military applications, thinning a network might be conducted to disrupt or degrade the performance of a network.
Proximity can be leveraged to thin a network. Increased physical barriers will reduce opportunities for interaction and relationships will atrophy. Creating physical barriers could be as simple as closing off a doorway or removing a common break room. Organizational barriers could be created through increased management reporting layers. Communication outlets could be restricted through blocked Web sites, reduced phone access, restricted phone numbers that can be dialed on particular phones.
Another approach for thinning a network is to remove highly central nodes or disrupt central links. Identifying boundary spanners who are low in degree and high in betweenness can be particularly effective. If highly central nodes cannot be removed, they can be more closely managed and influenced as opinion leaders and informal leaders. Informal leaders that cannot be managed should be removed through relocation, promotion, or lay-off. Beware that the perceived treatment of informal leaders will have a definite impact on the organizational culture. Informal leaders may also continue to wield influence in the organization after they have officially left the group.
Enhancing team identity or having subgroup competition can increase the subgroup identity over the larger organizational identity. A strong team identity can create perceptions of within team homophily and heterophily with those outside the subgroup. This can increase a silo effect within teams. As with thickening a network, there are many ways to thin a network. Strategies are based on theories for social link formation presented in Chapter 4. The reader is encouraged to reason through other strategies that may thin a social network.
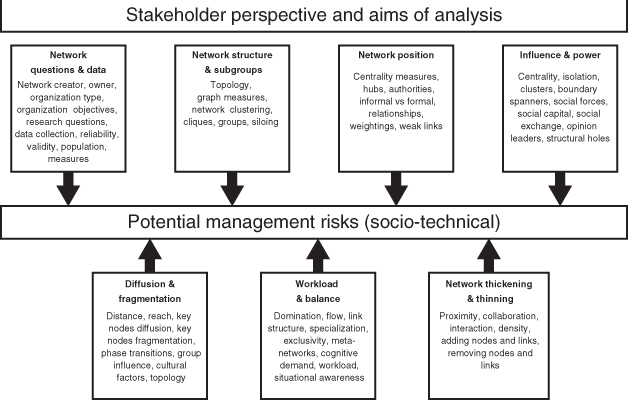
Network analysis can assist in the identification of potential threats and is valuable to include in the early stages of risk analysis and management. Social network analysis also has a role in the development of mitigation strategies, permitting simulation of situations while investigating the impact of actions that change the network structure and dynamics. The following activities provide a useful approach for the application of social network analysis to organizational risk. Although this set of activities does not form a rigorous methodology, it can be a valuable guide in studying an organizational situation of interest using network analysis. Figure 9.15 has been drawn from these activities and illustrates the areas that need to be considered in analyzing risk in organizations using network analysis.
Figure 9.15 Activities in identifying risks in organizations.
Risk is the effect of uncertainty on objectives. The effect of a risk occurring can be either positive or negative. Organization networks have a purpose, and risk in networks relates to the network's ability to achieve its objectives. Factors influencing network risk can arise from both internal and external sources.
Threats to social networks take the form of removal, addition, or modifications of nodes and/or links. Nodes and links are the components of networks and threats to networks emanate from changes to these components.
Measures used to investigate social network risk in organizations are the same measures used to study social network structure and activities in organizations. Centrality measures can indicate risks as well as network strengths and form the basis of other indicators that are used in network risk analysis. Position in the network and structure of groups can affect the diffusion of information and ideas as well as the network's susceptibility to fragmentation.
Potential risks in organizational meta-networks can be identified by studying the distribution of knowledge, resources, roles, and tasks. Specialization and exclusivity indicates that knowledge, resources, and roles, etc. are held by only a few, making these key people targets for removal from the network. Imbalance in the distribution of workload, weak levels of situation awareness and isolation of key nodes are risks to the network achieving its objectives.
Efficient organizational structures are commonplace in manufacturing and other hierarchical networks. These organizations have a clear reporting structure and links between individuals are predominantly with those who are members of the same groups or departments. Collaboration is not an objective, efficiency of processes is the main aim and relationships are built around the achievement of goals associated with production levels.
A learning organization on the other hand illustrates a network that is much denser than an efficient organization, as collaboration is needed in order to achieve the objectives to integrate knowledge and resources with tasks to get a job done and generate new ideas.
Thickening the network can be achieved by encouraging increased interaction with others, particularly those in different groups and developing redundant connections to increase collaboration and supporting the exchange of ideas. This can be done physically by assigning people to teams, providing an open workspace, a meeting place, and positioning individuals to maximize exchange and collaboration.
Thinning the network can be achieved by increasing physical barriers between people, blocking information flows or removing highly central nodes or dislocating central links. Individuals and resources can be moved, reassigned, disabled, or removed altogether.
Gamesmith Pty Ltd. is partnering with Raveda Pty Ltd. for a joint venture. Gamesmith is a computer game development company, who specialize in security games for corporate training. They have several “games” they use in training focused on offensive and defensive cyber warfare, penetration testing, and network security. Raveda are a consulting company specializing in competitive intelligence and market force advice. The two companies jointly tendered for a project with the government and have been successful.
The project requires the collection and analysis of intelligence through the delivery of security training via security games. The government wishes all employees within several of its key departments and business-to-business partners to undertake professional development in network security to enable intelligence data to be gathered and analyzed on their patterns of attack and defense, their strategies in cyber warfare, and use of information. Basically they are gathering data on the behavior of their employees and business partners. These data will then be fed into the national defense intelligence system to identify potential operatives for national security agencies as well as potential terrorists and insiders. The new project is called HI3.
Gamesmith and Raveda have combined their employees for this project. This meta-network has node types of Agent, Task, and Knowledge. Agents 1–12 are from Gamesmith and Agents 13–20 are from Raveda. There are two (Agent  Agent) networks, the formal network and the informal network for the merged project. The formal structure for the joint project looks like this:
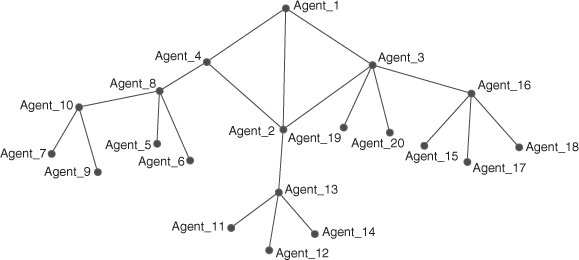
Agent_1 is the overall boss and his supervisory team consists of Agents 2, 3, and 4.
Enter the data from Table B.15, Table B.16, Table B.17, Table B.18 and Table B.19 in Appendix B into ORA and generate some reports summarizing analysis of this meta-network. The Management, All Measures, Key Entities, and Critical Set reports will give you information you may find useful. Other reports can also provide good information in your analyses of this organization.
You are required to analyze the network and identify concerns (threats) for the executive manager who is not shown in the network, to whom Agent_1 reports. The Executive Manager has employed you to complete this report, which will be submitted directly to him. To complete this task you need to visualize and analyze the networks through both the visualizer and reports. This is a meta-network so you will need to use meta-network measures in the reports.
Some questions that may assist you in your analysis are
Some questions you might ask in your analysis could be
9.1 Choose an organization you know well—for example, the company or department where you work or a sports group to which you belong. Think about the structure of this group as a network and identify who has knowledge, who undertakes tasks, how the people interact or collaborate. How could you increase collaboration or the exchange of ideas in this network?
9.2 Identify the risks that this group faces with regard to its structure, the key people, and the interactions between people in this group. Are there any people with exclusive knowledge or exclusive control over resources? How could you reduce the risk in this network?
9.3 Think of 10 ways you could thicken a network to encourage innovation and new ideas.
9.4 Think of 10 ways you could thin a network to increase control and efficiency.
Carley, K., Reminga, J., Storrick, J., and Columbus, D. (2011). Ora user's guide. Technical Report CMU-ISR-11-107, CASOS, CMU.
Daft, R. L. and Armstrong, A. (2009). Organization theory and design. Nelson Education.
Reminga, J. and Carley, K. (2003). Measures in ORA. CASOS, Carnegie Mellon University.