As we've seen before, Lambda functions save their log events to CloudWatch. This lets us to watch our application's status easily, and we do not have to maintain any logging infrastructure for that. This is already a cool feature.
If you've ever used a logging solution such as Kibana, you should be familiar with saving search patterns in it, so you can create graphs using the occurrence frequency of a pattern in your logs. This is possible to have some functionality very easily in CloudWatch logs. This feature is called Create Metric Filter and automatically tests custom patterns against log lines and pushes them as a metric to CloudWatch. With that, for example, you can see how many times your log contained an ERROR string, you can monitor it via CloudWatch graphics, or you can even create alarms and take action when your application error rate is very high.
To set up a metric filter, you can click to the Logs link on CloudWatch console. As our TestLambda is being invoked continuously because we set up Route53 Health Check, you can already see the log group belonging to the TestLambda function. Now you can click on it and explore the log events:

To create a metric filter, you can select the log and click on the Create Metric Filter button.
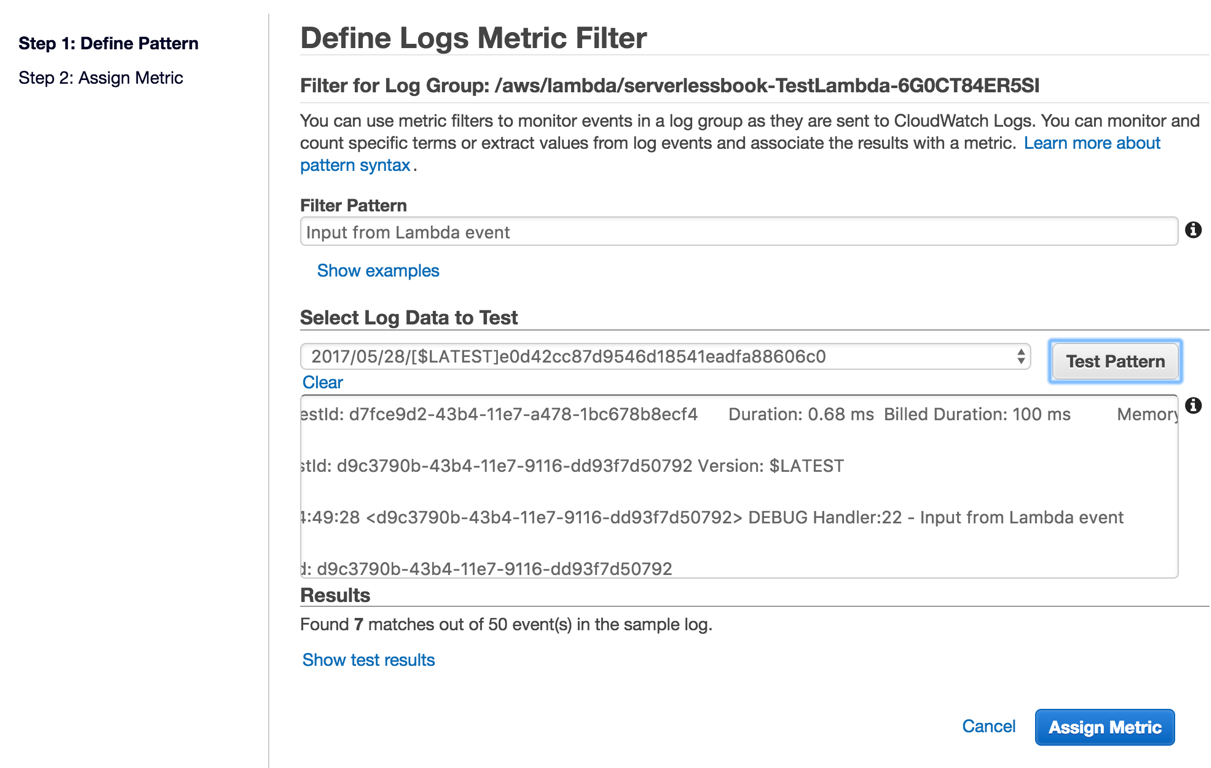
On the next screen, you are shown some selected events from the log file and asked to enter a filter pattern:

As you remember, in our code, we wrote a logging instruction that always pushes Input from Lambda event text into the log. We can use this string to see how many times our Lambda is invoked, so let's write this text in the Filter Pattern box and click on the Assign Metric button to skip to the next step.
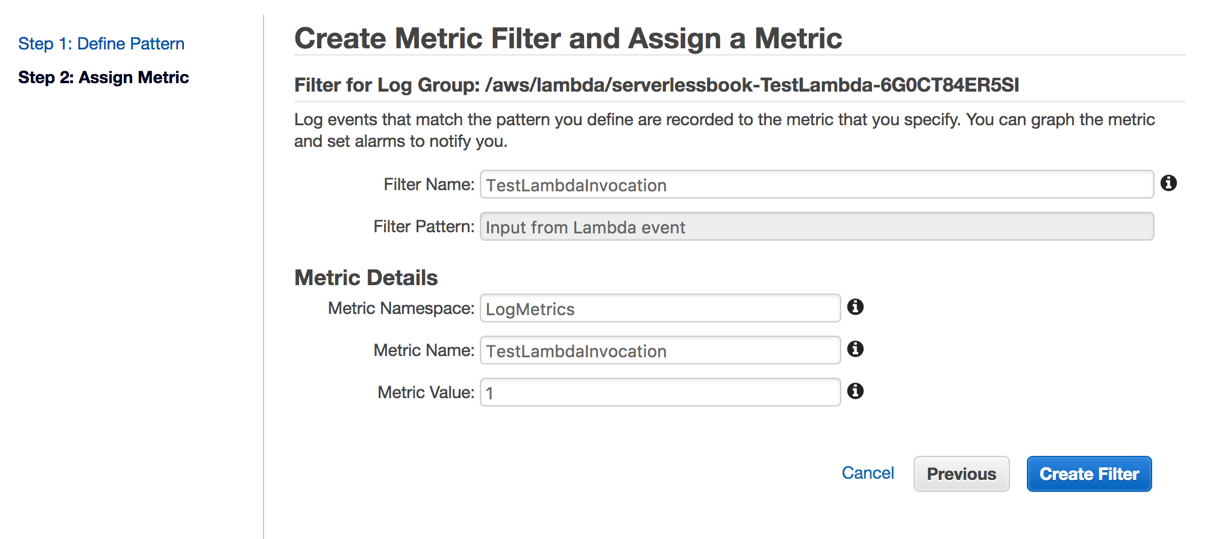
On the next screen we are asked to enter a Filter Name, Metric Namespace, and Metric Name value:

You can write whatever value you want, just be careful to decide about a namespace value so you can see all your application log metrics in one place. After you write the values, you can click on Create Filter button and create the metric.
After waiting a bit, you can click on Metrics and see that your logs are being analyzed and the results are being printed on the graph:

Now, just remember that you can create an alarm, then this alarm can send an event to a SNS topic, and from there you can invoke another Lambda function, send notification to different mediums (email, SMS, even push notification for mobile device) and so on. This is the power of AWS: there are tools and it is up to you how to glue them.