Figure 7.1
Conceptual dependencies. Source: Suwa and Tversky 1997, 394. Reprinted with permission.
7
Further Insights
In this chapter, insights from thirteen studies in which linkography was used (for a variety of purposes) are reported. In some of them, linkographs of the original kind were used; in others, the linkographs were modified somewhat to suit the needs of specific research goals, and in one study, linkography was evoked as a metaphor. The reports are not meant to be critical; rather, they are meant to be impartial and faithful to the works they represent. The intent is to offer a glimpse at wide applicability options for linkography, beyond what has been dealt with in the previous chapters. In a few instances, I add a minor comment expressing my own view.
Design Problem-and-Solution Spaces
Kees Dorst (2003) was interested in the structure of design problems, which, he claimed, had not been studied sufficiently. Alongside the design process and the designer, the design problem is of great importance in the development of design strategies and methodologies. As was noted in chapter 2, design problems are considered to be ill-structured and even wicked. Dorst described the two major approaches to dealing with such problems, as exemplified in the writings of Herbert Simon and Donald Schön.
Simon (1973), who had developed a theory of problem solving for well-structured problems, recognized the difference between well-structuredness and ill-structuredness of problems. The differences notwithstanding, he thought that in principle both kinds of problems are subject to rational problem solving. Such problem solving takes place within a designated problem space (in which problem-related knowledge is represented) and a solution space (in which solution-related knowledge is represented). In this view, the problem space of an ill-structured problem is too large; consequently, the problem solver works within only part of the problem space, and the ensuing solution is therefore satisficing (sufficiently satisfying; good enough)—it need not be optimal. This approach is called technical rationality.
For Schön (1983), technical rationality is the wrong paradigm for the treatment of ill-structured problems, which are frequently encountered in practice, including design practice. Departing from a constructivist point of view, Schön advocated reflective practice, which is seen not as a way to solve problems but as a way to frame and reframe problematic, even “messy” situations, until they become malleable. In the case of design, this happens in a design space (rather than problem space). Schön’s approach resembles the Gestalt approach to solving novel problems in that it requires productive (as opposed to reproductive) thinking. The reflective practitioner uses experience and a repertoire of previously mastered solutions to see a messy situation in a new light wherein professional intervention is both possible and fruitful.
Dorst maintained that neither Simon nor Schön paid sufficient attention to the structure of a problem (or a situation). He believed that problems differ, some likely to fall into the rational paradigm and others into the reflective paradigm, and that the two approaches can be combined. Combining them, he thought, would lead to a definition of design tasks as situated problems, the structure of which Dorst wished to study by “describ[ing] the behavior of designers as operations on the design problem.” Dorst hoped to achieve this by using linkography. He opted for the matrix version, and proposed to use three different linkographs to record three different types of links between problem elements and solution elements that would be extracted from protocols, as follows:
Linkograph I would link among problem elements, ignoring solutions.
Linkograph II would link among solution elements, ignoring problems.
>Linkograph III would link among problem and solution elements.
From these three linkographs Dorst expected to learn about different structures of design problems, as related to the paradigms of technical rationality and reflective practice. He predicted that in rational problem solving, the design activity would focus first on the problem(s) and not on solutions, and that because to this focus there should be many links among problem elements (linkograph I). The solution would be tackled only later in the process (linkograph II). He also estimated that the reflective practice paradigm should yield many links among problems and solutions, starting early in the process (linkograph III). Dorst proposed that the complete pattern of problem-solution connections that would be imposed on the problem and the solution would be a frame and the actual linking of problem and solution would accordingly be the activity of framing.
Conceptual Dependency Links and Chunks
Masaki Suwa and Barbara Tversky (1997) were interested in architects’ interpretations of their own sketches. They conducted a two-phase experiment with two experienced architects and seven advanced architecture students as subjects. In the first phase, each designer was asked to design a museum and its surroundings in a 45-minute session, which was videotaped. In the second phase, each participant was asked to articulate, while viewing the corresponding videotape, the thoughts he or she recalled having at the time each sketch was made. The verbalizations were recorded and transcribed into protocols, so this method falls into the category of retrospective protocol analysis. The protocols were parsed into segments (resembling design moves), which then were encoded by means of a category scheme that included four major categories, each further divided into subcategories. On the basis of the encoded protocols, Suwa and Tversky were able to point at a number of differences in the ways experienced architects and students used their sketching activities to develop design solutions.
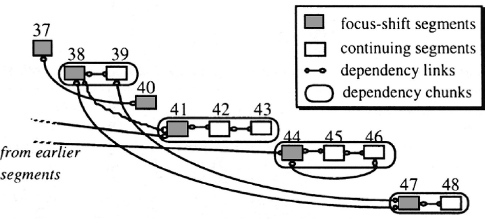
Later, Suwa and Tversky looked at links among protocol segments. Rather than produce linkographs per se, they established what they called “conceptual dependencies” among segments, on two levels. What they characterized as a conceptual dependency between a segment and a previous segment was identical to what I call a backlink. They soon discovered that “the entire design process includes many blocks of contiguous segments” (1997, 392). These blocks were called “dependency chunks,” a chunk being a small unit typically consisting of two or three segments. What Suwa and Tversky mean by “chunk” is very different from what I mean by the same term (see chapter 4). Links among adjacent segments within a chunk are reminiscent of a sawtooth track pattern. Suwa and Tversky interpreted such links as representing in-depth, detailed explorations of a design topic akin to what Vinod Goel (1995) called “vertical transformations.” The same segments may, however, also display links to more remote previous segments, which are not included in the same chunk. Goel called such links “lateral transformations.” There are also stand-alone segments that do not belong to chunks.
Figure 7.1 is a schematic representation of dependency chunks comprising twelve segments and dependency links among them in a small portion of Suwa and Tversky’s analysis. The first segment of a new chunk (or a stand-alone segment) was taken to represent a shift in focus. Suwa and Tversky found that the architects in their study had “remarkably more continuing segments” (within chunks) than the students. This led them to conclude that the architects had shifted focus less often. According to Suwa and Tversky (1997, 395), the difference stemmed from the architects’ ability to “‘read off” more different types of information from their sketches.” Suwa and Tversky concluded their paper by recommending that a design-support tool that is intended to replace paper sketches should be able to evoke new ways of “reading off” information from sketch-like depictions.
Figure 7.1
Conceptual dependencies. Source: Suwa and Tversky 1997, 394. Reprinted with permission.
Topic Shifts in Design
David Botta and Robert Woodbury (2013) were interested in design histories and especially in topic shifts. They developed a model that used an algorithm and linkographs to predict the locations of topic shifts. Their findings indicated that the rate of success of the predictions was reasonably high in large series, or data sets, but poor in small series, when compared to an independent human assessment of topic shifts in the same data sets. Botta and Woodbury posited two hypotheses: that “a linkograph that is constructed from finer-grained design moves than topical segmentation can be used to predict topical segmentation” and that “the topical segmentation can provide a dynamic granularity by which to filter transitive links” (ibid.).
Botta and Woodbury’s data consisted of protocols of eleven instructional design meetings, each two to three hours long, in which a team worked to develop a broad first-year university course in design thinking. The first two meetings were exploratory, and Botta and Woodbury used them for a pilot study; the data obtained from these meetings were the notes of an observer. The subsequent nine meetings were audiotaped and then transcribed into protocols, which were segmented into units of one sentence each. A linkograph was generated for each meeting. No initial breakdown of the meeting into separate units according to subject matter of the conversation was attempted (quite on the contrary, performing this breakdown mechanically was one of the goals of the study). Figure 7.2 shows an example of the linkographs produced in this study.
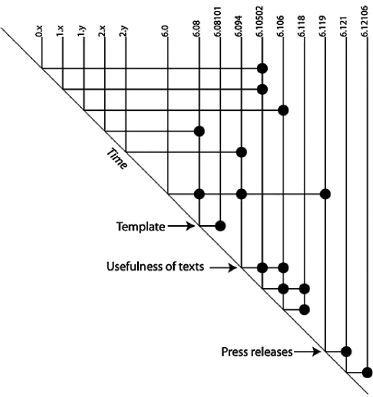
Figure 7.2
An extract from the linkograph of meeting IV. Source: Botta and Woodbury 2013, 249. Reprinted with permission.
After all links had been notated, Botta and Woodbury felt that only links between segments that were remote in time (which they called “deep links”) should be considered; therefore they developed rules for filtering out links they considered to be transitive. If segment n linked back to segment n – 3 and to segment n – 6, the link to n – 3 was filtered out because it was considered insufficiently deep. Botta and Woodbury called this “the skip three segments rule.” A mathematical model (an algorithm) that was based on the first two exploratory meetings looked at the contribution of links to a measure of a topic shift. Contributions varied between 0 and 1 per link and were calculated separately for the sum of forelinks and the sum of backlinks. The algorithm was calibrated by trial and error to suit the more detailed data of the subsequent nine meetings.
The model succeeded in predicting topic shifts in long series, with a success rate greater than 0.6. Any discrepancies between the predictions by the model and human assessment were attributed mainly to the fact that a human tends to choose the first sentence in a group of interlinked sentences as the initiation of a topic while the model relies on a linking measure that is sometimes higher for subsequent nearby sentences in the discussion, which expose the meaning of the topic more forcefully. When the method of interpreting the topic-shift measure was somewhat relaxed, a higher prediction rate (0.8) was achieved. The relaxation allowed the link-contribution measures of a few subsequent sentences to be added to the lead sentence, in case the measure of the initial sentence was significant but below a predetermined threshold. The number of added measures could be varied. Other relaxations included repetitions and redundant material: paragraphs that covered a lot of material, and frequent reminders of recent issues of the “just said” and “incessant” kind, were omitted from the count. The purpose was to achieve “thick descriptions.” The results roughly matched the predictions of topic shifts made using the “skip three segments” rule. Other cases of relaxation included segments with mainly transitive links in a text that was considered a “calling text,” defined as having at least one deep (i.e., not transitive) link. These and other relaxations made for a sufficiently dynamic model that could adapt itself to local circumstances of various portions of a design process.
Botta and Woodbury concluded that the results they obtained, although encouraging, were rather weak in predictive power, especially for short series. However, they expressed hope that further development would be able to increase the rate of success, especially if an automated system for the construction of linkographs could be devised. Botta and Woodbury asserted that knowing the locations of topical shifts in a design history helps to bridge the gap between conversation and visual representations.
Extended Linkographs
Hui Cai, Ellen Yi-Luen Do, and Craig Zimring (2010) explored the effect of inspiration sources on the design process, which may be positive if they enhance idea generation or negative if they cause fixation. For their empirical study, Cai et al. developed an extended version of the linkograph. Their desire to treat relatively long protocols ruled out the use of moves as units of analysis, as there would have been too many of them. Participating designers were asked to sketch in response to given visual stimuli, and their sketches were taken to reflect the influence of the sources of inspiration (the stimuli). Accordingly, the sketches were chosen as units of analysis. Each sketch was examined for its links with previous sketches and with the original stimulus.
The links among sketches were seen as transformations. In line with the terminology of Goel (1995), they were classified as lateral transformations (LTs) or vertical transformations (VTs). A lateral transformation is a slightly different or alternative idea; a vertical transformation is an elaboration or detailing of a previous idea.1 This distinction is notated in an extended linkograph, as shown in figure 7.3. The links can be counted separately, LLT representing lateral transformations and LVT representing vertical ones. Cai et al. asserted that the division into two types of transformation is relevant to the impact a stimulus has, and is also indicative of creativity: Along with a larger number of webs and chunks, vertical transformation represent a bolder detachment from the stimulus. A separate link-density index (the equivalent of link index) can also be calculated for the two types of links. Figure 7.3 illustrates the process of a participant who produced four sketches for two alternative solutions (solutions T-N1 and T-N2). T-N1 consisted of only one sketch, whereas T-N2 included three sketches. The links among these sketches are notated in a regular linkograph and in an extended linkograph that breaks the linkograph into two perpendicular sublinkographs.
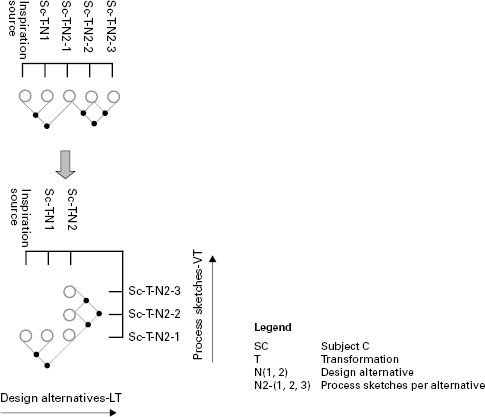
Figure 7.3
From linkograph to extended linkograph. Source: Cai et al. 2010, revised. Reprinted with permission.
Refining the Function-Behavior-Structure Ontology
A coding system for design protocols called the FBS (Function, Behavior, Structure) ontology, advanced by John Gero and associates, was mentioned in chapter 2. Introduced in a 1990 paper by Gero, it has undergone development ever since then. This ontology is designed to overcome difficulties stemming from the use of custom coding schemes. The use of such schemes “limits the applicability of the results obtained” (Kan and Gero 2009a, 228) because they are too particular to the case in hand. Function, behavior, and structure (and their subcategories) are independent of design domains and cases, as well as of the number of designers, and are claimed by Gero and associates to be a generally applicable coding basis.
In order to refine the system, Gero and his associates (Kan 2008; Kan and Gero 2009a; Pourmohamedi and Gero 2011) applied linkography to the FBS coding system. They started with a basic coding scheme comprising the following main categories and subcategories: Function (F), Structure (S), Expected behavior (Be), Behavior derived from structure (Bs), and Documents (design description) (D). The relationship between elements thus coded represents the following design activities: formulation (inferring expected behaviors from functions and requirements), analysis, synthesis, evaluation, documentation, and three levels of reformulation (changing the space of possible designs by changing the structures, behaviors and functions). Two additional categories are requirements (R) and others (O). The latter may be taken out of the analysis later on. The protocol Kan and Gero (2009a) analyzed was of a session of an engineering project in which a two-person team worked on a new thermal printing pen. The session was selected because of the many analogies the designers evoked, which interested the researchers. The protocol was divided into segments that are precisely equivalent to moves. After they were coded, a linkograph was constructed in order to determine links among segments of different codes. Figure 7.4 shows a portion of the linkograph.
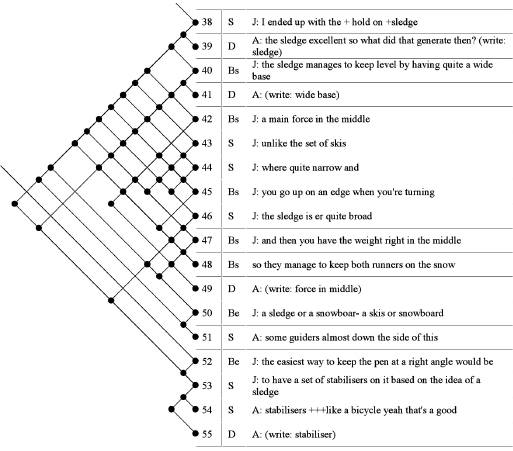
Figure 7.4
Partial linkograph with protocol segments by designers A and J, coded according to the FBS scheme. Source: Kan and Gero 2009a, 218. Reprinted with permission.
By comparing the percentage of segments of each code with the percentage of links generated by segments of the same code, the researchers were able to compare the frequencies of the codes with the linking evidence and found that linking rates were above the frequency levels for segments coded S and Be; other codes displayed a slight drop in linkage rates compared to their frequencies (except R, which remained unchanged). The conclusion was that S and Be segments were more influential. Next the researchers determined which codes linked to same and other codes. After consolidating codes into groups representing design activities, they were able to look at frequencies of transformations. They found that the most prominent type of transformation was from S to S (notated S>S), which was translated into level 1 reformulation. Next in prominence were analysis (S>Bs), evaluation (Be<>Bs), and synthesis (Be>S), in a descending order of occurrence and percentage. Kan and Gero (2009a) went on to refine their analysis by making some further distinctions within a “situated FBS framework” in which they introduced interactions among external, interpreted, and expected “worlds of design.” They repeated the previous analytic procedures to determine frequencies of transformations, based on links. Kan and Gero concluded that “the links not only provide a structural view of the processes but also locate the dominant codes and the frequency of each design transformation process” (ibid., 228). The combination of linkography and the FBS ontology gives a sharper view of the network of acts in designing.
To facilitate the analysis of FBS-based linkographs, Pourmohamedi and Gero (2011) developed a software system called lincoder.2 Once a protocol is parsed using the FBS codes, the program automatically draws the corresponding linkograph and analyzes it in accordance with a number of built-in quantitative parameters. In addition to the calculations performed by Kan and Gero (2009a) regarding distributions and frequencies of codes, these parameters include first-order and second-order Markov models and entropy calculations. The system is also capable of “fractioning,” “windowing,” and “trimming” linkographs; all these operations are aimed at isolating a portion of a linkograph in order to analyze it and perhaps compare it with other portions of the same or another linkograph. Pourmohamedi and Gero say they hope to further develop this program with open coding possibilities instead of the current restriction to the FBS ontology. They are also ready to rise to the formidable challenge of automating the coding and linking stages of protocol analysis and linkograph construction, which they rightly claim requires a lot of labor when done manually.
Problem Framing in Different Design Settings
Thomas Kvan and Song Gao (2006) set out to explore the important activity of problem framing by design teams in digital and paper-based settings. Problem framing was adopted from Schön (1983, 165) as the initial phase in ill-defined problem solving wherein problem solvers “determine the features to which they will attend, the order they will attempt to impose on the situation, the directions in which they will try to change it. In this process, they identify both the ends to be sought and the means to be employed.” In this study an experiment was carried out in which participants solved a simple design problem in three different settings: online remote (chat-line-based textual communication and digital drawings), online co-located, and paper-based co-located. Six teams of two student designers each were assigned to each of the settings. The sessions were recorded and protocol analysis was employed. The protocols were parsed into moves, which then were coded using a scheme (adopted from Schön 1983) that had three categories: framing, moving, and reflecting.
The count of the categorized moves showed a significant difference between the online remote setting, which had a low number of activities, and the two co-located settings, which yielded a much higher number of overall activities. The frequency of each activity category in the three settings was inspected, and it was found that the online remote setting had the highest percentage of framing (almost 45 percent), and the lowest percentage of moving (less than 25 percent). No significant differences were found between the other two settings, and the proportion of reflecting was similar in all settings (about 33 percent).
Next, linkographs were constructed for each of the teams, and were divided into components. A component was defined as “one unit in which all design units are inter-linked” (Kvan and Gao 2006, 251), which is reminiscent of the term “chunk” as introduced in this book. The average number of components was highest in the paper-based setting and lowest in the online remote setting. The latter setting had the highest average link index, somewhat higher than the average for the other two settings. Kvan and Gao then singled out the largest components in each setting and compared them on diameter (“the number of linked design moves”; in our terms—link span) and depth (“the largest number of nodes linking two discrete design actions in a component”). The online remote setting had the greatest depth and the smallest diameter; the online co-located setting had the lowest depth and the largest diameter.
The rest of the study focused on the largest component of each setting, for which two ratios were calculated: R1 (the ratio between the number of activities in the largest component divided by the number of activities in the entire protocol) and R2 (the ratio between the greatest depth in the largest component divided by the number of activities in the entire protocol). The highest R1 and R2 values were found in the remote online settings. Figure 7.5 shows the linkograph of one of those remote online protocols.
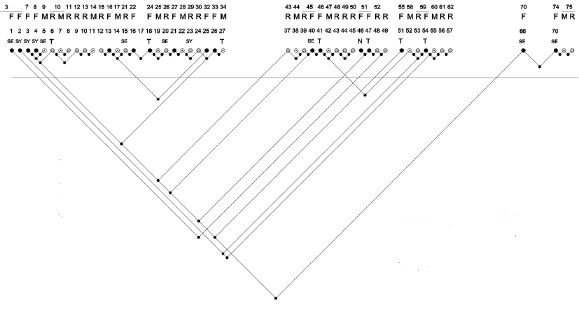
Figure 7.5
Linkograph of an online remote setting. Source: Kvan 2013, 78–79. Reprinted with permission.
The linkographs of the components with the highest R1 values in the other settings were much shorter. The percentage of framing activities in them was considerably lower; the R2 values were also much lower. For both ratios the components in question were poorly or not at all interlinked with adjacent components that preceded and followed the component under investigation.
Kvan (2013) concluded that the findings suggest that digital tools are not detrimental to problem solving in conceptual design, that they do not interfere with framing, and that in fact they may support framing. This conclusion was surprising and counterintuitive, especially since it stands in contrast to designers’ subjective reports and to findings in some other research projects. It was acknowledged that the sample was too small to allow general conclusions to be drawn, and that the quality of the resultant designs played no role in this study. Kvan (ibid.) explained that the insights gained from the study suggested that multiple representations in different modes (including textual communication) are always advantageous. He believes that diagramming (sketching) is essential in designing; digital tools, especially in a remote collaboration, enable higher levels of abstraction, which in turn enhances interpretative activity, which leads to framing and reframing. This may explain the results obtained in this experiment.
Entropy and Productivity
In a number of papers (Gero 2011; Kan 2008; Kan and Gero 2005, 2008, 2009b; Kan, Bilda, and Gero 2007), John Gero and associates explored the use of entropy measurements based on linkographs to assess the productivity of design processes. According to the notion of entropy they used, which was taken from information theory (Shannon 1948), “the amount of information carried by a message or symbol is based on the probability of its outcome” (Kan and Gero 2005, 52). Entropy is the amount of information that is missing before reception, or before communication is achieved. Kan and Gero applied this notion to the design process and claimed that a link between moves is information—the link is considered ON. Where there is no link between two moves, the link is considered OFF. If all moves are linked to all other moves in a linkograph, that is, if they are all ON, the linkograph is saturated. Shannon’s theory looks at the relationship between ON and OFF nodes in a selected set of symbols to calculate the set’s entropy. Maximum entropy (H) is achieved when that relationship is unpredictable, because this situation is diversified and allows for surprise and further development. The maximum value, which is H = 1, occurs when half the nodes are ON and the other half are OFF. In a linkograph of n moves, the potential number of links is n(n – 1)/2 and therefore the highest entropy is achieved when the number of links is n(n – 1)/4. When the linkograph is either empty or fully saturated, the entropy is at its lowest level, H = 0.
The linkograph sets chosen by Gero and his associates for entropy calculations are diagonal rows of backlinks that measure enhancement and confirmation, diagonal rows of forelinks, measuring the new idea-generation opportunities, and the “horizonlinks,” the links along horizontal rows that measure cohesiveness and incubation. Figure 7.6 shows these rows. Entropy is calculated for each row separately according to a probability algorithm devised by Shannon. A mean value can then be calculated for each of the three types of rows.
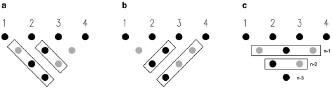
Figure 7.6
Entropy measured by rows: (a) rows of forelinks; (b) rows of backlinks; (c) rows of horizon links. Source: Kan 2008, 30. Reprinted with permission.
According to Jeff Kan, John Gero, and their associates, entropy is a yardstick for measuring productivity. High entropy is indicative of a productive process; the researchers maintained that when the proportion of ON links is between 0.35 and 0.65, then H > 0.93. In other words, if the rate of linking is between one-third and two-thirds of all possible links, the process is productive and we should expect a good outcome.
Kan and Gero (2005) and Kan (2008) provided the preliminary theoretical basis for design entropy measurements. In work that was reported in further publications, the researchers tested actual cases. Kan et al. (2007) looked at one of the findings of Bilda et al. (2006): that blindfolded architects who had successfully completed a 45-minute design session using imagery only showed a decrease in cognitive activities after about 20 minutes. Kan et al. (2007) asked whether this drop corresponded to a drop in entropy. They constructed linkographs of twelve design sessions undertaken by six participants in the experiment. Each participant completed two sessions: one in which sketching was allowed and one in which the designer was blindfolded. Entropies were calculated for the first 20 minutes, and for the remaining time (approximately 25 minutes) of each session. Values were normalized by dividing the sum of entropies of each segment by the number of segments; this was done for the three types of entropy described above. Entropy was found to have decreased in the second half of the session in all but one of the sketching sessions. In the blindfolded condition, results were mixed: half the participants showed similar trends in both session types; in the other half entropy values increased in the second half. This meant that the decrease in cognitive activities did not necessarily lead to a decrease in the generation of new ideas in the blindfolded sessions. When dynamic entropy charts were plotted to represent the entire linkographs, an interesting finding emerged. The plots were overlaid with quadratic (second-degree) polynomial fit curves. These may take one of three shapes: linear, ∪, and ∩. According to Kan et al. (2007, 373), “the ∪shape trend suggests that the entropy values are climbing toward the end of the session indicating a well-integrated process, whereas the ∩shape trend suggests the opposite.” In these plots the trend remained the same for each participant across conditions, which may be related to individuals’ cognitive styles. Another observation was that the three sessions that scored the highest qualitatively all had ∪-shaped curves, whereas the three sessions that scored the lowest all had ∩-shaped curves. This may suggest that high entropy toward the end is, by and large, a sign of a productive session.
In Kan and Gero 2009a, the authors extended the argument that linkographic entropy indicates productivity to claim that it is also a hallmark of creativity. They conducted an experiment in which they compared the processes of two teams, each consisting of two architects, that were charged with producing a conceptual design for an art gallery on a given site with a given brief. A qualitative assessment ranked one of the sessions as more creative; the other session was considered pragmatic. First Kan and Gero calculated text entropies based on the protocols. Although the more creative session boasted almost twice as many words as the pragmatic session, the relative entropy and the text entropy were identical or almost identical in both cases. In the next stage Kan and Gero used WordNet to construct linkographs of the two sessions. The linkographs were based on at least four common “synset IDs.” A synset is a cognitive synonym that can be used to group words into sets of similar meaning. Words with the same synset share the same ID. Linkographs constructed with this automated method showed semantic links among verbalizations (nouns only) in the protocols. Since the numbers of segments in these linkographs differed, they were divided into 5-minute “windows”; the mean entropy of these windows was then calculated. In this calculation a difference of about 15 percent was found in favor of the creative session. Kan and Gero also showed that the windows with the highest entropy were the most productive in terms of number of ideas generated and number of sketches produced.
In yet another study, Gero (2011) used design entropy inferred from linkographs to measure design fixation. The premise was that entropy should be lower during fixation than during the rest of the process. In an empirical study in which fixation could be qualitatively detected, a protocol was parsed and coded according to the FBS coding scheme (introduced earlier in this chapter); then a 116-segment linkograph was constructed. Entropy was calculated for portions of the linkograph, including twelve segments that appeared to display moments of fixation; this entropy was termed “dynamic entropy.” The exercise was repeated three times for three different local fixation instances. In each of these cases the entropy value at the point of fixation was the lowest in the sequence of entropy values measured for the series of twelve segments. Figure 7.7 shows a portion of the linkograph and one graph of dynamic entropy.
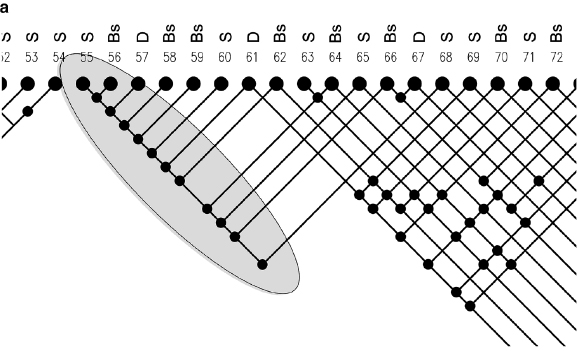
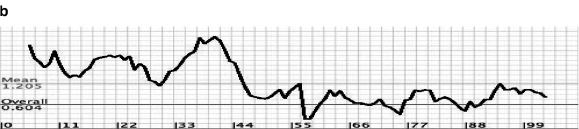
Figure 7.7
(a) A portion of a linkograph of a design session in which fixation was detected, culminating in move 55. (b) A graph of dynamic entropy values. Lowest values correspond to instances of fixation, culminating in move 55. Source: Gero 2011, 112. Reprinted with permission. Note that parts a and b of this figure are not at the same scale.
In several publications (e.g., Kan and Gero 2008), Kan and Gero also suggested looking at links in a linkograph as nodes in a plane defined by x and y axes. Each link can then have an x value (its distance from move 1) and a y value that corresponds to its link span. The x and y values can be calculated for each move, and a mean value called the centroid can be established. “A higher mean value of x,” Kan and Gero wrote, “implies that more nodes appear at the end of a session and a lower value suggests that more nodes are present in the beginning of the session. . . . A higher mean value of y indicates longer linking lengths [spans].” (ibid., 324) This gives a very rough indication of distribution of links; however, as Kan and Gero noted, it does not reveal anything regarding the spreading of the links. Therefore, they also calculate the standard deviations, “which suggest how concentrated the nodes are clustered around the means” (ibid., 324).
Linkography and Space Syntax
Tamer El-Khouly and Alan Penn (2012) sought to relate linkographs and graphs of urban systems used in Space Syntax studies. Such systems are very complex, and the authors investigated and measured properties of linkographs in order to shed light on certain characteristics that are also found in urban systems, such as access to locations via road networks. Two perspectives (seen here as discrete theories) illuminated the study: that of information theory and that of entropy theory. The main hypothesis of the paper was that “in multi-level complex systems high orderliness tends to become less complex overall, and therefore a highly linked node delivers few choices and probabilities” (ibid., 3). A further hypothesis was that “complexity is created in different scales in the graph system from the local subgraph to the whole system” (ibid., 1). In this graph system a node corresponds to a move in the terminology of this book.
The backward and forward links and “no-links” (that is, empty spots on a link line, where there are no links to other moves) of each node (move) are listed in a separate subgraph. This is noted in a combination of a backlinks string and a forelinks string, where a link is notated as 1 and its absence is notated as 0. The forelinks string follows the backlinks string, separated by a dot. The string is considered to be a “string of information” that represents the complexity of the particular subsystem. Figure 7.8 shows a linkograph and the compilation of the strings of information for node 15.
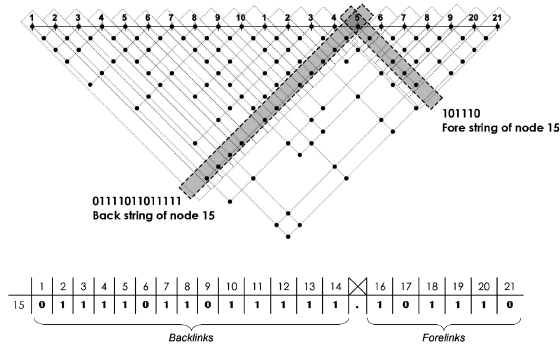
Figure 7.8
Extracting a string for node 15 in a linkograph: 01111011011111.101110. Source: El Khouly and Penn 2012, 10. Reprinted with permission.
As in Kan and Gero 2008, the premise in El-Khouly and Penn 2012 was that to achieve complexity high entropy is needed, which means a combination of ones and zeroes in strings. An “empty” string of zeroes only (no links) and a “saturated” string of ones only (each node is linked to every other node) have an equally low entropy—in fact, the entropy is zero—meaning a low probability for complexity.
Later in the paper, El-Khouly and Penn compared three types of measures extracted from linkographs—integration, complexity, and entropy—for two sets of linkographs: ordered and structured linkographs. The former are saturated, the latter are not. Then they looked at the degree of correlation of entropy, complexity, and integration. Complexity and entropy are “dynamic”; that is, they vary along the system, as each node has a different value. Many of the correlations between integration and complexity and between integration and entropy were found to be negative, and when positive they were mostly low. Correlations between complexity and entropy were positive but low. The linkographs in question were short, comprising 21 nodes, and the authors found that measures for short sequences were inadequate. Therefore they set out to look at correlations in two much longer linkographs that consist of hundreds of nodes. First, using syntactical methods, they identified the most integrated nodes and looked at similar correlations as in the short linkographs, supplemented by a few other correlations that pertain to properties that are of interest in the urban context: closeness, centrality, and betweenness. All the correlations were found to be positive, and most to be quite high. The authors concluded that “the more a node is connected to the surroundings, the less predictable the information, and therefore low string complexity results” (ibid., 19), which confirmed their main hypothesis. This result has implications for the structures of cities; for instance, when a piazza is highly accessible from the surrounding areas, navigation is clear and easy and therefore complexity is low. The combination of linkography and Space Syntax seems promising.
The Linkograph as a Visualization Tool in Project Risk Management
Kilian Gericke, Björn Kleinod, and Lucienne Blessing (2009) were interested in how risk management could be used to ensure that an engineering project remained on track. Their goal was to minimize the costs incurred when failures occur in a particular work package (a discrete phase). Such failures may also affect subsequent work packages; in fact, they may not be detected until their effects on a later work package are discovered. The aim of Gericke et al. was to easily and visually communicate the predicted failure risks such that special attention could be paid to sensitive work packages in an effort to prevent later failures. The linkograph was chosen as the means of representation. This was a theoretical study in which the units of analysis were not brief moves but rather were planned work packages along the life span of the project. In contrast with a standard linkograph, the time line on which they were indicated was time scaled.
A linkograph was generated, the planned work packages were notated, and forelinks were established between each work package and all subsequent work packages that, according to the plan, were to be affected by that work package. The cost to the affected work package if something were to go wrong in the earlier package was calculated. A choice among three cost concepts—minimum, maximum, and average cost—was offered. This cost was indicated in the linkograph next to the appropriate link. Work packages that were to be executed in parallel were notated in a column, one on top of the other. The equivalents of critical moves (“critical” has a different connotation in this study; see below) were “milestone packages”; these too were pre-determined and indicated in the linkograph. Backlinks in this notation were divided into two types. Type I backlinks were simply the links that had been established as forelinks, but in the reverse direction. Type II backlinks “represent a planned iteration in the process” (ibid., 5). To distinguish them from backlinks Type I, backlinks Type II were notated above the move, or work package line, as shown in figure 7.9.
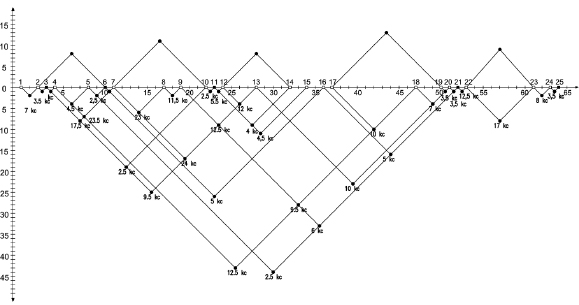
Figure 7.9
Linkograph by Gericke, Kleinod, and Blessing (2009, 7). Reprinted with permission.
Gericke et al. argued that “the later the failure is detected, the greater the failure costs” (ibid., 5). Therefore, the distance of a link (in the terminology of the present book, a link span) is important. To facilitate its representation on the linkograph, a vertical axis to the left of the network was added, with distance marks in both directions: down, in the field of the forelinks/backlinks Type I, and up, in the field of backlinks Type II.
Gericke et al. used the word “criticality” to indicate the predicted impact resulting from failure in a work package. A conceptual and dimensionless criticality index can be computed for every work package and can be used to assess the importance of monitoring it closely. The criticality index is the product of the duration and the cost of each work package divided by chosen affected units. The results are to be assessed by experts to ensure their validity. Gericke et al. asserted that the linkographic representation is easy to produce and easy to read, and that it offers a qualitative and quantitative basis for systematic risk management.
Comparison between Solving and Designing of Well-Defined Problems
The cognitive psychologists Geert Wissink and Saskia Jaarsveld (2002) were interested in differences in cognitive activity between designing and solving of well-defined problems, and between the first and second halves of such processes. Their assumptions were that more reliance on ideas generated earlier in the process occur in a designing task than in a solving task, that more different cognitive activities take place in a designing task than in a solving task, that more links among consecutive activities are apparent in a solving task than in a designing task, and that in both a designing task and a solving task the second phase (which is more exploratory and evaluative than the first) is characterized by more links among activities.
To investigate these assumptions, Wissink and Jaarsveld carried out an empirical study in which two different but related tasks were given to psychology students who were instructed to “think aloud” while executing them. The study yielded 21 usable protocols. The first solving task to be administered was Raven’s Standard Progressive Matrices (SPM),3 including three different tests. In the designing task, participants were asked to design a test item similar to the ones in the solving task. The sessions were recorded, and the ensuing protocols were parsed into five-second segments. These protocols were the basis for linkographs (the matrix version) of the designing and solving processes. The assumptions above were translated into assumed linkographic patterns and statistics as follows:
• more unlinked segments (akin to orphan moves) in the solving task than in the designing task
• more unlinked segments in the first half of the linkographs of both tasks
• more critical segments (equivalent of critical moves) in the designing task than in the solving task
• higher link indices in the designing task than in the solving task
• higher link indices in the second halves of the linkographs of both tasks
• more webs and chunks and less sawtooth tracks in the designing task than in the solving task
A one-way analysis of variance was employed to check for possible differences among the three solving tasks in the mean numbers of segments, of links, and of link indices. Because no significant differences were found, the mean values could be compared with the values obtained in the designing task. The first comparison pertained to the number of segments. Significant differences were found between the tasks (the designing task took considerably longer and involved more segments). The distribution of links within each task was quite uneven, but with a normal overall distribution. The following results were obtained:
Unlinked segments The assumptions that there would be more unlinked segments in the solving task and more unlinked segments in the second halves of both tasks were not confirmed. The only significant differences were found in a comparison between the first and second halves of both tasks: for both halves the proportion of unlinked segments was smaller in the solving task.
Critical segments Critical segments were checked at the threshold level of five links. A small number of critical segments was found in the linkographs of both tasks, and especially in the solving task. I propose that the reason is most probably that the threshold level was too high for these tasks and possibly for well-defined problem-solving protocols in general.
Link index The assumption that the link indices of the second halves of both sets of linkographs would be higher than those of the first halves of those linkographs was confirmed for both the solving and the designing tasks. However, the main assumption that the mean L.I. of the designing task would be higher than that of the solving task was not confirmed. The reason may be that the number of links in these linkographs is quite low to begin with, in part because of a relatively high proportion of unlinked segments, but possibly also because of the way a link may have been established. The L.I. values that were obtained in this study are particularly low: the means vary between 0.43 and 0.72.
Sawtooth tracks and chunks Contrary to the assumption, more sawtooth tracks were found in the designing-task linkographs than in the solving-task linkographs. In accordance with the assumptions, more chunks were found in the linkographs of the designing task than in those of the solving task, although the difference is not statistically significant. The number of chunks was low, especially in the solving-task linkographs. No webs were found in any of the linkographs.
Link depth The mean link depth (link span) was measured for the two sets of linkographs. The designing task boasted a significantly higher link depth than the solving task, meaning that segments were more frequently linked to segments farther away in time in the designing-task than in the solving-task.
Although many of the assumptions were not confirmed in this study, it did reveal certain differences between the solving tasks and the designing tasks. The more significant indicators were link index, critical segments, unlinked segments, and link depth. In addition to questioning the theoretical basis of the assumptions, we may question the logic of segmentation by time units, especially since in this study segments were also assigned to periods with no verbal activity, thus reducing the number of links and the resultant link index. We may also question the usefulness of linkography for the study of well-defined problem solving, in which the search for a solution involves a fixed routine. The importance of calibration (what is considered a segment, a link, what threshold should be used for criticality measures, and so on) is a major lesson to be drawn from this study.
Comparison of Modes of Representation at the Front Edge of the Design Process
To compare the cognitive effects of three different modes of representation in the early phases of designing, Benay Gürsoy and Mine Özkar (2010) conducted an experiment in which three designers of equal experience solved three different short design problems of similar complexity. For each problem they were allowed only one representational mode, which varied across problems. The modes were freehand sketching, a matchbox model (later developed into a cardboard model, but that phase was not analyzed), and a digital model. The designers were asked to think aloud. The taped verbalizations yielded nine protocols (three per designer and three per representation mode). The protocols were parsed into moves ranging in length from 5.9 to 40 seconds. The total time per task, which was not restricted, also varied greatly across designers, the longest task being at least twice as long as the shortest one. Linkographs were generated for all nine design sessions.
Because they were interested in design productivity, Gürsoy and Özkar calculated link indices. They found considerable differences among representational modes and amid designers, and no coherent pattern. Next they derived from the linkographs lateral and vertical transformations, a distinction based on work by Goel (1995). Gürsoy and Özkar assumed that there was a correlation between the number of lateral transformations and the level of ambiguity of the design representation mode. That is, higher lateral transformation values should be obtained for the physical models and freehand sketching than for the digital model.
The criterion for a distinction between the modes of transformation was based on the distribution of links: “dense clusters of links correspond to vertical transformations while scattered links denote lateral transformations” (Gürsoy and Özkar 2010, 7). Dense clusters of links were demarcated in the linkographs as triangles, each of which was considered to represent one lateral transformation. Unlinked moves (“orphan” in our terminology) were added to this count, as they too were considered to be lateral transformations. The total sum of triangles and unlinked moves was the number of lateral transformations. According to Gürsoy and Özkar, vertical transformations were harder to determine. They adopted the idea of a Vertical Transformation Value (that is, the depth of the process defined as the mean distance of links from the x axis) from Kan and Gero 2008.
The assumption that ambiguous representation modes would yield a larger number of lateral transformations was not supported by the results, as each of the designers achieved the highest number of lateral transformations in a different modality. There were no specific assumptions concerning the vertical transformations, but they allowed Gürsoy and Özkar to determine how well developed each design solution was in each representational mode. In two cases the highest values were achieved in the sketching mode; in the third case they were achieved in the physical model mode.
The inconclusiveness of the results from this study may be attributable to several methodological difficulties. First, the small number of participants may have been restrictive, as the authors acknowledged. Second, the grain of the analysis was quite coarse, the number of moves was restricted, and the variation in their length may have been too large. Third, at least one participant was not fluent using the software that was provided for digital modeling, which must have affected that participant’s performance. In addition, the use of matchboxes for the physical model mode is questionable; restriction to a fixed single component is very strict; in “regular” physical modeling, any number of components may be used. It is reasonable to assume that if the experiment were repeated with these methodological difficulties addressed, the use of linkography might reveal differences among the modes of representation.
Effectiveness of Modes of Representation
Rosario Vidal, Elena Mulet, and Eliseo Gómez-Senent (2004) conducted a relatively large-scale study that had goals quite similar to those of the aforementioned study by Gürsoy and Özkar. Vidal and her associates were interested in the effect of what they called “means of expression” on the effectiveness of ideas generated in design brainstorming. Three variants of brainstorming were defined: sentential brainstorming (verbal, although later writing was included); visual brainstorming (sketching), and objectual brainstorming (in which participants prototyped their ideas using Meccano components). Twelve groups, each made up of five first-year industrial design students, were asked to design, at a conceptual level, an inexpensive tiltable drafting table that would take up minimal space when not in use. The sessions, each lasting an hour, were recorded, and a list of ideas that were generated was prepared for each session. All measured variables were expressed as means across participating groups for each variant of brainstorming. Links among ideas were established and notated in Excel matrix linkographs, in accordance with van der Lugt’s (2001) precedent; a linkograph was constructed for each session. The unit of analysis was termed a “global idea,” meaning an idea of pronounced significance. (“Global ideas” were chosen instead of all ideas because of the large size of the data set.)
To measure effectiveness (which was contingent on how valid an idea was relative to the requirements), Vidal et al. used a coding scheme with three levels: valid, rejected, and not related. The significant values the researchers were interested in were the number and percentage of valid ideas. The link density (that is, the ratio between the number of links and the number of global ideas—equivalent to our link index) was calculated for each linkograph. The higher the link density, the more developed the idea was considered to be. The ratio between the total number of ideas and the number of global ideas was also calculated, to indicate how focused the process of idea generation was.
The findings of this study affirmed that in functional design, at least when it is performed by novice designers, there are differences in the effectiveness of the design process that are related to the mode of representation used in brainstorming, or in preliminary design sessions. The objectual mode emerged as the mode with the highest proportion of valid ideas, the highest link density, and the highest ratio of global ideas to all ideas. On the other hand, the sentential mode had a much higher score than the other modes in the number of global ideas generated. Vidal et al. concluded that the classic sentential variant should be used if the goal is a wide range of ideas, regardless of their applicability. If, however, more integrated and plausible ideas are sought, the objectual variant gives the best results. The sketching mode was somewhere between the two other variants on almost all counts.
Linkograph as Metaphor
Hyo-Jeong Kwon, Hwa-Sei Lee, Doo-Heon Song, and Chee-Yong Kim (2008) were interested in specifying an appropriate search and navigation system for social networks and similar Web 2.0 interfaces. They claimed that a visual search that uses memory and visualization tools is more satisfactory to users than a search based on text, thumbnail icons, and screen shots. Visual search of a website, they wrote, is “a searching method using visual navigation factors where search results are arranged in a visual connection, a visual relation and a visual shape” (ibid., 379). Their claim was that since this type of search takes into account emotional factors, a visual search is most effective and popular in social network service and similar sites. Kwon et al. claimed that this kind of visual search is “a good example of linkography design web navigation” (ibid., 379). In their view, the linkograph is an example of a visual representation of information structure that combines a visual model with “attention and elucidation” factors. Therefore, they advanced the concept of “linkography design” for web navigation, where “linkography” is used “as a metaphor of web structure analysis” (ibid., 378).