Figure A.1
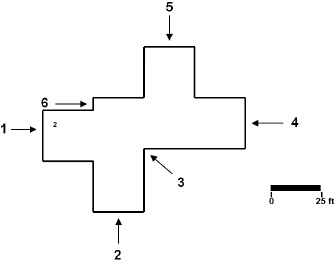
“Footprint” of library. Numbered arrows indicate optional entry points.
Appendix: Sources of Data
The linkographic studies in this book are based on data derived from several empirical studies. In each of these studies, protocols of design sessions (or their equivalent) were generated and linkographic analyses were conducted by the author or by other researchers. The number of studies based on protocols in which linkographs have been used is significantly larger than can be reported here (see chapter 7 for more on various uses of linkography); the eight studies featured here are the main sources for the empirical analyses in this book. They are listed in chronological order, highlighting those aspects that are relevant to linkography.
Ming-Hung Wang and N. John Habraken, 1982
Source: Wang and Habraken 1982
In the fall of 1982, John Habraken and his PhD student Ming-Hung Wang set out to study the basic operations that they believed are sufficient to carry out designing, based on decisions that are being taken during the design process. They suggested six such operations. In an empirical study, they asked a designer to arrange furniture in a living and dining space in a student’s apartment, and then listed the sequence of design decisions that had been made from the beginning to the end of the design session. A report was generated, consisting of a list of 35 decisions, achieved in 24 steps, each employing one operation. Next the operations that were carried out more or less at the same time were consolidated into a single step, resulting in a reduction of the number of steps to twelve. The decisions were subsequently coded using the six operations as the scheme of categories (the coding scheme, although it was the main goal of the study, is not relevant here). They also graphed the decisions across the given form variants, which were nine furniture “sites” (e.g., dining, working, TV, blind, long drape). The results proved that the six operations are necessary and sufficient to encompass all design decisions.
Branch library study, MIT, 1986–87
Source: eight protocols of design sessions
The Branch Library study was initiated in 1986 by Donald Schön and William Porter of the School of Architecture and Urban Planning at the Massachusetts Institute of Technology.1 Its primary purpose was to study how designers make sense of design problems, which Schön and Porter regarded as under-defined and under-structured in most cases. It was a grounded theory study: there were no predefined research questions and it was assumed that such questions would arise from analyses of the experimental data. In keeping with the study’s goals, Schön and Porter invented the “Branch Library Footprint” design task, which was intentionally poorly defined and poorly structured. The task called for commentary on six optional entry points into a branch library, indicated on a given outline plan referred to as “footprint” (figure A.1). Participants were asked to think aloud about the consequences of choosing a specific entry point while proposing preliminary design concepts for the library. Transcriptions of audio recordings and sketches produced during the sessions were used to prepare protocols.
Figure A.1
“Footprint” of library. Numbered arrows indicate optional entry points.
The assignment instructions were given to participants orally and were not formalized in writing; the following is a reconstruction:
An association that builds and operates branch libraries in suburban areas (in the USA) has a standard “footprint” for its libraries, which are single floor buildings. Because of changing site conditions the entry point may vary; there are six alternative points at which the entry could be positioned that are indicated in the given drawing [figure A.1]. Could you please help the Library Association by commenting on the design implications of the different optional entry points?
Eight designers volunteered to participate in the experiments. Each of them undertook the assignment alone, in the presence of an experimenter (three researchers served as experimenters). There was no time limit. The participants spent between 30 minutes and 70 minutes completing the assignment. Six of the participants were affiliated with MIT. Most of them were full-time or part-time design teachers with different amounts of design experience, one was a visitor, and one was a first-year graduate student with an undergraduate education in chemistry. The remaining two participants were highly experienced, well-known European architects. Two of the protocols were not analyzed and are therefore not featured here.
In a follow-up task, called “branch library II,” six designers were asked to design a library for a site in a clearing with several low walls. Only two of the protocols were analyzed and are featured here. The two participants were experienced architects who were pursuing PhD degrees at MIT.
Table A.1 summarizes the data about the participants in the two library design tasks.
Table A.1
Participants in the branch library experiment.
| Participant | Background | Moves in linkograph |
| Alice | First-year graduate student | 27 |
| Franz | Experienced architect; senior faculty | 22 |
| Glenda | Architect; visiting faculty | 50 |
| Ronna | Architect; graduate student and teaching assistant | 37 |
| Tim | Architect; graduate student and teaching assistant | 23 |
| Martin | Prominent European practicing architect | 45 |
| Gideona | Experienced practicing architect; part-time faculty and graduate student | 64 |
| Gilberta | Architect; graduate student | 63 |
a. Gideon and Gilbert undertook the task “branch library II.”
Delft protocol workshop, 1994
Sources: two protocols transcribed by Anita Clayburn Cross; Cross et al. 1996
The Delft protocol workshop was initiated by Nigel Cross, Kees Dost, and Henri Christiaans in the Faculty of Industrial Design Engineering at the Delft University of Technology. The idea was to have a group of experienced design researchers analyze a set of design protocols, and then to bring them together “to discuss the state of the art in protocol research” (Cross et al. 1996, 4). The task Cross, Dost, and Christiaans came up with called for the design of “a fastening device that should allow a given backpack to be fastened onto a mountain bike“ (ibid., 5). The experiment took place in 1994 at Xerox PARC (now called the Xerox Research Center) in Palo Alto. The eight participants (two of whom worked individually and six in two three-person teams) were all experienced industrial designers. The bicycle and the backpack were in the room in which they worked. The subjects were asked to think aloud, and the sessions were videotaped. They worked under the same conditions for two hours, after which they were debriefed for ten minutes.
One team’s protocol and one individual’s protocol were selected (on the bases of clarity and completion of data) for analysis. These protocols, sketches produced during the sessions, and the video tapes of the sessions were sent to 19 invited design researchers (and research groups) with experience in protocol analysis. Later in 1994 they presented their work at what came to be called the Delft protocol workshop. Papers from the workshop were published in a book (Cross et al. 1996) and in a special issue of the journal Design Studies (volume 16, issue 2, 1995). Today researchers continue to use the “Delft protocols” in various studies.
Table A.2
Data on Delft protocols.
| Designers | No. Participants | Analyzed portion | Moves in linkographs |
| Individual | 1 (Dan) | 32 minutes(6 units) | 191 |
| Team | 3 (John, Ivan, Kerry) | 46 minutes(14 units) | 624 |
Table A.2 summarizes the data about the Delft protocol workshop used in this book.
Remko van der Lugt, 2001
Source: van der Lugt 2001
In his PhD research in industrial design engineering at the Delft University of Technology, Remko van der Lugt studied various methods of conducting idea-generation meetings at the outset of product-development tasks. The methods studied were all variants of brainstorming. In some sessions, the participants sketched; in others, only the facilitator sketched; in yet others, there was no sketching at all. Groups of advanced design students then were given two series of industrial design tasks that were facilitated according to the brainstorming variants. From the protocol of each session, van der Lugt extracted a list of ideas, which he then used as the units of analysis for an Excel-based linkograph. The linkographs allowed him to compare the groups regarding the number of links, the level at which team members built on each other’s ideas, and more.
The linkograph from van der Lugt’s study that is used in this book (see figure 4.9) pertains to a session in which a team of five designers generated 72 ideas in about 90 minutes. The task was to propose an accessory kit for a family car that would keep children in the back seat busy during a ride.
Dan Tatsa, 2004
Sources: Tatsa 2005; Goldschmidt and Tatsa 2005
Dan Tatsa’s study, done in the course of his graduate work, is a “real world” study rather than a laboratory study. Tatsa was interested in the dynamics of idea generation in an undergraduate studio class in architecture. Assuming that such a setting is highly conducive to idea generation, he attended all sessions of a second-year undergraduate studio class for a semester and documented in detail the development of projects by eight students, listing the ideas raised by each student, by the teacher, and by fellow students. The assignment was to design a museum on the seashore of Tel Aviv.
At the end of the semester, Tatsa presented each student with a list of all ideas related to his or her project that had been communicated in the studio and asked the student to assess the impact of those ideas on the final design. There were five levels of impact, from “major contribution” to “negative impact.” The two highest assessments were “contribution” (later changed to “critical”) and “major contribution (later changed to “very critical”). Table A.3 presents the data.
Later Tatsa engaged in two rounds of linkograph generation. First he drew an Excel-based linkograph for each student. Since the lists of ideas were lengthy, this was a formidable task, and the results were used only for a general characterization of each student’s process. In the second round, he constructed linkographs only for the “critical” and “very critical” ideas in each student’s project. The latter process was repeated for two projects after links had been determined by two additional judges. Values extracted from these linkographs were correlated with the students’ semester grades.
Table A.3
Participants in Tatsa’s experiment.
| Participant | All ideas | Self-assessed critical ideas | Self-assessed very critical ideas |
| Yoav | 233 | 135 | NAa |
| Noa | 275 | 143 | NA |
| Ronen | 177 | 39 | 10 |
| Sam | 272 | 158 | NA |
| Meirav | 158 | 95 | 23 |
| Liron | 246 | 66 | NA |
| Shirly | 139 | 67 | NA |
| Amit | 92 | 25 | NA |
a. not applicable
Michal Daum-Cohen, 2005
Source: Daum-Cohen 2008
Michal Daum-Cohen was interested in the arguments designers use for decisions they contemplate and eventually make. In other words, she wanted to explore designers’ reasoning in the early conceptual design phase. In particular, she wanted to compare novice and experienced designers in order to explore the know-how of the latter, which the former appear to not yet possess. As part of her graduate work, she conducted an experiment with ten novice (first-year) and ten more experienced (fourth-year or fifth-year) undergraduate architecture students. Each student was individually presented with the same design task, which called for the redesign of a small vacation house.2 The student was given 25 minutes to perform the task and was asked to think aloud.
Daum-Cohen analyzed the first part of each protocol (about 8 minutes) which she parsed into design moves. The number of moves within this time frame varied significantly among participants. Later she generated Excel-based linkographs for each of these portions of the protocols. Figure A.2 shows the drawing that was given to each participant with this explanation of the task:
You have inherited a small lot with a small house on it. The house is old and in poor condition and you can pull it down and build a new vacation house for yourself instead. As was the case in the past, building laws enable single-floor construction on 2/3 of the lot’s area. When the house was built there was a requirement for a one-meter clearance between the property line and any construction. The law has since been eased and today building right to the property line is allowed. Openings are allowed anywhere in the house’s perimeter, provided the 3 meter high party walls between your lot and adjoining lots remain intact.
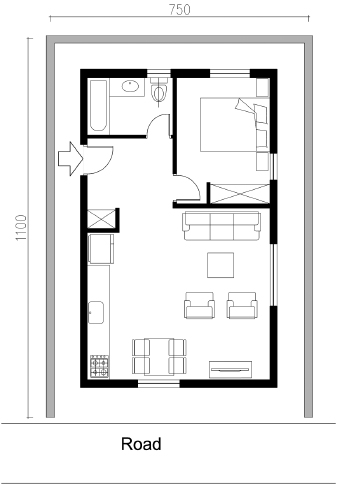
Figure A.2
Plan of small lot with old house used by Daum-Cohen.
Table A.4 presents the relevant data.
Daum-Cohen assumed that a higher positive correlation between values extracted from the linkographs and an independent evaluation of the quality of the design outcomes would be achieved by the advanced students. Her findings indicated that although this was the direction of the results, no statistically significant difference was found between advanced and novice students. Two possible explanations were offered. The first was that the difference in expertise between the two groups of students was not sufficiently pronounced: advanced students are still beginners and not experts. The second was that the initial part of the process (the eight minutes that were analyzed) may not be sufficiently indicative of the entire process.
André Neumann, 2006
Sources: protocol generated by Andre Neumann as part of his PhD work; Neumann 2012
Table A.4
Participants in Daum-Cohen’s experiment.
| Moves in linkograph | |
| First-year students | |
| Anat | 36 |
| Barak | 45 |
| Dana | 38 |
| Inbal | 47 |
| Nimrod | 59 |
| Orit | 33 |
| Roni | 25 |
| Sharon | 53 |
| Fifth-year students | |
| Hadar | 56 |
| Iris | 55 |
| Liat | 25 |
| Noaa | 50 |
| Ronit | 37 |
| Ruth | 70 |
| Shahar | 62 |
| Yaniv | 48 |
a. Not the individual of the same name who participated in Tatsa’s study.
In his PhD research at the Delft University of Technology, André Neumann investigated shared mental models in design teams: the extent to which they exist, the forms they take, and their effects. In a preliminary empirical study, he asked seven three-person teams of advanced industrial design students to come up with conceptual designs for a movable ashtray. The task was described as follows:
Since there is no suitable disposal system, cigarette stubs are an environmental problem in outdoor areas where many people gather for an event. You are asked to design a mobile ashtray (not fixed to the ground or attached to an object) that can be used in outdoors events such as a concert or a village fair.
After the task was introduced, each team member worked alone for 15 minutes and developed one or more ideas. In the next 50 minutes, members of the team worked together. In the next 10 minutes, they wrote down ideas individually. They then re-convened for 30 minutes and synthesized a joint solution. A short debriefing followed. The total working time, excluding the debriefing, was 120 minutes.
In this book, one vignette from one of Neumann’s protocols is used. Taken from the stage in which members of the team worked together before they had reached a final solution, it comprises 27 moves (this is referred to as the “short version”). An extended vignette from the same protocol, comprising 47 moves, was also linkographed (referred to as the “long version”) and is sometimes used—see table 4.1.
Hagay Hochman and Itay Dafni, 2006
Source: Goldschmidt et al. 2010
Hagay Hochman and Itay Dafni were interested in the dynamics of the design critique (“crit”), a conversation between a student and a teacher about the student’s project in progress. Hochman and Dafni documented three “crits” in three different second-year architecture studio classes and produced protocols. The protocols were parsed into verbalizations by turn taking of the conversants (student and teacher), regardless of their lengths (see table A.5). Linkographs were then prepared from the protocols.
Table A.5
Verbalizations across crits, Hochman and Dafni.
| Crit | Total no. of verbalizations | % verbalizations by student | % verbalizations by teacher |
| Mani and teacher | 65 | 41.5 | 58.5 |
| Alona and teacher | 63 | 58.7 | 41.3 |
| Yoava and teacher | 90 | 50 | 50 |
a. Not the individual of the same name who participated in Tatsa’s study.
Hochman and Dafni then produced a second set of linkographs, including only links between verbalizations by the student and the teacher and omitting links between verbalizations by the same party. They compared the resultant revised linkographs in terms of the communication dynamics. Next, they extracted critical verbalizations from each linkograph and calculated the percentage generated by each party. The results were compared with the participants’ self-assessments (collected separately by means of questionnaires) regarding the question “Who raises important issues in studio crits?”