14.1 Introduction
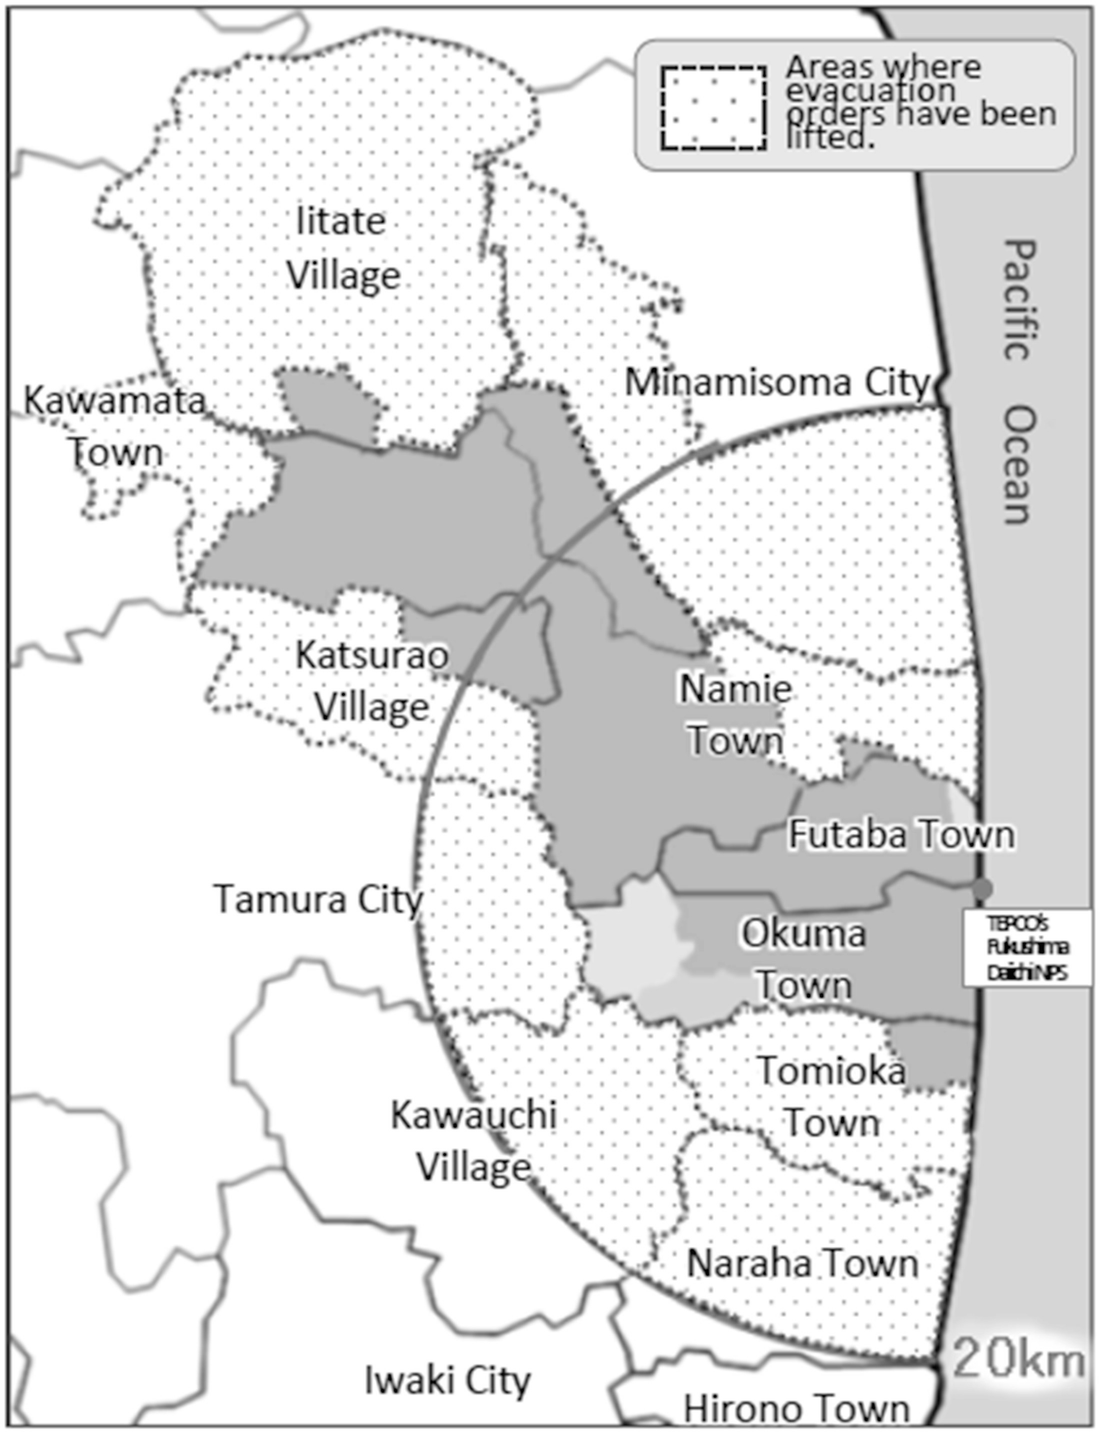
The location and status of Iitate Village. (Source: “Fukushima Revitalization Station” http://www.pref.fukushima.lg.jp/site/portal-english/)

Radiation dose rate in Iitate village from October to December 2016
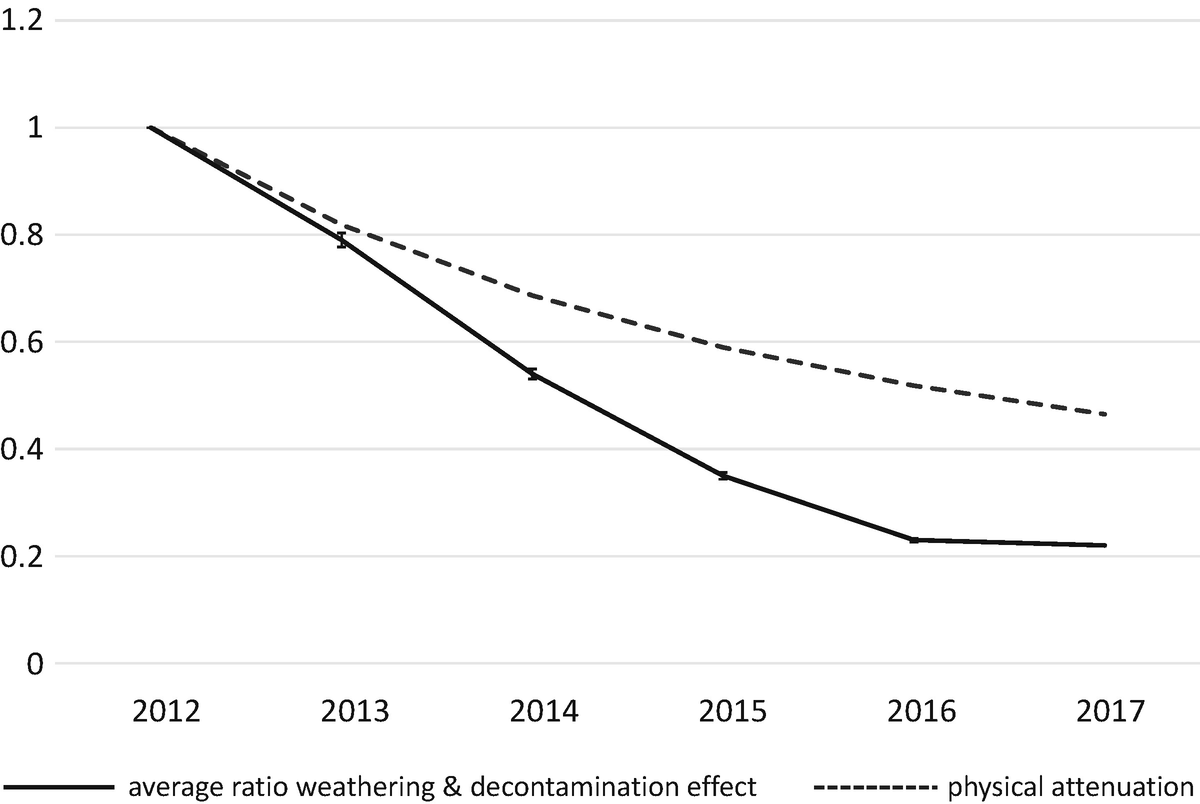
Relative air radiation dose rate from 2012 to 2017 in Iitake village
14.2 Methods
Parallel Measurement of Ambient and Individual External Radiation is based on a survey that we conducted March–June 2017. Two evacuees from Iitate Village and four members of our NPO took part. All participants worked in the area each day. Each participant carried an ambient radiation measuring device, two types of personal radiation measuring devices, and a GPS (Global Positioning System) receiver, allowing us to record their movement and to compare ambient and individual external doses. To ensure the accuracy of ambient dose, participants spent some time beside fixed radiation monitoring equipment that the central government, Fukushima Prefectural Office and Iitate Village authorities installed at various locations throughout the village to assure cross-calibration.

Participant A’s monitoring route on April 15th–16th, 2017 and participant B’s route on June 17th–18th, 2017
14.3 Results and Discussion
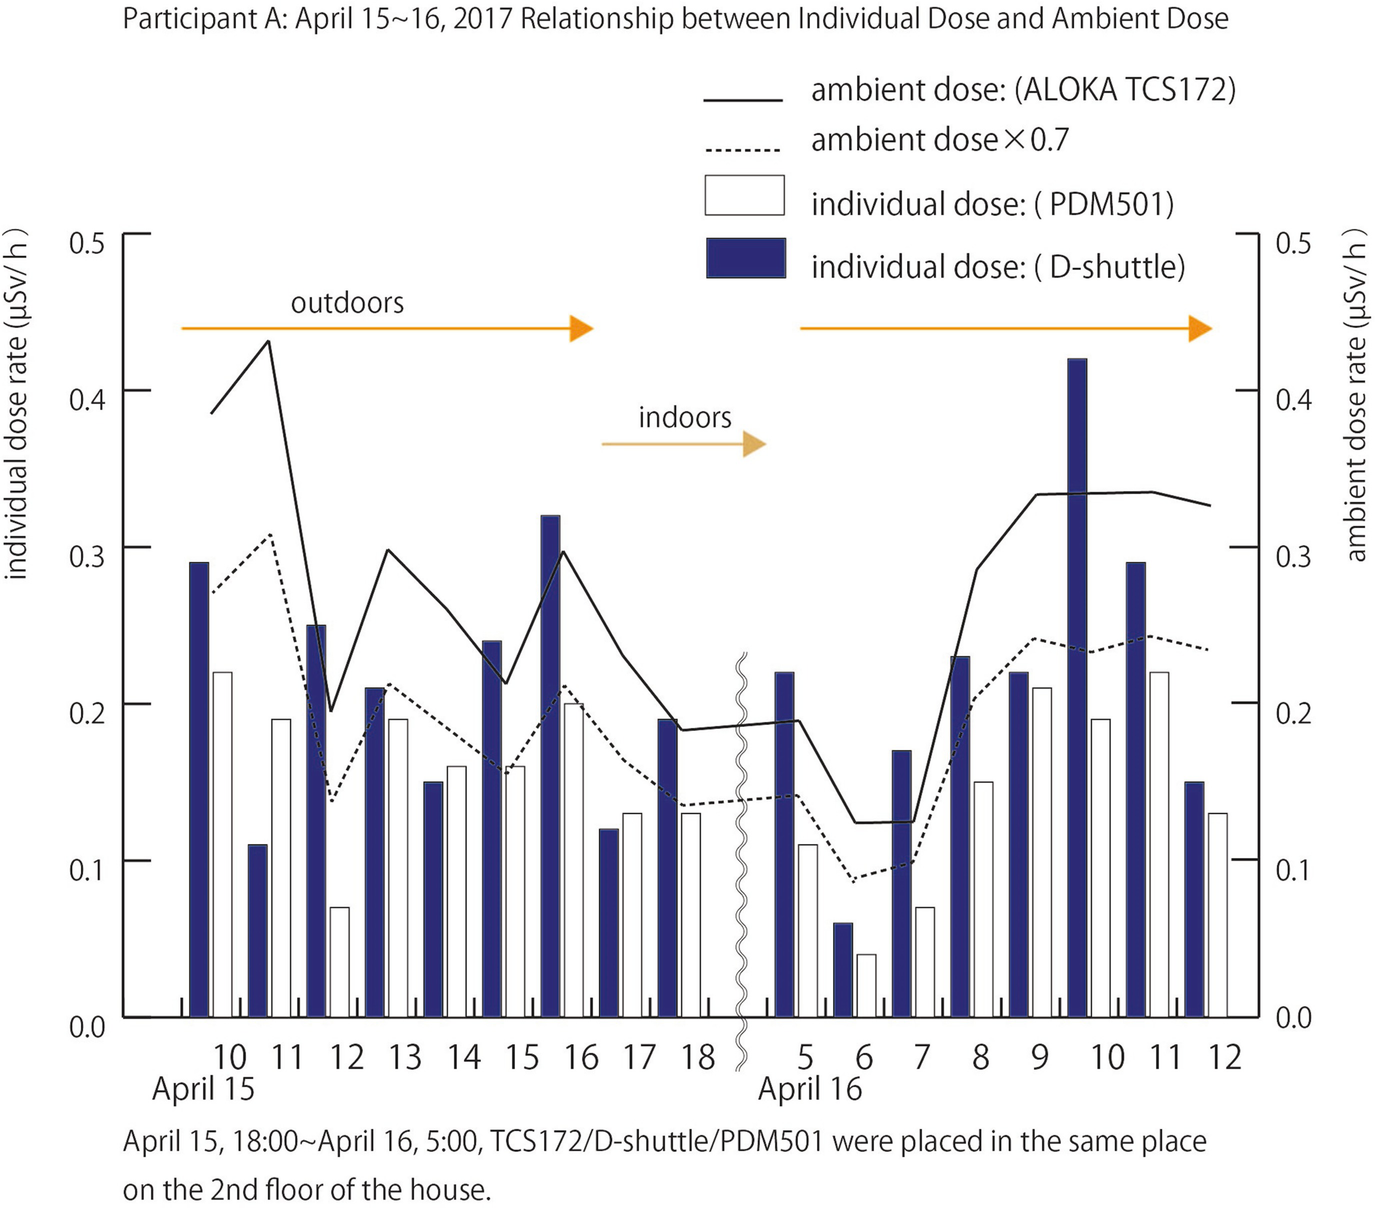
Relationship between individual (Participant A) dose and ambient dose. Monitoring occurred on April 15th–16th, 2017

Relationship between individual (Participant B) dose and Ambient Dose. Monitoring occurred on June 17th–18th, 2017
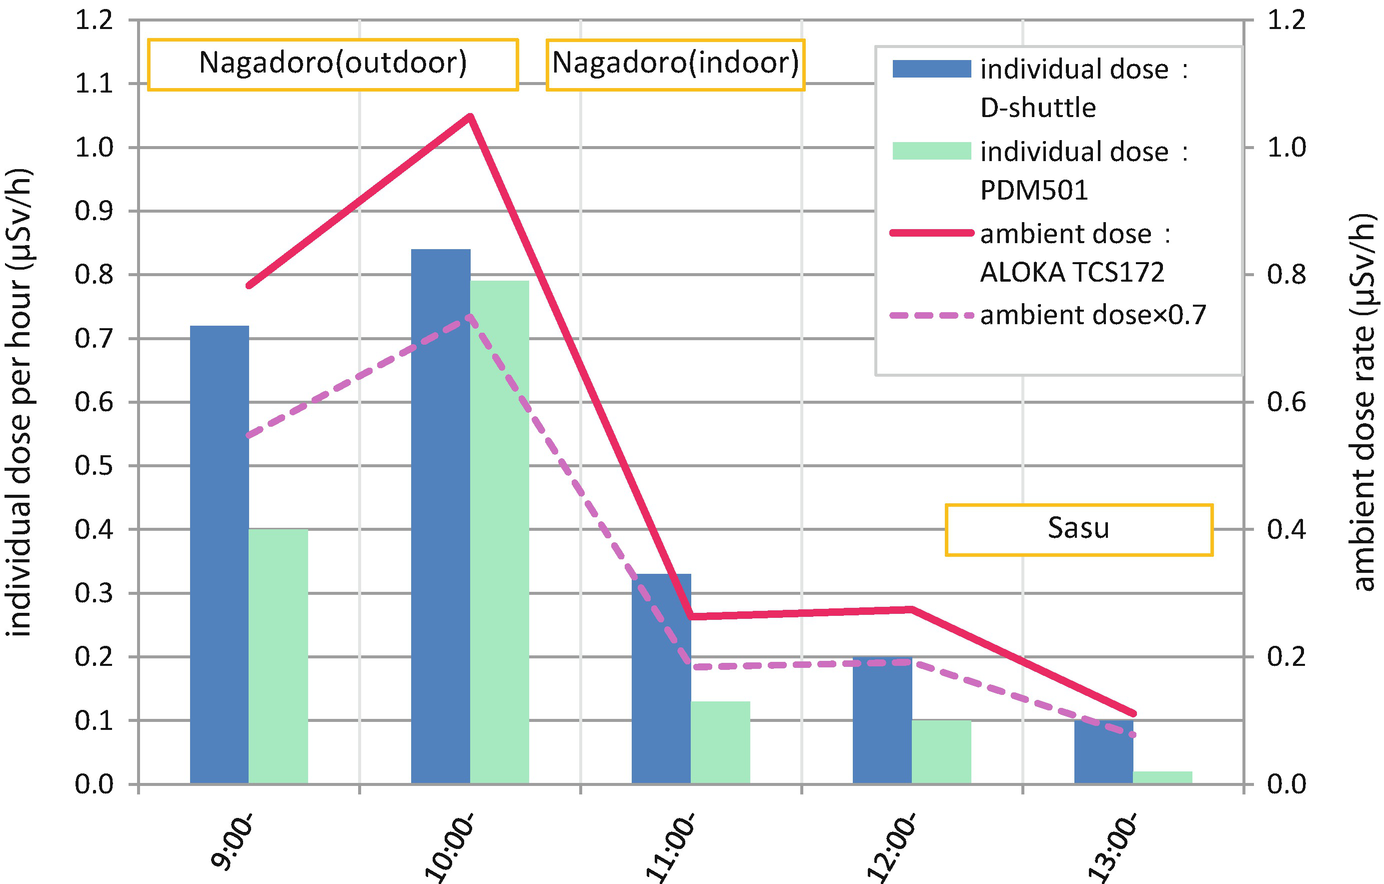
Relationship between individual (Participant A) dose and ambient dose. Monitoring occurred on September 3rd, 2017
Figure 14.5 depicts the results of measurements taken from 10:00 a.m. on April 15 to 12:00 p.m. on April 16, 2017. During this period, the individual started outdoor activities at 10:00 a.m. in Hiso, then went to Sasu around 12:00 p.m. and worked in the field there until 6:00 p.m. He left the measurement devices in the Sasu office until 5:00 a.m. the following morning; the next day, the 16th, he was in Ishida, Date City, working inside and out from 5 a.m. to 8 a.m. He then went back to Sasu and worked in the field there until 12:00 p.m. The solid line shows the ambient dose measured on the TCS-172. The dotted line in the figure shows 70% of the ambient dose. It approximately matches the gray bars, representing the measurement of the pocket dosimeter PDM-501. Measurements from the D-Shuttle dosimeter are shown as a dark blue bar in the chart. The D-Shuttle measurements tended to be somewhat higher than those of the PDM-501 and of the dispersion of the readings.
Figure 14.6 shows the results of measurements from 1:00 p.m. on June 17 to 3:00 p.m. on June 18th, 2017. This individual left Sasu by car around 1:00 p.m., drove to Hiso and Nagadoro in the southern part of Iitate Village, then went on to Itamisawa and Matsuzuka in the central part of the village. He spent approximately 30 min outside the car in each place. He stayed in a lodging house in Ishida, Date City (not far from Iitate Village) from 5:00 p.m. to 8:00 a.m. the following morning. He worked in the field in Sasu from 8:00 a.m. to 12:00 p.m., then had lunch in the Sasu office. After lunch, he went to Komiya and returned to Sasu. We found that, as on the previous day, the D-shuttle calibration was higher than that of the DPM501, which was approximately 70% of the ambient dose.
Figure 14.7 indicates the results of measurements taken from 9:00 a.m. to 1:00 p.m. on September 3rd, 2017. This individual started outdoor activities at 9:00 a.m. in Nagadoro and stayed in a community house around 11:00 p.m. to noon, then went to Sasu.
The results for those who took the same route for the same amount of time showed that regardless of where the person was, the individual dose was about 11%~30% lower than that of the ambient dose; the ratio of ambient to individual external dose was 100 to 70–89. The individual integral dose obviously depended on the lifestyle pattern and location of each individual.
Measurement data made available to the public by the central government and affiliated organizations are primarily the radiation ambient dose (per hour) obtained from airborne monitoring and from fixed monitoring posts. Airborne monitoring data is valuable to understand the average ambient dose within a radius of 300 m (Nuclear Regulation Authority 2017). This data was useful for policymaking as well as measuring radiation levels in highly contaminated areas right after the Fukushima Daiichi nuclear power plant accident (Yuuki et al. 2014).
We found a high correlation between the individual dose and ambient dose simultaneously measured in the same location. Needless to say, the ambient dose was very different at each point, whether in a house, forest, field or on the street, even in places located within a 300 m radius. When we study individual dose in a contaminated area, it is essential to be aware of the individual’s location, how long he or she stays there and the ambient dose of radiation at the site. A comparison between ambient dose and individual dose without consideration of those elements may cause misunderstanding.
Some studies have reported the relationship between ambient dose obtained from airborne monitoring and individual dose (Ishikawa et al. 2016; Naito et al. 2017; Miyazaki and Hayano 2017a, b). We doubt the relevancy of using airborne monitoring data in relation to individual dose, as was done, for example, for the Date City’s glass badge monitoring (Miyazaki and Hayano 2017a, b). This combination cannot be scientifically analyzed with reliable results. Researchers must consider two points when measuring individual external dose: (1) to record the exposure to each individual by location/length of time and (2) to consider only individual data, not the mean. Recent studies ignoring these two points have caused misunderstanding of the current situation in Fukushima (Kornei 2017). Besides, we would like to point out that airborne monitoring data are usually higher than ambient dose monitoring on the ground such as fixed monitoring posts. The airborne monitoring data is an estimated value from 1 m above the ground. The difference between airborne monitoring and ground monitoring from 2013 to 2016 will be larger in Iitate Village by our estimate. Many Date city residents who received glass badges did not wear them outdoors and simply sent them back to the local government office every 3 months after receiving replacements (The minutes of the proceedings of Date council 2016; Date City council News 2017). In other words, it is not known how many of those glass badges were never worn outside during those 3 months. A comparison between individual dose and ambient dose in a rather wide area without accurate information on location and length of time as well as a system to maintain individual dose records is not useful for understanding the current situation in Fukushima. Even worse, it can mislead residents in Fukushima into thinking that the exposure dose is lower than it actually is. We must offer proper scientific facts to prevent misunderstanding.
14.4 Conclusion
When the evacuation order was lifted in April 2017, some evacuees from Iitate Village returned to work there. Some resumed farming, others reopened their businesses, even though there are still quite a few areas where relatively high radioactivity is observed. Not all returnees are staying overnight in Iitate. Individual dose is highly dependent on each person’s actual activities, and those activities vary. Although the radiation level in decontaminated areas has gone down in Iitate Village, the level in the forests and mountains is higher than in the residential areas because they have not been decontaminated. More thorough radiation measurement is needed for the safety of residents and for further analysis.
Acknowledgments
We would like to thank the High Energy Accelerator Research Organization (KEK) for providing the high spec measuring equipment and the calibration. We also are grateful to the Iitate Village Office and the evacuated residents for giving us the opportunity to jointly make monthly measurements for more than 5 years. Mr. Tadashi Ogawa, president of Knowledge Design, has visualized our monthly measurements on maps from the very first stage of our project. Professor Masaru Mizoguti, Graduate School of Agricultural and Life Science / the University of Tokyo, cooperated in taking measurements in fields and forests. Ms. Itsuko Yano supported in arranging and recording. The Mitsui & Co. Environment Fund has given activity grants. We greatly appreciate their contribution. We hope that more related organizations and individuals will become interested in and work on accurate data collection and accumulation.

Open Access This chapter is licensed under the terms of the Creative Commons Attribution 4.0 International License (http://creativecommons.org/licenses/by/4.0/), which permits use, sharing, adaptation, distribution and reproduction in any medium or format, as long as you give appropriate credit to the original author(s) and the source, provide a link to the Creative Commons license and indicate if changes were made.
The images or other third party material in this chapter are included in the chapter's Creative Commons license, unless indicated otherwise in a credit line to the material. If material is not included in the chapter's Creative Commons license and your intended use is not permitted by statutory regulation or exceeds the permitted use, you will need to obtain permission directly from the copyright holder.