
Appendices
Appendix 1
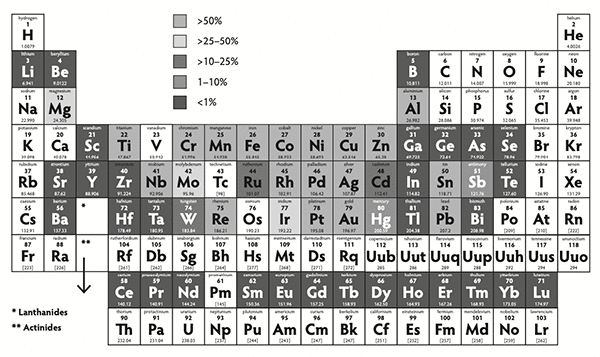
Periodic table of elements

Source: Rare Element Resources.
Appendix 2
Trends in world primary metal production
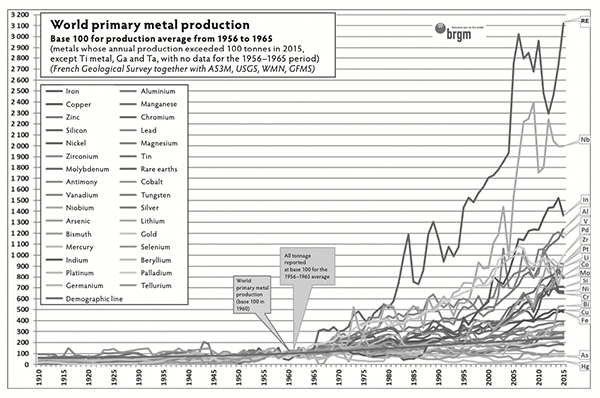
Appendix 3
Countries accounting for the largest share of global supply of critical raw materials

Source: ‘Study on the review of the list of Critical Raw Materials’, European Commission, June 2017, https://ec.europa.eu/growth/sectors/raw-materials/specific-interest/critical_en
Appendix 4
China’s relative share of global mining and metallurgy production

China’s relative share of global mining production (‘MI’) and metallurgy production (‘ME’) in 2011. The horizontal bar represents the share of the Chinese population in the global population.
Source: World Mining Data, 2013 edition (Ref. 63).
Appendix 5
Overview of the rare metals contained in an electric vehicle
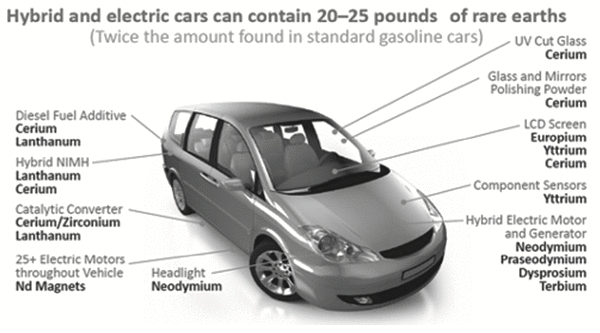
Source: ‘The Race for Rare Metals’, The Globe and Mail, 16 July 2011.
Appendix 6
Rare-metal composition of a smartphone

Source: ‘The chemical elements of a smartphone’, Compound Interest, 19 February 2014.
Appendix 7
Summary table of recycling rates of metals
Source: ‘Recycling Rates of Metals: A Status Report’, United Nations Environment Programme, 2011.
Appendix 8
France’s mining potential
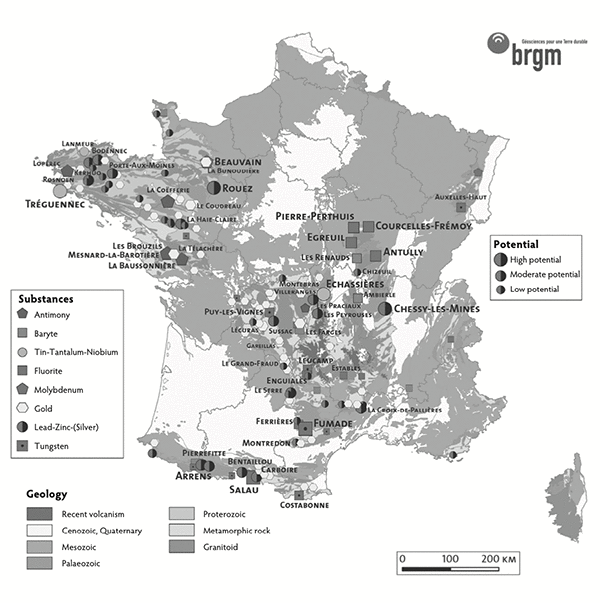
Appendix 9
China’s share of world consumption
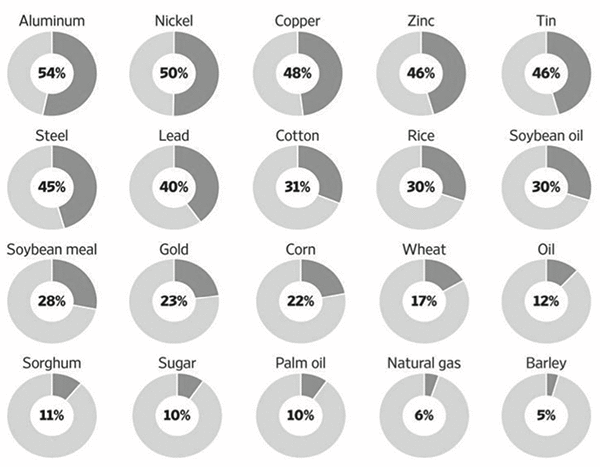
Source: World Bureau of Metal Statistics (H1 2015 for refined metals, slab zinc); World Gold Council (2014 for Gold); BP Statistical Review of World Energy 2015 (2014 for oil & natural gas); Metalytics via Morgan Stanley (2015 estimate for finished steel); US Department of Agriculture (2013–14 season for all others). Wall Street Journal.
Appendix 10
The life cycle of metals
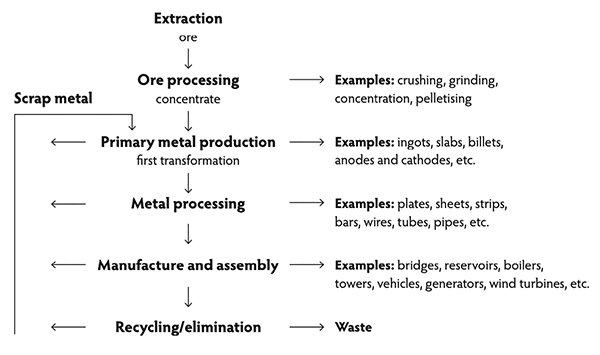
Source: Gouvernement du Québec, Ministère de l’Énergie et des Ressources naturelles, ‘Guide de redaction d’une étude d’opportunité économique et de marché pour la transformation au Québec’, The Ministry of Energy and Natural Resources of the Government of Quebec, October 2015, p. 1.
Appendix 11
Main industrial applications of rare minerals
|
Resource |
Applications |
|
Antimony |
Fire retardants (additive in plastics), polyethylene terephthalate catalyst |
|
Baryte |
Drilling mud for oil and gas drilling, glass industry, radioprotection, healthcare, metallurgy, pyrotechnics |
|
Beryllium |
Telecommunications and electronics, aerospace industry, civil and military nuclear power |
|
Bismuth |
Thermoelectric generators (automobiles), high-temperature superconductors, lead-free solder |
|
Borate |
Glass and ceramics |
|
Cobalt |
Mobile phones, computers, hybrid vehicles, magnets |
|
Coking coal |
Steel production |
|
Fluorspar |
Hydrofluoric acid, steel and aluminium production, ceramics, optics |
|
Gallium |
Semi-conductors, light-emitting diodes (LEDs) |
|
Germanium |
Photovoltaic cells, fibre optics, catalysis, infrared optics |
|
Indium |
Computer chips, LCD screens |
|
Magnesium |
Aluminium alloys |
|
Natural graphite |
Electric vehicles, aerospace, nuclear industry |
|
Niobium |
Satellites, electric vehicles, nuclear industry, jewellery |
|
Silicon metal |
Integrated circuits, photovoltaic cells, electric isolators |
|
Tantalum |
Miniaturised condenser, superalloys |
|
Tungsten |
Cutting tools, shielding, electricity, electronics |
|
Vanadium |
Specialty steels, aerospace industry, catalysis |
|
PGMs (platinum-group metals: ruthenium, rhodium, palladium, osmium, iridium, platinum) |
Catalysts, jewellery |
|
Rare earths (see table in the following appendix) |
Permanent magnets, electric vehicles, wind turbines, TGV (high-speed train), medical scanners, lasers, fibre-optics data transmission, phosphors for plasma screens, security inks for banknotes, catalysis |
Source: French Parliamentary Office for Science and Technology Assessment (OPECST), French Geological Survey (BRGM), Connaissance des énergies, Futura-Sciences, Niobec, Lenntech.
Appendix 12
Main industrial applications of rare earths
|
Resource |
Applications |
|
Lanthanum |
Superconductive compounds, lenses, lighting |
|
Cerium |
Catalytic converters, oil refinery, metal alloys |
|
Praseodymium |
Lighter flint, colourants, magnets |
|
Neodymium |
Permanent magnets, autocatalysts, oil refinery, lasers |
|
Promethium |
Luminescent compounds |
|
Samarium |
Magnets for missiles, permanent magnets, electric motors |
|
Europium |
Lasers, nuclear reactors, lighting, geo-chemistry, red phosphors in cathode-ray tubes |
|
Gadolinium |
Phosphorescent substance in cathode-ray tubes |
|
Terbium |
Green phosphor activator for cathode-ray tubes, permanent magnets |
|
Dysprosium |
Permanent magnets, hybrid engines |
|
Holmium |
Lasers, magnetism, superconductive compounds |
|
Erbium |
Long-distance fibre-optic communication, nuclear medicine |
|
Thulium |
Portable radiography, high-temperature superconductors |
|
Ytterbium |
Stainless steels, active ion (crystal lasers), portable radiography |
|
Lutetium |
Beta emitter (radiation) |
|
Scandium |
Lighting, marker, aluminium alloys |
|
Yttrium |
Red phosphors in cathode-ray tubes, superconductor alloys, fire bricks, fuel cells, magnets |
Source: French Senate, British Geological Survey, Economic Warfare School (EGE), Congressional Research Service, Portail de l’Intelligence Economique.
Appendix 13
The European Commission’s list of critical raw materials for the EU
|
Raw materials |
Main global producers |
Main importers to the EU (average 2010–2014) |
Sources of EU supply (average 2010–2014) |
Import reliance rate* |
Substitution indexes EI/SR** |
End-of-life recycling input rate*** |
|
Antimony |
China (87%) |
China (90%) |
China (90%) |
100% |
0.91 / 0.93 |
28% |
|
Baryte |
China (44%) |
China (53%) |
China (34%) |
80% |
0.93 / 0.94 |
1% |
|
Beryllium |
United States (90%) |
n/a |
n/a |
n/a**** |
0.99 / 0.99 |
0% |
|
Bismuth |
China (82%) |
China (84%) |
China (84%) |
100% |
0.96 / 0.94 |
1% |
|
Borate |
Turkey (38%) |
Turkey (98%) |
Turkey (98%) |
100% |
1.0 / 1.0 |
0% |
|
Cobalt |
Democratic Republic of Congo (64%) |
Russia (91%) |
Finland (66%) Russia (31%) |
32% |
1.0 / 1.0 |
0% |
|
Coking coal |
China (54%) |
United States (39%) |
United States (38%) |
63% |
0.92 / 0.92 |
0% |
|
Fluorspar |
China (64%) |
Mexico (38%) |
Mexico (27%) Spain (13%) China (12%) South Africa (11%) |
70% |
0.98 / 0.97 |
1% |
|
Gallium***** |
China (85%) |
China (53%) |
China (36%) |
34% |
0.95 / 0.96 |
0% |
|
Germanium |
China (67%) |
China (60%) |
China (43%) |
64% |
1.0 / 1.0 |
2% |
|
Hafnium |
France (43%) |
Canada (67%) |
France (71%) |
9% |
0.93 / 0.97 |
1% |
|
Helium |
United States (73%) |
United States (53%) |
United Russia (7%) Poland (3%) |
96% |
0.94 / 0.96 |
1% |
|
Indium |
China (57%) |
China (41%) |
China (28%) |
0% |
0.94 / 0.97 |
0% |
|
Magnesium |
China (87%) |
China (94%) |
China (94%) |
100% |
0.91 / 0.91 |
9% |
|
Natural graphite |
China (69%) |
China (63%) |
China (63%) |
99% |
0.95 / 0.97 |
3% |
|
Natural rubber |
Thailand (32%) |
Indonesia |
Indonesia (32%) |
100% |
0.92 / 0.92 |
1% |
|
Niobium |
Brazil (90%) |
Brazil (71%) |
Brazil (71%) |
100% |
0.91 / 0.94 |
0.3% |
|
Phosphate rock |
China (44%) |
Morocco (31%) |
Morocco (28%) |
88% |
1.0 / 1.0 |
17% |
|
Phosphorus |
China (58%) |
Kazakhstan (77%) |
Kazakhstan (77%) |
100% |
0.91 / 0.91 |
0% |
|
Scandium |
China (66%) |
Russia (67%) |
Russia (67%) |
100% |
0.91 / 0.95 |
0% |
|
Silicon metal |
China (61%) |
Norway (35%) |
Norway (23%) |
64% |
0.99 / 0.99 |
0% |
|
Tantalum****** |
Rwanda (31%) Democratic Republic of Congo (19%) Brazil (14%) |
Nigeria (81%) Rwanda (14%) China (5%) |
Nigeria (81%) Rwanda (14%) China (5%) |
100% |
0.94 / 0.95 |
1% |
|
Tungsten******* |
China (84%) Russia (4%) |
Russia (84%) Bolivia (5%) Vietnam (5%) |
Russia (50%) Portugal (17%) Spain (15%) Austria (8%) |
44% |
0.94 / 0.97 |
42% |
|
Vanadium |
China (53%) South Africa (25%) Russia (20%) |
Russia (71%) China (13%) South Africa (13%) |
Russia (60%) China (11%) South Africa (10%) Belgium (9%) United Kingdom (3%) Netherlands (2%) Germany (2%) Other EU (0.5%) |
84% |
0.91 / 0.94 |
44% |
|
Platinum Group Metals |
South Africa (83%) iridium, platinum, rhodium, ruthenium Russia (46%) palladium |
Switzerland (34%) South Africa (31%) United States (21%) Russia (8%) |
Switzerland (34%) South Africa (31%) United States (21%) Russia (8%) |
99.6% |
0.93 / 0.98 |
14% |
|
Heavy Rare Earth Elements |
China (95%) |
China (40%) USA (34%) Russia (25%) |
China (40%) USA (34%) Russia (25%) |
100% |
0.96 / 0.89 |
8% |
|
Light Rare Earth Elements |
China (95%) |
China (40%) USA (34%) Russia (25%) |
China (40%) USA (34%) Russia (25%) |
100% |
0.90 / 0.93 |
3% |
(*) The ‘Import reliance rate’ takes into account global supply and actual EU sourcing in the calculation of Supply Risk, and it is calculated as follows: EU net imports / (EU net imports + EU domestic production).
(**) The ‘Substitution index’ is a measure of the difficulty in substituting the material, scored and weighted across all applications, calculated separately for both Economic Importance and Supply Risk parameters. Values are between 0 and 1, with 1 being the least substitutable. The economic importance is corrected by the Substitution Index (SIEI) related to technical and cost performance of the substitutes for individual applications of each material. The supply risk is corrected by the Substitution Index (SISR) related to global production, criticality and co-/by-production of the substitutes for individual applications of each material.
(***) The ‘End-of-life recycling input rate’ measures the ratio of recycling from old scrap to EU demand of a given raw material, the latter equal to primary and secondary material supply inputs to the EU.
(****) The EU import reliance cannot be calculated for beryllium, as there is no production and trade for beryllium ores and concentrates in the EU.
(*****) Gallium is a by-product; the best available data refer to production capacity, not to production as such.
(******) Tantalum is covered by the Conflict Minerals Regulation (Regulation (EU) 2017/821) establishing a Union system for supply chain due diligence to curtail opportunities for armed groups and security forces to trade in tin, tantalum and tungsten, and their ores, and gold.
(*******) Tungsten is covered by the Conflict Minerals Regulation (Regulation (EU) 2017/821) establishing a Union system for supply chain due diligence to curtail opportunities for armed groups and security forces to trade in tin, tantalum and tungsten, and their ores, and gold.
SOURCE: COMPILED ON THE BASIS OF THE FINAL REPORT OF THE ‘STUDY ON THE REVIEW OF THE list of Critical Raw Materials’ 2017.
Appendix 14
Lifespan of the viable reserves of the principal metals needed for the energy transition
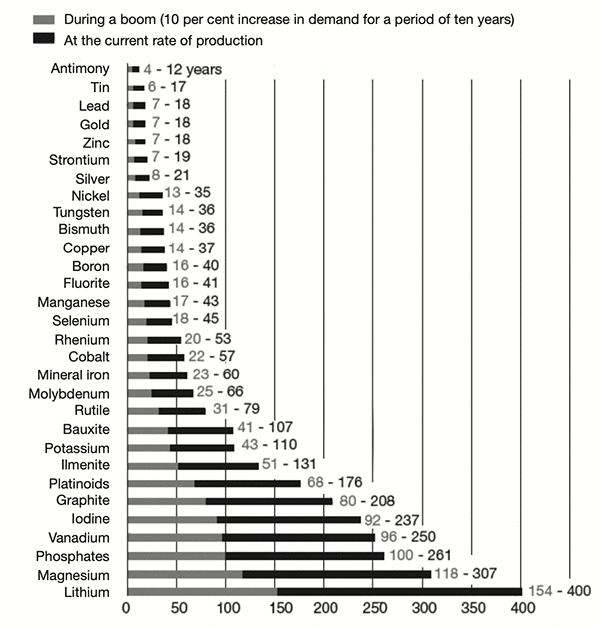
SOURCE: TABLE BY L. PENNEC FOR L’USINE NOUVELLE, 2017.