11
Cash Flow Shenanigan No. 2: Moving Operating Cash Outflows to Other Sections
Jimmy Hoffa, corrupt boss of the Teamsters Union, left a Detroit restaurant on July 30, 1975, and vanished without a trace. It is widely believed that he was “whacked” in a mob hit; yet despite having searched for the past 35 years, the FBI has been unable to locate his remains. Urban legends run rampant, providing many different accounts of his final resting place, including a New Jersey landfill, a Michigan sanitation plant, the Florida Everglades, and even (the old) Giants Stadium. Only one thing is for certain: whoever buried Jimmy Hoffa did not want him to be found.
Like Hoffa’s handlers, many companies have a secret dumping ground for pesky cash outflows that they don’t want anyone to find. It’s called the Investing section of the Statement of Cash Flows. Companies have found numerous clever ways to dump normal operating cash outflows into the Investing section, hoping that those outflows will vanish forever. And most investors, like the FBI in its hunt for Jimmy Hoffa, seem to have very few clues about where to look.
While unfortunately we can be of no help to the FBI in its search for Hoffa, we certainly can help investors find clues to the whereabouts of hidden cash outflows. This chapter will show you exactly where to look. We’ll show you how to find these outflows that management loves to bury in the Investing section, even though they seem more like operating-related outflows. And we’ll discuss the following four primary techniques that companies use to shift these operating cash outflows to the Investing section.
Techniques to Move Cash Outflows to Other Sections
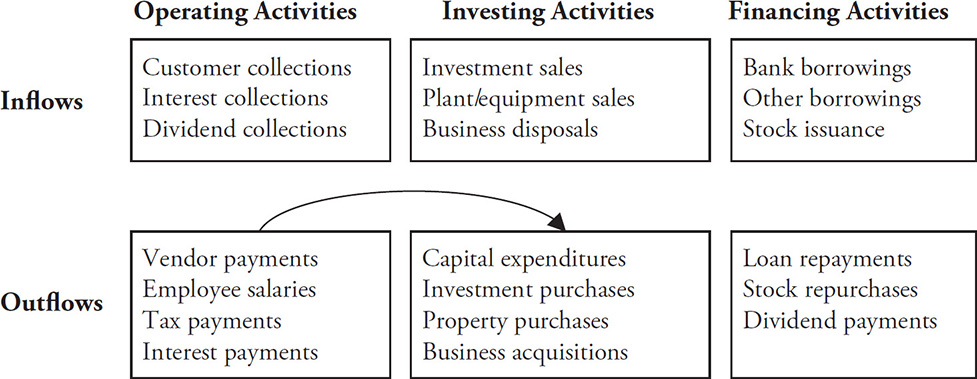
All four methods are examples of those used by companies that inflate cash flow from operations (CFFO) by dumping normal operating costs into the Investing section, as shown in Figure 11-1.
Figure 11-1
1. Inflating CFFO with Boomerang Transactions
Global Crossing was one of the highest-flying technology companies during the 1990s dot-com bubble. It was building an undersea fiber-optic cable network that would connect more than 200 cities across four continents, and investors appeared thrilled over its prospects. However, as the project neared completion in 2000 and early 2001, critics began to wonder whether Global Crossing would ever sell enough network capacity to recoup the extensive costs of the project and pay down its massive debt.
When questioned, Global Crossing always seemed to have a great rebuttal for these naysayers: “Look at all the cash we are generating.” Global Crossing signed many substantial contracts in which it sold future capacity for cash from customers paid up front—and it had the CFFO to prove it. In 2000, despite a negative $1.7 billion in earnings, the company reported to investors a positive $911 million in operating cash flow. (See Table 11-1.)
Table 11-1 Global Crossing’s Cash Flow from Operations Versus Net Income
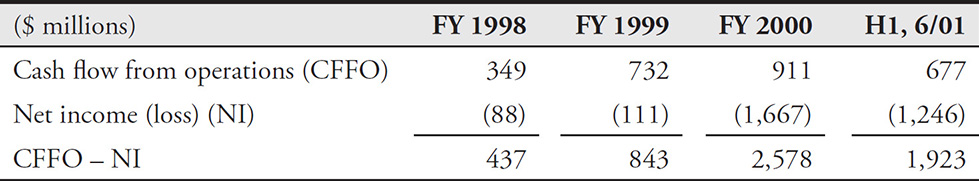
Normally, investors would be overjoyed about a company that generates substantially more CFFO than net income. Indeed, some of the differential was legitimately explained by these advances received from customers. However, a sizable portion related to a boomerang scheme to manipulate its CFFO.
As the technology industry was facing a slowdown, Global Crossing and other telecom players came up with a plan to effectively sell products to each other and, in so doing, boost revenue. From a purely economic standpoint, it was like taking money out of your right pocket and putting it into your left: nothing really changed.
Here’s how it worked: Global Crossing sold large blocks of future network capacity to telecom customers. At the same time, the company purchased a similar dollar amount of capacity from these same customers. In other words, Global Crossing would sell capacity to a customer and simultaneously buy a similar amount of capacity on a different network. This was a classic boomerang transaction. You can almost picture some Global Crossing executive telling the company’s customers, “You scratch my back, and I’ll scratch yours.”
So what does this have to do with cash flow? Well, Global Crossing recorded these boomerang transactions in a way that artificially inflated CFFO. The company recorded the cash that it received from its customers in these transactions as an Operating inflow; however, the cash that it paid to the same customers was recorded as an Investing outflow. Essentially, Global Crossing inflated cash flow from operating activities by depressing cash flow from investing activities. This allowed the company to show strong CFFO that clearly exceeded the economic reality of the transaction. It mattered little that the overstated CFFO was offset by understated cash from investing activities, because CFFO was the key cash flow metric on which investors were focused. Did we mention the word “chutzpah” before?
Be on the Lookout for Boomerang Transactions
These are very sneaky transactions that make you wonder about the economic substance of the arrangements. Diligent investors should be able to detect these transactions most of the time; look for disclosure of them in 10-Q and 10-K filings, but don’t expect that companies will use the term “boomerang.” Of course, companies will make investors work to find them, not present them on a silver platter. However, there are often plenty of details about these transactions, particularly when they are substantial in size. Consider Global Crossing’s disclosure of its boomerang transactions in its March 2001 10-Q filing.
This disclosure alone should have spooked investors. On page 11, Global Crossing discloses that $375 million of its $441 million in EBITDA came from sales to customers “to whom the Company made substantial capital commitments during the quarter.” Page 16 reminds readers that Global Crossing purchased capacity from customers and states that “new capital commitments total an estimated $625 million.”
Raise Your Antennae When You See a Boomerang Transaction
Once you identify a boomerang transaction, it is imperative that you dig around and understand the true economics of the arrangement. Look for further disclosure. Call the company and have management explain the arrangement to you. Assess the economics of the transaction and understand how it contributes to the company’s results. Consider whether the company has been deliberately avoiding or complicating the disclosure—it may not want you to understand how its boomerang transactions work. If you cannot get comfortable with a boomerang transaction, steer clear of the company.
Key Metric Shenanigans
You may be wondering about the odd metrics that Global Crossing highlighted in the excerpts shown: “cash revenue” and “recurring adjusted EBITDA.” The company used these metrics in its communications with investors and advertised them as being better performance measures than GAAP revenue and earnings. As you might imagine, these metrics were defined in such a way as to circumvent GAAP. The definitions allowed Global Crossing to take credit for cash received in these boomerang transactions that could not legitimately be recognized as revenue until far in the future. The whole concept of management’s deliberately sidestepping GAAP to mislead investors is quite alarming and very important to understand. We will pick up on this topic and discuss it much more thoroughly in Part Four, “Key Metric Shenanigans.”
2. Improperly Capitalizing Normal Operating Costs
Recording normal operating costs as an asset rather than as an expense sounds simple, and frankly, it is quite easy to do. However, it is one of the scariest and most lethal shenanigans out there. Why? Because it is a simple sleight of hand that does more than just embellish earnings—it inflates operating cash flow as well.
It certainly is no coincidence that WorldCom, the perpetrator of one of the largest and most shocking accounting frauds in history, was a purveyor of this brand of snake oil. By classifying billions of dollars of normal operating costs as capital equipment purchases, WorldCom not only artificially inflated its profits, but it also overstated its CFFO.
TIP
If you suspect a company of receiving an earnings benefit from improper capitalization, don’t forget that there may be a boost to operating cash flow as well.
Recording Normal Operating Costs as a Capital Asset Rather Than as an Expense
Recall our discussion of how WorldCom improperly inflated its earnings by recording its line costs (a clear operating expense) as an asset rather than as an expense? This simple tactic helped the company portray itself as a profitable company rather than tell investors that trouble was stirring.
This move also allowed WorldCom to present strong operating cash flow. Purchases of capital assets (“capital expenditures”) are classified on the Statement of Cash Flows as investing activities. By classifying line costs as a capital asset, WorldCom shifted a very large cash outflow from the Operating to the Investing section.
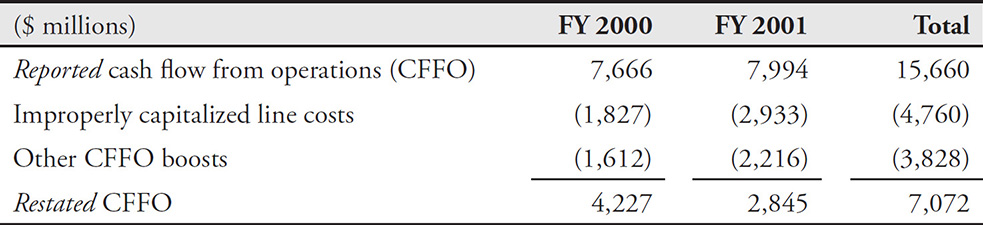
This line cost scheme artificially inflated WorldCom’s CFFO by nearly $5 billion in 2000 and 2001, according to the company’s restatement. Together with other improperly capitalized costs and CFFO boosts, WorldCom’s operating cash flow was overstated by a whopping $8.6 billion over these two years (as shown in Table 11-2, the difference between $15.7 billion reported and the $7.1 billion restated).
Table 11-2 WorldCom’s CFFO, Reported Versus Restated, 2000–2001
In Chapter 6 (EM Shenanigan No. 4), we discussed several ways to identify companies that are engaging in aggressive capitalization. Dishonest company executives may find ways to improperly capitalize any normal operating cost; however, the most common ones are generally those related to long-term arrangements, such as research and development, labor and overhead related to a long-term project, software development, and costs to win contracts or customers. Monitor these accounts for the best chance of spotting aggressive capitalization.
TIP
Rapidly increasing “soft” asset accounts (e.g., “prepaid expenses,” “other assets”) may be a sign of aggressive capitalization.
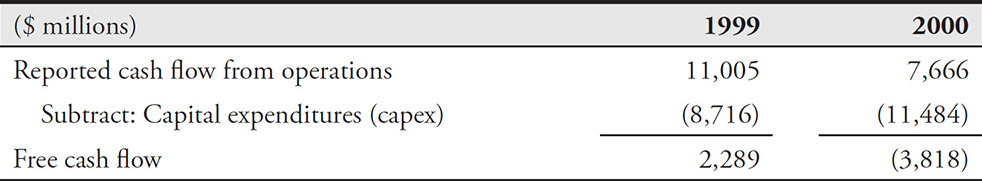
Pay Attention to Free Cash Flow as Well When a company improperly records costs as an asset instead of an expense, CFFO will be overstated. However, as we discussed in Chapter 1, free cash flow may not be affected because it is a measure of cash flow after capital expenditures. As shown in Table 11-3, calculating free cash flow at WorldCom reveals the extent of the company’s problems—a $6.1 billion deterioration from 1999 to 2000.
Table 11-3 WorldCom’s Free Cash Flow
Some very clever companies have figured out how to turn ordinary operating expenses from being a drain on free cash flow to ones that have virtually no cost, either in the present or in the future. In 2013 Salesforce.com, for example, began the unusual practice of accounting for a large multiyear software license as a “capital lease.” In all prior years, these types of licenses had been treated as operating expenses, both on the Statement of Operations and within the reported Operating section of the Statement of Cash Flows.
However, by classifying the license agreement as a lease, Salesforce.com moved most of payments to the software vendor from the Operating section of the Statement of Cash Flows to the Financing section under “Principal payments of capital lease obligations.” This line item, literally the second-to-last entry of the entire SCF, would be unlikely to draw any attention from analysts, who would have seen reported cash flow artificially inflated by tens of millions of dollars.
3. Recording the Purchase of Inventory as an Investing Outflow
Cost of goods sold (COGS) is a very apt name for the direct expenses that companies incur to acquire or produce inventory sold to customers. On the Statement of Operations, COGS are subtracted from revenue to yield a company’s gross profit, an important measure of the profitability of the company’s products.
The Statement of Cash Flows is sometimes not as straightforward. The economics of purchasing goods to be sold to customers suggests that these purchases should be classified as an operating activity on the Statement of Cash Flows. Normally, this would be the case. Curiously, some companies treat these purchases as an Investing outflow.
Purchase of DVDs: Operating or Investing?
In its early days (before streaming), Netflix Inc. was a mail-based movie-rental company. As you might imagine, one of the company’s largest expenditures was purchasing the DVDs that it rented out to customers. DVDs were essentially Netflix’s inventory, and therefore the company recorded its DVD library as an asset on its Balance Sheet. This asset was then amortized (over a period of one year for new releases and three years for back catalog), and as you would expect, the amortization cost was presented on the Income Statement as a cost of goods sold. In 2007, Netflix’s amortization of its DVD library amounted to $203 million on revenue of $1.2 billion.
While Netflix’s Income Statement appropriately reflected the economics of its DVD costs, its Statement of Cash Flows did not. You would think that the purchase of DVDs would have been presented on the SCF as an operating outflow just like the purchase of any inventory (particularly the purchase of the new releases that were amortized for only one year). However, Netflix did not see it that way. Instead, it considered the purchase of DVDs to be the purchase of a capital asset, and therefore the cash outflows were presented in the Investing section. This treatment effectively moved a big cash outflow (payment for DVDs) from the Operating to the Investing section, thereby inflating CFFO.
Interestingly, Netflix’s competitor at the time, Blockbuster Inc., a company that is not known for accounting conservatism, changed its accounting for DVD acquisitions at the end of 2005. Previously, Blockbuster had presented DVD purchases as an investing outflow, just like Netflix. However, after consultation with the regulators at the Securities and Exchange Commission, Blockbuster began classifying DVD purchases as an operating outflow and restated its historical numbers.
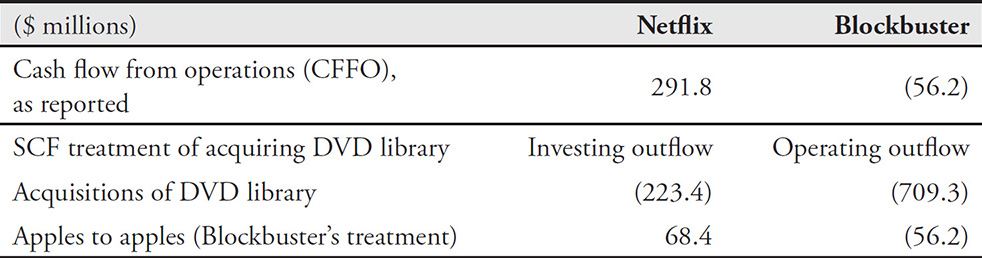
Consider Differences in Accounting Policies When Comparing Competitors Since Netflix put DVD purchases in the Investing section and Blockbuster put them in the Operating section, investors had little ability to compare the CFFO of the two companies without making an adjustment. As shown in Table 11-4, Netflix’s cash flow from operations was much stronger than that of Blockbuster in 2007; however, the difference was much less pronounced after adjusting for the DVD purchases.
Table 11-4 CFFO for Netflix and Blockbuster (FY 2007), as Reported and as Adjusted to Remove DVD Purchases from Netflix’s CFFO
Question Any Investing Outflow That Sounds like a Normal Cost of Operations While many analysts claim that reading the Statement of Cash Flows is an integral part of their analysis, many of them fail to read carefully below the Operating section. Simply scanning Netflix’s Investing section would have revealed that the company classified “Acquisitions of DVD library” as an investing activity. Even investors with only a basic knowledge of Netflix’s business would know enough to realize that acquisition of DVDs represents a normal cost of operations for Netflix.
Purchasing Patents and Newly Developed Technologies
Some professional sports franchises fill their team rosters with players whom they scouted, drafted, and developed within their own organizations. Others rely on the “free agent” market to sign proven players (albeit normally at a much higher price). In the same way, some companies rely on their own internal research and development projects to grow their businesses organically, while others choose to grow inorganically by acquiring development-stage technologies, patents, and licenses. While these different business strategies are means to the same end, the expenditures are often treated differently on the Statement of Cash Flows. Specifically, cash paid to employees and vendors for internal research and development would be reported as an operating outflow. However, some companies report cash paid to acquire already researched and developed products as an Investing outflow.
In certain industries, acquiring development-stage technologies is considered commonplace. For example, small biotechnology research companies often develop new drugs and then sell the rights to these drugs to larger pharmaceutical companies once FDA approval is near. The larger pharmaceutical companies then, as owner of the drug, reap all the profits. When analyzing the pharmaceutical company’s business, you certainly should consider the cash paid to acquire the drug rights. However, since the payment will be classified in the Investing section, many investors will have no idea it even exists.
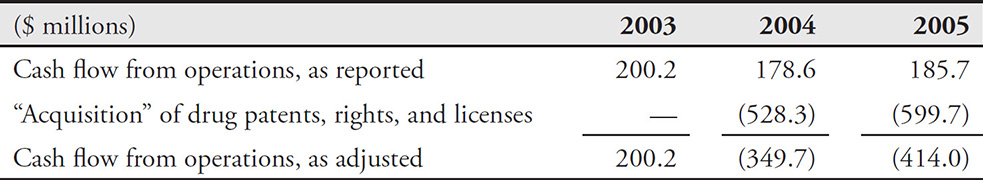
Consider the case of biopharmaceutical company Cephalon. Looking to continue its rapid pace of growth, Cephalon went on a $1 billion shopping spree in 2004 and 2005, snapping up patents, rights, and licenses related to several newly developed drugs. Cephalon presented these cash payments as “acquisitions” and dumped them into the Investing section of the Statement of Cash Flows. Had they been classified in the Operating section, CFFO instead would have been severely negative in both years. (See Table 11-5.)
Table 11-5 Cephalon’s Cash Flow from Operations (Adjusted to Subtract Drug Purchases)
Similarly, Nuance Communications, a speech recognition software company, acquired a substantial amount of a development-stage technology. In 2014, Nuance showed $253 million in “payments for business and technology acquisitions” as an Investing outflow on its Statement of Cash Flows. This was a very large outflow for the company, especially in relation to the $358 million in operating cash flow generated that year. However, despite spending this large amount, Nuance deemed each of its acquired entities to be immaterial and provided little detail about what it actually bought. Certainly, the cash spent on these assets should be considered when analyzing Nuance’s cash flow, as it likely relates to acquired technology and other development spending.
I’ll Gladly Pay You Tuesday for a Hamburger Today
In an interesting twist, Biovail Corporation, which merged with Valeant in 2010, gained ownership of certain drugs by purchasing the rights through noncash transactions. Instead of paying cash at the time of the sale, Biovail compensated the sellers by issuing a note—essentially, a long-term IOU under which the company would pay cash in the future. Since no cash changed hands at the time of the sale, there was no impact on the Statement of Cash Flows. And as Biovail paid down the notes over time, the cash payments were presented on the SCF as the repayment of debt—a financing outflow.
Biovail’s noncash purchases of product rights can be thought of in the same light as Cephalon’s patent purchases and Netflix’s DVD purchases. The economics suggests that these purchases relate to normal business operations, and yet they are reflected very differently on the Statement of Cash Flows. When analyzing Biovail’s ability to generate cash, these purchases should certainly not be ignored.
Look for “Supplemental Cash Flow Information” Companies frequently provide information about noncash activities in disclosures called “Supplemental Cash Flow Information.” This disclosure is sometimes found immediately after the Statement of Cash Flows; however, occasionally companies will bury this disclosure deep in the footnotes. For example, Biovail provided the disclosure about its noncash purchases in a supplemental cash flow footnote that came 30 pages after the Statement of Cash Flows.
4. Shifting Operating Cash Outflows off the Statement of Cash Flows
The final section of this chapter shows how creative management found ways to move the undesirable operating cash outflows far away from the Statement of Cash Flows.
Most companies with an employee pension plan fund those plans with cash that is invested to grow and meet the company’s projected long-term obligations. These contributions have the unfortunate effect of reducing reported cash flows. What if pensions could be funded without depleting precious cash flow?
In 2011 Diageo (maker of spirits including Johnnie Walker, Smirnoff, and Guinness) funded its U.K. pension scheme with GBP535 million of whiskey. As the whiskey ages, its value would increase, improving the funded status of the plan. All the while, reported cash flows remain unaffected. Similarly, in 2016 IBM contributed $295 million of U.S. Treasury securities to its defined benefit plan, saving that much in reported cash flow.
Looking Ahead
As this chapter showed, shifting operating cash outflows to the Investing section can be quite enticing for management that hopes to impress investors with stronger cash flow. Well, it seems that management cannot get enough of a good thing.