12
Nutritional Potential of Auricularia auricula‐judae and Termitomyces umkowaan – The Wild Edible Mushrooms of South‐Western India
Namera C. Karun, Kandikere R. Sridhar*, and Cheviri N. Ambarish
Department of Biosciences, Mangalore University, Mangalagangotri, Mangalore, Karnataka, India
*Corresponding author e‐mail: kandikere@gmail.com
Introduction
Protein‐energy malnutrition (PEM) is one of the major challenges in developing countries. It has been intensified due to increased population, insufficient food production, more dependence on starch‐ or monocarbohydrate‐based diets, transformation of agricultural lands into industrial yards and loss of phytodiversity (FAO/WHO 1991). Besides PEM, mineral deficiencies in food (e.g., Fe, K, Zn, Se, Ca, Mg, and Cu) also affect human nutrition (Frossard et al. 2000; Grusak and Cakmak 2005; Thacher et al. 2006; Welch and Graham 2005). There has therefore been an upsurge in focused research efforts exploring underutilized, indigenous, and non‐conventional food sources as alternatives to expensive animal protein sources. Fermented foods (cereals and legumes) with non‐toxic fungi (e.g., Rhizopus oligosporus) provide several nutrients and health benefits (e.g., proteins, essential amino acids, fiber, vitamin B, low fat, and zero cholesterol) (Ghorai et al. 2009; Niveditha and Sridhar 2015). Among the alternative food sources used to overcome PEM, indigenous legumes and macrofungi are at the forefront of research.
Macrofungi (e.g., mushrooms, puffballs, and morels) are attractive sources of nutrition and pharmaceuticals worldwide (Boa 2004; Halpern and Miller 2002). About 25 species of mushrooms are accepted as a food source and some are commercially cultivated to harness their benefits for human health (Lindequist et al. 2005), which include proteins, essential amino acids, fibers, minerals, fatty acids, vitamins, and flavors (Oboh and Shodehinde 2009; Sadler 2003). Although the Western Ghats is one of the hotspots of diversity of several wild macrofungi (Bhosle et al. 2010; Farook et al. 2013; Manoharachary et al. 2005; Mohanan 2011; Senthilarasu, 2014), very little is known about their nutritional attributes (Johnsy et al. 2011; Meghalatha et al. 2014; Sudheep and Sridhar 2014). This chapter focuses on the assessment of the nutritional qualities of two wild mushrooms, Auricularia auricula‐judae and Termitomyces umkowaan, collected from the Western Ghats and the west coast of southern India, respectively.
Wild Mushrooms
Auricularia auricula‐judae (Bull.) Quél. (Auriculariaceae‐Basidiomycotina) and Termitomyces umkowaan (Cooke and Massee) D.A. Reid (Lyophyllaceae‐Basidiomycotina) (Figure 12.1) were collected from Kadnur, in the Western Ghats (12°13'N, 75°46'E; 891 m asl) and from mixed forest at the Mangalore University Campus, Mangalore, west coast (12°48'N, 74°55'E; 112.4 m asl) during July−August 2012, respectively. A. auricula‐judae was plentiful on decomposing standing dead and fallen logs, bark, and twigs (e.g., Artocarpus heterophyllus), while T. umkowaan was common in and around the termite mounds in mixed forests. They were identified based on macro‐ and micromorphological features (Buczacki 2012; Jordan 2004; Mohanan 2011; Pegler and Vanhaecke 1994; Phillips 2006; Tibuhwa et al. 2010) and comparison with herbarium specimens at the Department of Botany, Goa University, Goa, India.
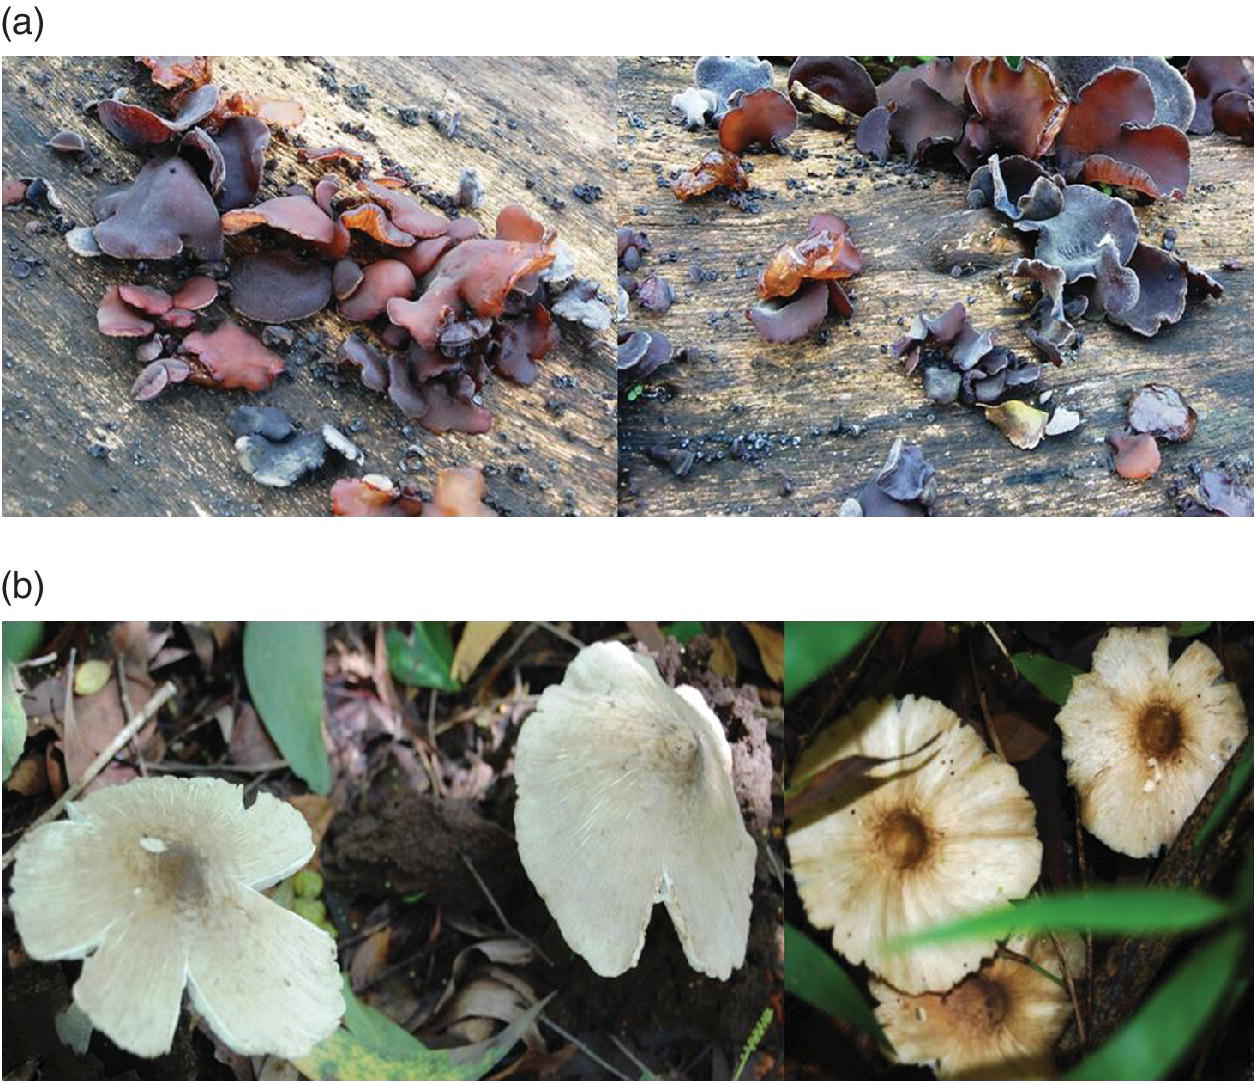
Figure 12.1 Auricularia auricula‐judae grown on decomposing logs in the Western Ghats (a) and Termitomyces umkowaan grown on termite mounds (b).
For assessment of proximal features, minerals, protein qualities and fatty acids, freshly collected mushroom samples (n=5) were blotted and grouped into two portions in each replicate. One portion of each replicate was oven dried (50–55 °C) and another portion was cooked using a household pressure‐cooker with limited water (6.5 L, Deluxe stainless steel, TTK Prestige™, Prestige Ltd, Hyderabad, India) and the oven‐dried on aluminum foil (50–55 °C). Dried mushroom samples were milled (Wiley Mill, mesh #30) and refrigerated (4 °C) in airtight containers.
Nutritional Assessment
Proximal Properties
Proximal qualities including crude protein, total lipids, crude fiber, ash, carbohydrates, and energy of the cooked and uncooked mushroom samples were determined employing standard methods. The micro‐Kjeldahl method was used to determine the crude protein (N × 6.25) of uncooked and cooked mushrooms (Humphries 1956). The Soxhlet method was employed for total lipid extraction of mushroom samples using petroleum ether (60−80 °C), while the quantities of crude fiber and ash were determined gravimetrically (AOAC 1990). Total carbohydrate (%) content was calculated according to Müller and Tobin (1980):

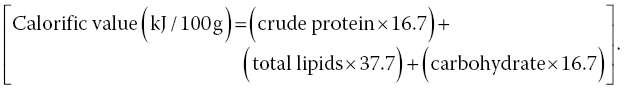
Calorific value (kJ/100 g) of mushroom samples was calculated based on Ekanayake et al. (1999):
Minerals
Mushroom flours were digested in a mixture of concentrated HNO3, H2SO4, and HClO4 (10:0.5:2 v/v) (AOAC 1990). Quantities of minerals (Na, K, Ca, Mg, Fe, Cu, Zn, Se) in digested samples were assessed by AAS (GBC Scientific Equipment Pty Ltd, Melbourne, Australia). To determine the total phosphorus in the samples, the vanadomolybdophosphoric acid method was employed by measuring the absorbance at 420 nm using KH2PO4 as standard (AOAC 1990). The ratios of Na/K and Ca/P were calculated.
Amino Acids
The method proposed by Hofmann et al. (1997, 2003) was followed to determine the amino acid content of the samples. A defined quantity of flour was hydrolyzed using HCl (6N, 15 ml) up to 4 hours (145 °C). Alkaline extracted and oxidized samples were used to determine tryptophan and sulfur amino acids, respectively. On cooling, HCl was removed by rotoevaporator (Büchi Laboratoriumstechnik AG RE121, Switzerland) using a diaphragm vacuum pump (MC2C, Vacuubrand GmbH, Germany). Internal standard trans‐4‐(aminomethyl)‐cyclohexanecarboxylic acid (Aldrich, purity 97%) was added to each sample. The derivatization step includes esterification by trifluoroacetylation (Brand et al. 1994). To eliminate traces of water, standards were weighed in reaction vials and dried in CH2Cl2 with a gentle stream of helium by slow heating in an oil bath (40−60 °C). Fresh acidified isopropanol (acetyl chloride 3 mL + 2‐propanol 12 mL) (12 mL) was added and heated (100 °C, 1 hour). Reagent was removed from cooled samples by a gentle helium stream (60 °C). Evaporation with three successive aliquots of CH2Cl2 followed to remove propanol and water. The dry residue was trifluoroacetylated overnight at laboratory temperature using trifluoroacetic anhydride (200 mL). An aliquot of this solution without treatment was fed to a gas chromatography combustion‐isotope ratio mass spectrometer (GC‐C‐IRMS/MS). Measurements of GC‐C‐IRMS/MS were undertaken using a gas chromatograph (Hewlett‐Packard 58590 II, Germany) connected via a split with a combustion interface to the IRMS system (GC‐C‐II to MAT 252, Finnigan MAT, Germany) to determine nitrogen and via a transfer line to a mass spectrometer (GCQ, Finnigan MAT Germany) for analysis of the amino acids. A capillary column of GC (50 m × 0.32 mm i.d. × 0.5 μm BPX5, SGE) was operating with carrier gas flow (1.5 mL/min): initial 50 °C (1 min), raised to 100 °C by 10 °C/min (10 min), raised to 175 °C by 3 °C/min (10 min) and to 250 °C/min (10 min) (head pressure, 13 psi, 90 kPa). The ratio of total essential amino acids (TEAA) to total amino acids (TAA) was calculated: [TEAA/TAA ratio = (Total EAA ÷ TAA)].
Protein Digestibility and Qualities
Estimation of in vitro protein digestibility (IVPD) was performed based on Akeson and Stahmann (1964). Defatted mushroom flours (100 mg) were treated at 37 °C for 3 hours with pepsin (Sigma, 3165 units/mg protein) (1.5 mg/2.5 mL 0.1N HCl) and immediately inactivated (0.25 mL 1N NaOH). Incubation was continued for 24 hours at 37 °C with trypsin (Sigma, 16 100 units/mg protein) and α‐chymotrypsin (Sigma, 76 units/mg protein) (2 mg each/2.5 mL potassium phosphate buffer, pH 8.0, 0.1M) and inactivated immediately (0.7 mL, 100% TCA). Zero‐time control was maintained by inactivation of enzyme prior to addition of mushroom flour.
Supernatant was collected after centrifugation of the inactivated mixture, and the remaining residue was washed (10% TCA, 2 mL) followed by centrifugation. The supernatant was pooled twice with diethyl ether (10 mL) and the ether layer was removed by aspiration. The aqueous layer was kept in a boiling water bath for 15 min to eliminate traces of ether. On attaining room temperature, the solution was made up to 25 mL in distilled water. Nitrogen content in 5 mL aliquots was determined using micro‐Kjeldahl apparatus (Humphries 1956) and protein in digest was estimated:

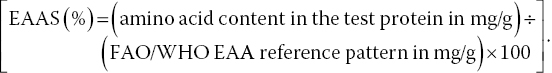
The essential amino acid score (EAAS) was determined according to FAO/WHO EAA requirements for adults (FAO/WHO 1991):
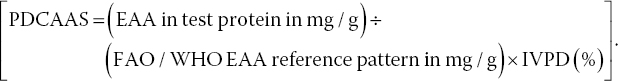
The protein digestibility corrected amino acid score (PDCAAS) for adults was calculated:
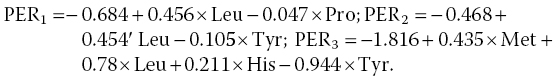
The protein efficiency ratio (PER) was calculated based on the amino acid composition of mushroom flours according to Alsmeyer et al. (1974):
Fatty Acids
Total lipids of mushroom flours extracted by the Soxhlet method were subjected to analysis of fatty acid methyl esters (FAMEs) based on the method outlined by Padua‐Resurreccion and Benzon (1979). In brief, HCl (5%, 0.2 mL) and acetyl chloride (8.3 mL) were added drop by drop to absolute methanol (100 mL) kept in an ice jacket. This mixture (0.2 mL) was added to extracted lipids of mushroom flour (200 mg) in screw‐cap glass vials (15 mL capacity), mixed, vortexed, and incubated at 70 °C for up to 10 hours followed by cooling to room temperature. Later, it was suspended in distilled water (500 μL), n‐hexane (HPLC grade, l00 μL) was added, vortexed and kept for separation. The top hexane layer was transferred into air‐tight microcentrifuge tubes and preserved in the refrigerator (4 °C) for FAME assay.
Esterified samples (100 μL) in vials were diluted with n‐hexane (HPLC grade, 900 μL). One μL aliquot was injected into the gas chromatograph (GC‐2010, Shimadzu, Japan) equipped with autoinjector (AOI) and capillary column (BPX‐70). The capillary column was conditioned for 10 hours before use. Elutants were detected by flame ionization detector (FID), amplified signals were transferred and followed by monitoring GC‐Solutions software (http://files.instrument.com.cn/FilesCenter/20110318/Gc_reference.pdf). Analytical conditions of the autosampler, injection port settings, column oven settings, and column information of the gas chromatograph were set up according to Nareshkumar (2007). The FAMEs quantification was based on the standard mixture (C4−C24) (Sigma, USA) run in similar conditions as the sample. The concentration and area of each peak of FAME were computed using GC Post‐run analysis software (www.umich.edu/~mssgroup/docs/GCinstructions.pdf). The ratio of polyunsaturated to saturated fatty acids was calculated.
Data Analysis
The difference in proximal characteristics, minerals, protein fractions, amino acids, in vitro protein digestibility, and fatty acids between uncooked and cooked mushroom flours was assessed by t‐test using Statistica version # 8.0 (StatSoft Inc. 2008).
Nutritional Comparison
Even though A. auricula‐judae and T. umkowaan are utilized as food sources, their nutritional features have not been systematically studied. A. auricula‐judae occurs in large quantities especially on standing wood or fallen logs on the forest floor. T. umkowaan erupts in large numbers in termite mounds. Mature A. auricula occurs under south‐west monsoon conditions and is available for up to 7−10 days for collection, while T. umkowaan shows up all of a sudden and remains up to 3−5 hours for sampling. However, both mushrooms serve as traditional food sources in the Western Ghats and west coast of India.
Proximate Qualities
Crude protein content in uncooked and cooked A. auricula‐judae was low (6.1−6.4%) and did not change significantly on cooking, matching the protein content of cereals (Table 12.1). Protein content reported by Crisan and Sands (1978) was low (4.2%), but was higher in A. auricula from the Western Ghats and Nagaland (36.3%) (Johnsy et al. 2011; Kumar et al. 2013). It is likely the protein content of Auricularia is dependent on the type of woody substrate on which it grows and this needs further insight. As for crude proteins, crude lipids were also low (1.6−1.7%) and not significantly altered on cooking, which agrees with a report from the Western Ghats (Johnsy et al. 2011) (1.6%). However, crude lipid content as high as 8.3% in A. auricula has been reported by Crisan and Sands (1978). Crude fiber significantly decreased on cooking (24% versus 18.5%), which corresponds with a report by Crisan and Sands (1978) (19.8%), but was lower in A. auricula from the Western Ghats (8.4%) and Nagaland (2.8%) (Johnsy et al. 2011; Kumar et al. 2013). Ash content ranged between 2.7% and 3.9% without significant change on cooking, however, its quantity was lower compared to A. auricula (4.7−7.1%) (Crisan and Sands 1978; Johnsy et al. 2011; Kumar et al. 2013), which was reflected in low mineral composition in A. auricula. Total carbohydrate content of A. auricula was significantly increased on cooking, which is higher compared to reports by Johnsy et al. (2011) and Kumar et al. (2013) (33.2%), but lower than the report by Crisan and Sands (1978) (82.8%).
Table 12.1 Proximate composition of uncooked and cooked mushrooms on dry weight basis (n = 5; mean±SD).
| Auricularia auricula‐judae | Termitomyces umkowaan | |||
| Uncooked | Cooked | Uncooked | Cooked | |
| Crude protein (g/100 g) | 6.44±0.16a | 6.06±0.32a | 21.49±1.16a | 18.89±0.14b* |
| Crude lipid (g/100 g) | 1.63±0.15a | 1.67±0.02a | 4.62±0.58a | 4.50±0.29a |
| Crude fiber (g/100 g) | 23.96±4.62a | 18.51±2.70b* | 28.76±2.08a | 15.73±0.41b** |
| Ash (g/100 g) | 3.85±0.10a | 2.66±0.84a | 7.28±0.83a | 2.58±0.01b** |
| Total carbohydrates (g/100 g) | 64.07±4.71a | 71.14±1.74b* | 50.89±1.04a | 45.26±1.67b* |
| Calorific value (kJ/100 g) | 1241±76.6a | 1351±28.19b* | 1383±17.50a | 1241±40.87b** |
Figures across the uncooked and cooked mushrooms with different letters are significantly different (t‐test: *p<0.05; **p<0.01).
In T. umkowaan, all proximal properties were significantly higher in uncooked than in cooked samples except for crude lipid which was not altered significantly (see Table 12.1). Protein content is comparable with several edible legumes (Cajanus, Cicer, Phaseolus, and Vigna) and T. mammiformis (Jambunathan and Singh 1980; Khan et al. 1979; Kumari 2012; Nwokolo 1987; Nwokolo and Oji 1985; Singdevsachan et al. 2014). It is higher than T. striatus (18.9−21.5% versus 13%) and comparable with T. eurrhizus and T. globulus (19.5−23.8%), but lower than many termitomycetes (T. badius, T. heimii, T. medius, T. microcarpus, T. radicatus, and T. robustus) (34.2−46.5%) (Aletor and Aladetimi 1995; Johnsy et al. 2011; Kumari 2012; Singdevsachan et al. 2014; Sudheep and Sridhar 2014). Crude lipid content in T. umkowaan is higher than other termitomycetes (T. badius, T. eurrhizus, T. globulus, T. heimii, T. medius, T. mammiformis, T. microcarpus, T. radicatus. T. robustus, T. shimperi, and T. tylerianus) (4.5−4.6% versus 0.1−4.3%) (Aletor and Aladetimi 1995; Johnsy et al. 2011; Kavishree et al. 2008; Kumari 2012; Singdevsachan et al. 2014; Sudheep and Sridhar 2014). The crude fiber in T. umkowaan is also substantially higher than other termitomycetes (15.7−28.8% versus 2.5−11.5%). Ash content in T. umkowaan was lower compared to other termitomycetes (2.6−7.3% versus 5−36%), which is reflected in the low minerals profile. Total carbohydrate content was higher than T. heimii, T. globulus, and T. microcapus (45.3−50.9% versus 39−46.5%), but lower than T. eurrhizus (63%) (Johnsy et al. 2011; Singdevsachan et al. 2014; Sudheep and Sridhar 2014).
The present study revealed that protein content is moderate in T. umkowaan, and crude lipid content in A. auricula is lower than T. umkowaan. However, uncooked and cooked samples of both mushrooms possess high quantities of crude fiber, which has several health benefits (Cheung 1997). A high proportion of insoluble fiber is expected in mushrooms due to chitin and other polysaccharides and this fiber is nutritionally beneficial (Kalač 2009). A high‐fiber diet helps to lower blood cholesterol and decreases the risk of large bowel cancer (Anderson et al. 1995; Slavin et al. 1997). The moderate quantity of carbohydrates in these mushrooms helps to control intestinal cancer and has a low glycemic index which is advantageous in type 2 diabetes (Venn and Mann 2004).
Minerals
Seven minerals (sodium, potassium, calcium, magnesium, phosphorus, iron, and copper) were significantly decreased on cooking A. auricula, with the exception of zinc (Table 12.2). Sodium, potassium, calcium, magnesium, iron, and zinc were lower compared to A. polytricha and only the copper content is comparable (Manjunathan et al. 2011). As seen in this study, the minerals profile was also low as in A. polytricha from Nigeria (Afiukwa et al. 2013).
Table 12.2 Mineral composition of uncooked and cooked mushrooms on dry weight basis (mg/100 g) (n = 5; mean±SD).
| Auricularia auricula‐judae | Termitomyces umkoowan | Recommended pattern¥ | |||
| Uncooked | Cooked | Uncooked | Cooked | ||
| Sodium | 39.10±1.1a | 31.80±0.3b** | 41.50±0.6a | 26.20±0.6b** | 120−200 |
| Potassium | 121.50±1.4a | 68.30±1.1b*** | 146.20±0.9a | 75.40±1.2b*** | 500−700 |
| Calcium | 29.80±1.3a | 18.60±0.8b** | 20.10±0.5a | 15.60±0.5b* | 600 |
| Magnesium | 29.20±1.2a | 24.10±1.1b*** | 28.50±0.7a | 25.10±0.8b*** | 60 |
| Phosphorus | 14.86±1.8a | 9.90±1.0b* | 96.00±3.0a | 63.73±3.4b*** | 500 |
| Iron | 7.80±0.6a | 6.50±0.3.0b** | 8.10±0.3a | 6.80±0.3b** | 10 |
| Copper | 0.31±0.02a | 0.11±0.01b*** | 0.23±0.02a | 0.15±0.02b** | 0.6−0.7 |
| Zinc | 3.40±0.1a | 3.10±0.1a | 2.80±0.2a | 2.20±0.2a | 5.0 |
| Na/K ratio | 0.32 | 0.47 | 0.28 | 0.35 | 0.24−0.29 |
| Ca/P ratio | 2.01 | 1.88 | 0.21 | 0.25 | 1.2 |
Figures across the cooked and fermented mushrooms with different letters are significantly different (t‐test: *p<0.01; **p<0.001; ***p<0.001).
¥ NRC‐NAS (1989) pattern.
Mineral levels in uncooked and cooked T. umkowaan were similar to A. auricula (see Table 12.2). Calcium, magnesium, iron, and copper were lower in T. umkowaan compared to other termitomycetes (T. badius, T. heimii, T. medius, T. mammiformis, T. microcarpus, T. radicatus, and T. striatus) with the exception of calcium in T. striatus (15 versus 15.6−20.1 mg/100 g) and magnesium in T. microcarpus (6 versus 25.1−28.5 mg/100 g) (Kumari 2012). However, phosphorus, iron, and zinc contents are higher and copper is comparable with uncooked and cooked T. globulus from the Western Ghats (Sudheep and Sridhar 2014).
Mushrooms are generally known for high levels of potassium (Dursun et al. 2006; Sudheep and Sridhar 2014). Although potassium was high in both mushrooms studied, it was not up to the expected level and most of the mineral was considerably drained on cooking. None of the minerals in these mushrooms are comparable with the NRC‐NAS (1989) recommended pattern. However, the Na/K ratio (0.28−0.47) in both mushrooms and Ca/P ratio (1.9−2) in A. auricula are favorable for human health. The Na/K ratio <1 helps to control high blood pressure, while the Ca/P ratio >1 helps to prevent loss of calcium in urine (Shills and Young 1988; Yusuf et al. 2007).
Amino Acids Profile and Protein Bioavailability
Alanine was highest in both mushrooms followed by glycine and glutamic acid. Cooking significantly decreased most of the amino acids, but tryptophan was below detectable levels (Table 12.3). Many non‐essential amino acids in uncooked and cooked mushrooms are higher or comparable with soybean and wheat. Among EAA, isoleucine, leucine, lysine, tyrosine, threonine, and valine in uncooked as well as cooked A. auricula were higher compared to soybean, wheat, and the FAO/WHO (1991) recommended standard; the same was true of histidine, lysine, tyrosine, threonine, and valine in uncooked and cooked samples of T. umkowaan. Similarly, leucine, lysine, tyrosine, tryptophan, and valine contents were higher than T. globulus, while phenylalanine is comparable with T. globulus (Sudeep and Sridhar 2014). Both mushrooms fulfill the requirement for several EAA, and the ratio of total EAA and total amino acids (TAA) increased on cooking in both mushrooms, indicating their nutritional potential. The EAA score of both mushrooms is higher than the FAO/WHO (1991) requirement with a few exceptions (A. auricula: histidine and methionine+cystine; T. umkowaan: leucine, methionine+cystine and phenylalanine+tyrosine) (Table 12.4).
Table 12.3 Amino acid composition of uncooked and cooked mushrooms in comparison with soybean, wheat, and FAO/WHO pattern (g/100 g protein; n = 5, mean±SD).
| Auricularia auricula‐judae | Termitomyces umkoowan | Soybean# | Wheat¥ | FAO/ WHO§ |
|||
| Uncooked | Cooked | Uncooked | Cooked | ||||
| Essential amino acids | |||||||
| His | 1.87±0.03a | 1.40±0.08b** | 3.21±0.09a | 2.95±0.04b** | 2.50 | 1.9−2.6 | 1.9 |
| Ile | 5.00±0.50a | 4.81±0.03a | 4.83±0.09a | 4.41±0.03b* | 4.62 | 3.4−4.1 | 2.8 |
| Leu | 8.58±0.09a | 8.07±0.07b*** | 6.43±0.03a | 6.36±0.03a | 7.72 | 6.5−7.2 | 6.6 |
| Lys | 12.4±0.40a | 7.19±0.01b** | 8.22±0.04a | 6.52±0.03b*** | 6.08 | 1.8−2.4 | 5.8 |
| Met | 0.76±0.02a | 0.59±0.01b** | 0.96±0.02a | 0.67±0.02b* | 1.22 | 0.9−1.5 | 2.5₤ |
| Cys | 0.21±0.01a | 0.13±0.01b* | 0.27±0.04a | 0.06±0.002b** | 1.70 | 1.6−2.6 | |
| Phe | 4.62±0.04a | 4.51±0.03a | 3.97±0.08a | 3.72±0.02b* | 4.84 | 4.5−4.9 | 6.3ξ |
| Tyr | 1.82±0.03a | 1.77±0.05b* | 2.18±0.02a | 2.01±0.01b*** | 1.24 | 1.8−3.2 | |
| Thr | 6.97±0.07a | 4.86±0.14b*** | 5.98±0.04a | 5.57±0.07b* | 3.76 | 2.2−3.0 | 3.4 |
| Trp | ND | ND | ND | ND | 3.39 | 0.7−1.0 | 1.1 |
| Val | 7.22±0.08a | 6.35±0.05b** | 6.06±0.07a | 5.63±0.03b** | 4.59 | 3.7−4.5 | 3.5 |
| Non‐essential amino acids | |||||||
| Ala | 11.2±0.16a | 10.65±0.03b* | 12.92±0.04a | 10.11±0.08b*** | 4.23 | 2.8−3.0 | |
| Arg | 3.99±0.02a | 2.57±0.03b*** | 3.56±0.08a | 2.85±0.03b** | 7.13 | 3.1−3.8 | |
| Asp | 6.97±0.04a | 3.91±0.03b*** | 7.87±0.04a | 7.10±0.20b** | 11.30 | 3.7−4.2 | |
| Glu | 7.36 ± 0.06a | 7.17±0.19a | 12.59±0.03a | 8.23± 0.24b*** | 16.90 | 35.5−36.9 | |
| Gly | 10.69±0.55a | 9.99±0.01a | 12.53±0.13a | 9.21±0.04b*** | 4.01 | 3.2−3.5 | |
| Pro | 9.25±0.07a | 7.01±0.02b*** | 5.63±0.03a | 4.15±0.06b*** | 4.86 | 11.4−11.7 | |
| Ser | 7.58±0.04a | 4.06±0.04b** | 8.37±0.02a | 7.18±0.28b** | 5.67 | 3.7−4.8 | |
| TEAA/TAA ratioΨ | 0.35 | 0.67 | 0.47 | 0.49 | 0.56 | 0.65−0.69 | |
Figures across the uncooked and cooked mushrooms with different letters are significantly different (t‐test: *p<0.05, **p<0.00, ***p<0.001).
# Bau et al. (1994); ¥, USDA (1999); §, FAO/WHO (1991) pattern; ₤, methionine+cystine; ξ, phenylalanine+tyrosine; Ψ, total essential amino acid/total amino acid; ND, not detectable.
Table 12.4 In vitro protein digestibility (IVPD), essential amino acid score (EAAS), protein digestibility corrected amino acid score (PDCAAS), and protein efficiency ratio (PER) of uncooked and cooked mushrooms.
| Auricularia auricula‐judae | Termitomyces umkoowan | |||
| Uncooked | Cooked | Uncooked | Cooked | |
| IVPD (%) | 39.10±1.1a | 31.80±0.3b* | 41.50±0.6a | 26.20±0.6b* |
| EAAS | ||||
| His | 0.98 | 0.73 | 1.68 | 1.55 |
| Ile | 1.78 | 1.71 | 1.73 | 1.58 |
| Leu | 1.30 | 1.22 | 0.97 | 0.96 |
| Lys | 2.13 | 1.23 | 1.41 | 1.12 |
| Met + Cys | 0.38 | 0.29 | 0.49 | 0.29 |
| Phe + Tyr | 1.02 | 0.99 | 0.97 | 0.90 |
| Thr | 2.05 | 1.42 | 1.75 | 1.63 |
| Val | 2.06 | 1.81 | 1.73 | 1.60 |
| PDCAAS | ||||
| His | 0.201 | 0.122 | 0.370 | 0.213 |
| Ile | 0.248 | 0.194 | 0.256 | 0.147 |
| Leu | 0.077 | 0.059 | 0.061 | 0.038 |
| Lys | 0.143 | 0.067 | 0.101 | 0.050 |
| Met + Cys | 0.059 | 0.036 | 0.081 | 0.030 |
| Phe + Tyr | 0.063 | 0.050 | 0.064 | 0.037 |
| Thr | 0.235 | 0.133 | 0.214 | 0.126 |
| Val | 0.230 | 0.164 | 0.205 | 0.120 |
| PER | ||||
| PER1 | 2.79 | 2.66 | 1.98 | 2.02 |
| PER2 | 3.23 | 3.00 | 2.22 | 2.20 |
| PER3 | 3.88 | 3.36 | 2.23 | 2.16 |
| Mean of PER1,2,3 | 3.30 | 3.01 | 2.14 | 2.13 |
Figures for the IVPD of uncooked and cooked mushrooms with different letters are significantly different (t‐test: *, p<0.01).
Besides the EAA and EAA score, the IVPD serves as an index of protein quality in foodstuffs. Cooking in a pressure cooker significantly decreased the IVPD in both mushrooms, suggesting that partial cooking or other methods of cooking may be recommended. The PDCAAS serves as an important parameter in the evaluation of protein quality of foodstuffs. The EAA and PDCAAS in both mushrooms were decreased on cooking in a pressure cooker, so this should be avoided to gain more benefit from these mushrooms. According to Friedman (1996), if the PER in a food is >2, it is of high quality; if between 1.5 and 2, it is of moderate quality; if <1.5, it is of poor quality. The PER1−3 in both mushrooms ranged between 1.98 and 3.88, indicating the benefits of these mushrooms in protein nourishment.
Fatty Acids
Uncooked and cooked A. auricula has the highest amount of stearic acid followed by oleic, palmitic, and linolelaidic acids (Table 12.5). Uncooked and cooked T. umkowaan showed highest quantity of linoleic acid followed by oleic, palmitic, and stearic acids. Oleic acid was the second most common fatty acid in both mushrooms, which was significantly increased in cooked T. umkowaan. The dominance of oleic and palmitic acids in both mushrooms is comparable with other wild mushrooms in India (Kavishree et al. 2008; Longvah and Deosthale 1998). Among the saturated fatty acids, palmitic and stearic acids were high in both mushrooms and they are important in mammalian nutrition, especially to prevent liver damage by alcohol (Cha and Sachan 1994; Hayes 2002). Both mushrooms contain many essential fatty acids. In cooked A. auricula, the presence of linolenic acid (ω3) indicating its improved quality. Although T. umkowaan is devoid of linolenic acid, in uncooked as well as cooked samples high quantities of linoleic acid (ω6) were present and significantly increased on cooking. In addition, it contains docosahexaenoic acid (ω3), which also significantly increased on cooking.
Table 12.5 Fatty acid methyl esters of uncooked and cooked mushrooms in comparison with soybean and wheat (mg/100 g lipid) (n = 5, mean±SD).
| Auricularia auricula‐judae | Termitomyces umkowaan | |||||
| Uncooked | Cooked | Uncoked | Cooked | Soybean# | Wheat¥ | |
| Saturated fatty acid | ||||||
| Lauric acid (C12:0) | − | − | − | − | Trace−45 | |
| Myristic acid (C14:0) | − | 2.99±0.002 | 1.03±0.006a | 0.68±0.002b*** | Trace−45 | |
| Pentadecanoic acid (C15:0) | 1.76±0.07a | 1.55±0.15a | 0.29±0.014a | − | ||
| Palmitic acid (C16:0) | 20.71±0.19a | 18.74±0.19b*** | 17.82±0.019a | 14.9±0.09b*** | 110−116 | 110−320 |
| Heptadecanoic acid (C17:0) | − | − | 0.56±0.019a | 0.35±0.004b*** | ||
| Stearic acid (C18:0) | 29.86±0.04a | 29.60±0.004b** | 6.79±0.006a | 7.18±0.004b*** | 25−41 | 0−46 |
| Arachidic acid (C20:0) | 1.85±0.045a | 1.76±0.01b* | 0.59±0.04a | 0.67±0.01a | Trace | |
| Heneicosanoic acid (C21:0) | 2.75±0.064a | 2.59±0.038a | 0.31±0.007a | 0.31±0.008a | ||
| Behenic acid (C22:0) | − | − | 0.85±0.004a | 0.89±0.014b* | ||
| Lignoceric acid (C24:0) | 3.73±0.007a | 3.69±0.005b*** | 0.82±0.009a | 0.89±0.018b** | ||
| Unsaturated fatty acids | ||||||
| Palmitoleic acid (C16:1) | − | − | 1.17±0.009 | − | Trace | |
| Cis‐10‐heptadecanoic acid (C17:1) | − | − | 0.33±0.04 | − | ||
| Oleic acid (C18:1) | 24.03±0.018a | 22.76±0.106b*** | 22.23±0.029a | 23.37±0.56b* | 211−220 | 110−290 |
| Linoleic acid (C18:2) | − | − | 46.23±0.036a | 50.35±0.052b*** | 524−540 | 440−740 |
| Linolelaidic acid (C18:2) | 14.13±0.011a | 13.16±0.008b*** | − | − | ||
| Linolenic acid (C18:3) | − | 0.95±0.007 | − | − | 71−75 | 7−44 |
| Eicosenoic acid (C20:1) | 1.18±0.011a | 1.07±0.033b** | − | − | ||
| Docosahexaenoic acid (C22:6) | − | − | 0.26±0.021a | 0.31±0.007b* | ||
| Total saturated fatty acids | 60.40±0.26a | 60.64±0.29b** | 29.06±0.11a | 25.87±0.12b*** | ||
| Total unsaturated fatty acids | 39.34±0.04a | 37.94±0.12b** | 70.22±0.13a | 74.04±0.61b*** | ||
| TUFA÷TSFA | 0.65 | 0.63 | 2.42 | 2.86 | ||
| TPUFA÷TMUFA | 0.56 | 0.59 | 1.96 | 2.17 | ||
| C14:0+C15:0 +(C16:0÷C18:0) | 2.46 | 5.17 | 3.94 | 2.75 | ||
| C18:1÷C18:2 | 1.70 | 1.73 | 0.48 | 0.46 | ||
Figures across the uncooked and cooked mushrooms with different letters are significantly different (t‐test: *p<0.05, **p<0.01, ***p<0.001).
# Wahnon et al. (1988), Cho (1989); ¥, Pomeranz (1998); −, not detectable.
None of the saturated and unsaturated fatty acids in both mushrooms were comparable with soybean and wheat. Total saturated fatty acids were higher than total unsaturated fatty acids in A. auricula, while the opposite was true in T. umkowaan, indicating its superiority. Foodstuffs with high levels of unsaturated fatty acids rather than high carbohydrate are preferable for combating the risks of coronary heart disease (Bentley 2007). Cooked T. umkowaan demonstrated a significant decrease in saturated fatty acids and increase in TUFA/TSFA ratio, indicating its nutritional value. Both mushrooms showed an increased ratio of TPUFA/TMUFA, which is one of the desired traits in foodstuffs. Besides, T. umkowaan also showed favorable nutritional quality by decreased ratios of C14:0+C15:0+(C16:0÷C18:0), C18:1÷C18:2 and ω6÷ω3 on cooking, which was not evident in A. auricula.
Conclusion
In contrast to the assessment of nutritional quality in cultivated mushrooms, its assessment in wild mushrooms is difficult. Studies have revealed the presence of considerable amounts of fiber, low lipid levels, moderate quantity of carbohydrates, and high levels of essential amino acids and unsaturated fatty acids in two wild mushrooms Auricularia auricula‐judae and Termitomyces umkowaan. In addition, T. umkowaan possesses levels of total proteins comparable to edible legumes. These features qualify both mushrooms as ideal food sources for human consumption. Future studies should use suitable technology to collect, process, and preserve these mushrooms without loss of nutritional attributes for human health benefits.
Acknowledgments
NCK acknowledges Mangalore University for partial financial support through fellowship under the Promotion of University Research and Scientific Excellence (PURSE), Department of Science Technology, New Delhi. KRS acknowledges the University Grants Commission, New Delhi, and Mangalore University for the award of UGC‐BSR Faculty Fellowship.
References
- Afiukwa, C.A., Oko, A.O., Afiukwa, J.N., Ugwu, O.P.C., Ali, F.U. and Ossai, E.C. (2013) Proximate and mineral element compositions of five edible wild grown mushroom species in Abakaliki, Southeast Nigeria. Res. J. Pharm. Biol. Chem. Sci., 4: 1056−1064.
- Akeson, W.R. and Stahmann, M.A. (1964) A pepsin pancreatin digest index of protein quality. J. Nutr., 83: 257–261.
- Aletor, V.A. and Aladetimi, O.O. (1995) Compositional studies on edible tropical species of mushrooms. Food Chem., 54: 265–268.
- Alsmeyer, R.H., Cunningham, A.E. and Happich, M.L. (1974) Equations predict PER from amino acid analysis. Food Technol., 28: 34–38.
- Anderson, J.W., Johnstone, B.M. and Cook‐Newell, M.E. (1995) Meta‐analysis of the effects of soy protein intake on serum lipids. N. Engl. J. Med., 333: 276–282.
- AOAC (1990) Official Methods of Analysis, 15th edn. Washington, DC: Association of Official Analytical Chemists.
- Bau, H.M., Vallaume, C.F., Evard, F., Quemener, B., Nicolas, J.P. and Mejean, L. (1994) Effect of solid state fermentation using Rhizophus oligosporus sp. T‐3 on elimination of antinutritional substances and modification of biochemical constituents of defatted rape seed meal. J. Sci. Food Agric., 65: 315−322.
- Bentley G. (2007) The health effects of dietary unsaturated fatty acids. Nutr. Bull., 32: 82−84.
- Bhosle, S., Ranadive, K., Bapat, G., Garad, S., Deshpande, G. and Vaidya, J. (2010) Taxonomy and diversity of Ganoderma from the western parts of Maharashtra (India). Mycosphere, 1: 249–262.
- Boa, E.R. (2004) Wild Edible Fungi: A Global Overview of their Use and Importance to People. Rome: Food and Agricultural Organization.
- Brand, W.A., Tegtmeyer, A.R. and Hilkert, A. (1994) Compound‐specific isotope analysis, extending towards 15N/14N and 13C/12C. Org. Geochem., 21: 585–594.
- Buczacki, S. (2012) Collins Fungi Guide. London: Harper‐Collins.
- Cha, Y.S. and Sachan, D.S. (1994) Opposite effects of dietary saturated and unsaturated fatty acids on ethanol pharmacokinetics, triglycerides and carnitines. J. Am. Coll. Nutr., 13: 338–343.
- Cheung, P.C.K. (1997) Dietary fibre content and composition of some edible fungi determined by two methods of analysis. J. Sci. Food Agric., 73: 255–260.
- Cho, B.H.S. (1989) Soybean Oil: Its Nutritional Value and Physical Role Related to Polyunsaturated Fatty Acid Metabolism. Creve Couer: American Soybean Association.
- Crisan, E.V. and Sands, A. (1978) Nutritional value. In: Chang, S.T. and Hayes, W.A. (eds) The Biology and Cultivation of Edible Mushrooms. New York: Academic Press, pp. 137–168.
- Dursun, N., Özcan, M.M., Kaşık, G. and Öztürk, C. (2006) Mineral contents of 34 species of edible mushrooms growing wild in Turkey. J. Sci. Food Agric., 86: 1087–1094.
- Ekanayake, S., Jansz, E.R. and Nair, B.M. (1999) Proximate composition, mineral and amino acid content of mature Canavalia gladiata seeds. Food Chem., 66: 115–119.
- FAO/WHO (1991) Protein Quality Evaluation. Report of a Joint FAO‐WHO Expert Consultation. Food and Nutrition Paper # 51. Rome: Food and Agriculture Organization of the United Nations.
- Farook, V.A., Khan, S.S. and Manimohan, P. (2013) A checklist of agarics (gilled mushrooms) of Kerala State, India. Mycosphere, 4: 97–131.
- Friedman, M. (1996) Nutritional value of proteins from different food sources – a review. J. Agric. Food Chem., 44: 6–29.
- Frossard, E., Bucher, M., Mächler, F., Mozafar, A. and Hurrell, R. (2000) Potential for increasing the content and bioavailability of Fe, Zn and Ca in plants for human nutrition. J. Sci. Food Agric., 80: 861–879.
- Ghorai, S., Banik, S.P., Verma, D., Chowdhury, S., Mukherjee, S. and Khowala, S. (2009) Fungal biotechnology in food and feed processing. Food Res. Int., 42: 577−587.
- Grusak, M.A. and Cakmak, I. (2005) Methods to improve the crop‐delivery of minerals to humans and livestock. In: Broadley M.R. and White, P.J. (eds) Plant Nutritional Genomics. Oxford: Blackwell, pp. 265–286.
- Halpern, G.M. and Miller, A.H. (2002) Medicinal Mushrooms. New York: M. Evans.
- Hayes, K.C. (2002) Dietary fat and heart health: in search of the ideal fat. Asia Pac. J. Clin. Nutr., 11: 394–400.
- Hofmann, D., Jung, K., Bender, J., Gehre, M. and Schüürmann, G. (1997) Using natural isotope variations of nitrogen in plants an early indicator of air pollution stress. J. Mass Spectr., 32: 855–863.
- Hofmann, D., Gehre, M. and Jung, K. (2003) Sample preparation techniques for the determination of natural 15N/14N variations in amino acids by gas chromatography‐combustion‐isotope ratio mass spectrometry (GC‐C‐IRMS). Isot. Environ. Health Stud., 39: 233–244.
- Humphries, E.C. (1956) Mineral composition and ash analysis. In: Peach, K. and Tracey, M.V. (eds) Modern Methods of Plant Analysis. Berlin: Springer, pp. 468–502.
- Jambunathan, R. and Singh, U. (1980) Studies on Desi and Kabuli chickpea (Cicer arietinum) cultivars 1. Chemical composition. In: Proceedings of the International Workshop on Chickpea Improvement, ICRISAT, Hyderabad, India, pp. 61–66.
- Johnsy, G., Sargunam, D., Dinesh, M.G. and Kaviyarasan, V. (2011) Nutritive value of edible wild mushrooms collected from the Western Ghats of Kanyakumari District. Bot. Res. Int., 4: 69−74.
- Jordan, M. (2004) The Encyclopaedia of Fungi of Britain and Europe. London: Francis Lincoln.
- Kalač, P. (2009) Chemical composition and nutritional value of European species of wild growing mushrooms: a review. Food Chem., 113: 9−16.
- Kavishree, S., Hemavathy, J., Lokesh, B.R., Shashirekha, M.N. and Rajarathnam, S. (2008) Fat and fatty acids of Indian edible mushrooms. Food Chem., 106: 597−602.
- Khan, M.A., Jacobsen, I. and Eggum, B.O. (1979) Nutritive value of some improved varieties of legumes. J. Sci. Food Agric., 30: 395–400.
- Kumar, R., Tapwal, A., Pandey, S., Borah, R.K., Borah, D. and Borgohain, J. (2013) Macro‐fungal diversity and nutrient content of some edible mushrooms of Nagaland, India. Nusantara Biosci., 5:1−7.
- Kumari, B. (2012) Diversity, sociobiology and conservation of lepiotoid and termitophilous mushrooms of North West India. PhD thesis, Panjabi University, Patiala, India.
- Lindequist, U., Niedermeyer, T.H.J. and Jülich, W.D. (2005) The pharmacological potential of mushrooms. Evid‐Based Compl. Alt. Med., 2: 285–299.
- Longvah, T. and Deosthale, Y.G. (1998) Compositional and nutritional studies on edible wild mushroom from Northeast India. Food Chem., 63: 331–334.
- Manjunathan, J., Subbulakshmi, N., Shanmugapriya, R. and Kaviyarasan, V. (2011) Proximate and mineral composition of four edible mushroom species from South India. Int. J. Biodivers. Conserv., 3: 386−388.
- Manoharachary, C., Sridhar, K.R., Singh, R. et al. (2005) Fungal biodiversity: distribution, conservation and prospecting of fungi from India. Curr. Sci., 89: 58–71.
- Meghalatha, R., Ashok, C., Nataraja, S. and Krishnappa, M. (2014) Studies on chemical composition and proximate analysis of wild mushrooms. World J. Pharm. Sci., 2: 357−363.
- Mohanan, C. (2011) Macrofungi of Kerala. Handbook # 27. Peechi: Kerala Forest Research Institute.
- Müller, H.G. and Tobin, G. (1980) Nutrition and Food Processing. London: Croom Helm.
- Nareshkumar, S. (2007) Capillary gas chromatography method for fatty acid analysis of coconut oil. J. Pl. Crops, 35: 23–27.
- Niveditha, V.R. and Sridhar, K.R. (2015) Nutritional qualities of fermented beans of coastal sand dune wild legume Canavalia maritima. In: Watson, R.R., Tabor, J.A., Ehiri, J.E. and Preedy, V.R. (eds) Handbook of Public Health in Natural Disasters: Nutrition, Food, Remediation and Preparation. Wageningen: Academic Publishers, pp. 443–464.
- NRC‐NAS (1989) Recommended Dietary Allowances. Washington DC: National Academy Press.
- Nwokolo, E. (1987) Nutritional evaluation of pigeon pea meal. Pl. Foods Hum. Nutr., 37: 283–290.
- Nwokolo, E. and Oji, D.I.M. (1985) Variation in metabolizable energy content of raw or autoclaved white and brown varieties of three tropical grain legumes. Ann. Food Sci. Technol., 13: 141–146
- Oboh, G. and Shodehinde, S.A. (2009) Distribution of nutrients, polyphenols and antioxidant activities in the pilei and stipes of some commonly consumed edible mushrooms in Nigeria. Bull. Chem. Soc. Ethiop., 23: 391–398.
- Padua‐Resurreccion, A.B. and Banzon, J.A. (1979) Fatty acid composition of the oil from progressively maturing bunches of coconut. Philip. J. Coconut Stud., 4: 1–15.
- Pegler, D.N. and Vanhaecke, M. (1994) Termitomyces of Southeast Asia. Kew Bull., 49: 717–736.
- Phillips, R. (2006) Mushrooms. London: Pan Macmillan.
- Pomeranz, Y. (1998) Chemical composition of kernel structures. In: Pomeranz, Y. (ed.) Wheat Chemistry and Technology. St Paul: American of Cereal Chemists, pp. 97–158.
- Sadler, M. (2003) Nutritional properties of edible fungi. Nutr. Bull., 28: 305–308.
- Senthilarasu, G. (2014) Diversity of agarics (gilled mushrooms) of Maharashtra, India. Curr. Res. Environ. Appl. Mycol., 4: 58–78.
- Shills, M.E.G. and Young, V.R. (1988) Modern nutrition in health and disease. In: Neiman, D.C., Buthepodorth, D.E. and Nieman, C.N. (eds) Nutrition. Dubuque: Wm C. Brown, pp. 276–282.
- Singdevsachan, S.K., Patra, J.K., Tayung, K., Sarangi, K. and Thatoi, K. (2014) Evaluation of nutritional and nutraceutical potentials of three wild edible mushrooms from Similipal Biosphere Reserve, Odisha, India. J. Verbr. Lebensm., 9: 111−120.
- Slavin, J., Jacobs, D.R. and Marquart, L. (1997) Whole grain consumption and chronic disease: protective mechanisms. Nutr. Canc., 27: 14–21.
- StatSoft (2008) Statistica Version # 8. Tulsa: StatSoft Inc.
- Sudheep, N.M. and Sridhar, K.R. (2014) Nutritional composition of two wild mushrooms consumed by tribals of the Western Ghats of India. Mycology, 5: 64−72.
- Thacher, T.D., Fischer, P.R., Strand, M.A. and Pettifor, J.M. (2006) Nutritional rickets around the world: causes and future directions. Ann. Trop. Paediatr., 26: 1–16.
- Tibuhwa, D.D., Kivaisi, A.K. and Magingo F.S.S. (2010) Utility of the macro‐micromorphological characteristics used in classifying the species of Termitomyces. Tanz. J. Sci., 36: 31–45.
- USDA (1999) Nutrient Data Base for Standard Reference Release 13, Food Group 20: Cereal Grains and Pasta. Agriculture Handbook # 8–20. Washington, DC: US Department of Agriculture, Agricultural Research Service.
- Venn, B.J. and Mann, J.I. (2004) Cereal grains, legumes and diabetes. Eur. J. Clin. Nutr., 58: 1443–1461.
- Wahnon, R., Mokady, S. and Cogan, U. (1988) Fatty acid composition in soybean oil. Proceedings of 19th World Congress of the International Society for Fat Research, Tokyo.
- Welch, R.M. and Graham, R.D. (2005) Agriculture: the real nexus for enhancing bioavailable micronutrients in food crops. J. Tr. Elem. Med. Biol., 18: 299–307.
- Yusuf, A.A. Mofio, B.M. and Ahmed, A.B. (2007) Proximate and mineral composition of Tamarindus indica Linn 1753 seeds. Sci. World J., 2: 1−4.