 The biggest winners will have the seven CAN SLIM traits.
 Buy stocks in an uptrending market.
“When the student is ready, the master will appear.”
—BUDDHIST PROVERB
The CAN SLIM® Investing System helps you find the market’s biggest winners by looking for the traits that they have in common prior to making their big moves.
In the 1960s, IBD Chairman and Founder William J. O’Neil asked this question as a young stock broker and studied all of the market’s biggest winners going back to 1950 (IBD’s ongoing study of the market’s best performing stocks now goes back to 1880). He also did not want to leave any performance details out, so even though computers were in their infancy, he hired programmers and statisticians to catalog stock data so he could see if it somehow made more sense. And it did. His visionary approach to applying computers to his research paid off big. He found seven traits that winning stocks had in common prior to making their big price moves. This became the basis for the CAN SLIM Investing System, which has helped both professional and individual investors for decades.
Each of the letters in CAN SLIM stands for a different trait that winning stocks have in common.
C Current quarterly earnings. Minimum of 25% increase in the most recent quarter. Many of the market’s biggest leaders will have earnings increases in the triple digits.
A Annual earnings. Rate of increase at least 25%, the higher the better.
N New (new products or services, new management, new highs). Innovative companies making new price highs indicating institutional buying.
S Supply and demand. A product or service that is in big demand by the public.
L Leadership. Stocks at the top in their industry group with earnings, sales, return on equity, and price action.
I Institutional support. Mutual funds, hedge funds, pension funds, banks. The professional money is what will drive a stock’s price higher.
M Market direction. Buying leading stocks with top fundamentals in an uptrending market and selling stocks when the market goes into a correction.
Stocks form chart bases or areas of price consolidation. When they come out of these consolidations on trading volume that is 40% higher than average, we refer to it as a breakout, and this is when a stock should be bought. Buying a stock as it is breaking out of a base pattern puts the odds in your favor. Market history shows that stocks vault out of these areas of consolidation before moving even higher. But buying a stock that is extended in price from a proper base makes the trade more risky since the stock may pull back and can shake you out of a position.
There are three main base patterns that we look for in CAN SLIM Investing.
1. The most common base is the cup-with-handle pattern. It looks like a tea cup with a handle.

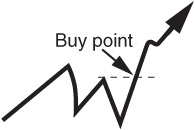
2. The double bottom base looks like a W with the exception that the right part of the W undercuts, or drifts down below, the left side of the W.
3. The flat base moves sideways in a tight range as the stock digests a previous move up.
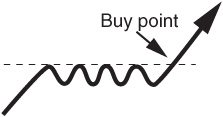
Buying stocks just as they come out of bases or areas of consolidation increases your odds of success. Look for volume that is 40% above average on the breakout.
Some secondary buy points include: (1) A three-weeks-tight pattern (where a stock closes three weeks in a tight range with less than a 1% difference in closing price during that time). (2) A stock may be bought or added to the first or second pullback to the 10-week moving average line on low volume. The low volume shows that institutions are holding onto their positions and not selling heavily.
As a stock is being bought and advances, it forms a series of bases, or areas of price consolidations along the way. Very few stocks move straight up from their first breakout. Most stocks stop and take a breather before moving higher.
We count these bases as first stage, second stage, third stage, and so on. The reason we count base stages is because IBD market studies have shown that earlier stage bases tend to be more successful than later stage bases. By the time a stock has made a big move and is in a third, fourth, or even fifth stage base, it’s too obvious, most institutions have made big money in the stock and are ready to lock in profits and sell.
There are exceptions to the rule, and some stocks do continue to move higher in later stage bases, but you want to put the odds in your favor.
Netflix is an example of a stock that formed a series of bases along its move upward.
Look for stocks that are in earlier stage bases.
To Determine the Market Trend:
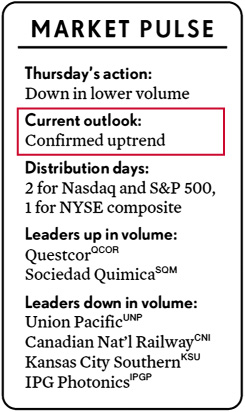
1. Check the Market Pulse found in The Big Picture column of IBD to find the current market trend.
2. Watch the Market Wrap video every day to stay in touch with what happened in the market as well as the action of leading stocks at http://investors.com/IBDTV.
To Find Leading Stocks:
1. Look at the IBD 50 in the Monday and Wednesday editions of the paper.
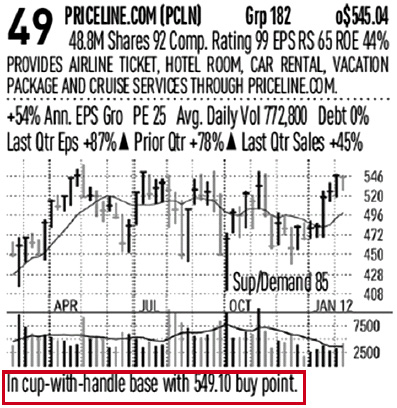
2. Read underneath the mini charts to identify a proper buy point in a stock’s base pattern.
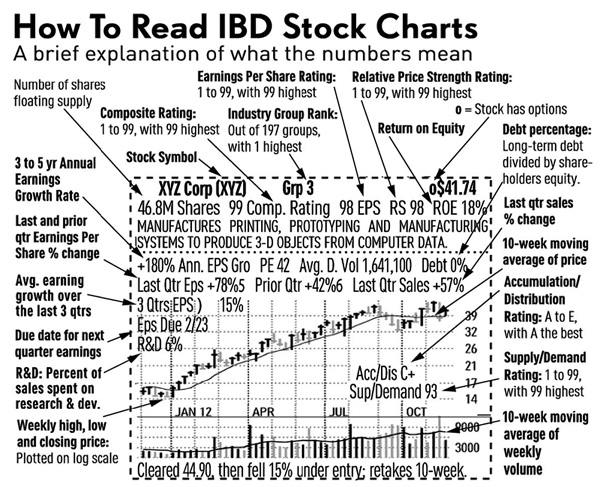
Particular Things to Look for in the Chart
Earnings. Ideally double or triple digit numbers, the higher the better.
Sales. Minimum of 25% increase in the most recent quarter vs. the same quarter last year.
Return on Equity. Minimum of 17%, but many market leaders will have ROEs much higher. This shows how efficient a company is with its money.
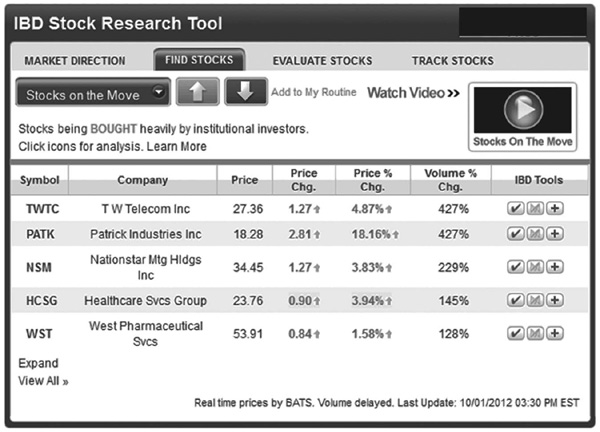
See which stocks are rising on unusual volume (meaning institutional buying is coming into the stock) with Stocks on the Move at Investors.com (http://www.investors.com) throughout the trading day.
Stay in step with the current market trend. Look at the IBD 50 and Stocks on the Move to find leading stocks.
IBD Meetups are the fastest growing financial clubs in the United States. The reason for this is the success many members have had as a result of joining these groups, which meet once a month to discuss the CAN SLIM Investing System.
At a typical meeting, groups will discuss the current market trend, leading stocks, and how to build a watch list. They also go over a lesson designed by IBD Chairman and Founder Bill O’Neil, and ask questions. More seasoned investors help newer investors learn the system and how to succeed.
Katrina Guensch lives in an area that doesn’t have an IBD Meetup Group, so she participates in one that has online monthly webinars: the Chicago/Naperville IBD Meetup. She says, “The group has detailed meetings that have really helped me learn.” Through the webinars, she has met other investors to e-mail and discuss the current market and leading stocks.
Gay Walsh is a TV writer and had a desire to do more with her money, so she joined several IBD Meetup Groups in the Southern California area and found that attending so many increased her learning curve. She said, “Watching other people read charts was really helpful. A writer’s life can be up and down; I wanted to establish security for retirement. IBD Meetups have been a great resource for me.”
Carol Shontere says, “I have attended every single Thousand Oaks Meetup since June 2010. I have been blessed to find the best of the best with this group, including leadership from Mike Scott and Jerry Samet, and I have learned so much.”
Prabin Bishoyi is a senior software engineer who works for IBD. He sends out a newsletter to his group after each meeting, summarizing what was discussed as well as what stocks were analyzed from the group’s watch list. As a leader, he engages the group with quizzes to cement key learning points in between meetings. He also has his group participate in creating a mock portfolio to see what kind of gains the group could generate from stocks that were discussed at the monthly meetings. Prabin says, “I am a continual student of the market and work hard so I can help my Meetup group members find success with IBD.”
Dennis Wilborn is an IBD Meetup leader from the Bay Area Money Makers, or BAMM for short. The group is “dedicated to technical analysis and, as a group working together, to achieve financial freedom by following CAN SLIM trading techniques.” The group first discusses the current trend, builds a watch list of superior growth stocks, and goes over proper entry points and position size as well as exit points, primarily using the IBD 50. One of Dennis’ most quotable statements is to “clarify and simplify so you multiply.” Having studied many different investing methodologies, he has “found the IBD 50 to be a treasure trove of the market’s best performing stocks. This is where the big fish hang out. If you apply strict trading strategies and follow the overall market trend, you can do exceptionally well. That’s because the IBD 50 stocks have to pass stringent criteria before making the list.”
Norm Langhout is 80 years young and the IBD Meetup leader from Santa Monica, California. This was one of the first IBD Meetup Groups in the country, which Norm started at a Starbucks before moving to a Coco’s in 2003. Norm believes strongly in volunteering and doing community work to help other people. He also thought that by starting an IBD Meetup Group, he would find other investors with whom he could discuss the market and stocks and thought “we could learn from each other.” Norm has been a good mentor and has spawned several IBD Meetup leaders that originally started with Santa Monica IBD Meetup, including Mike Scott, the Thousand Oaks IBD Meetup leader; John Mackel, the Pasadena IBD Meetup leader; Sherman Neff and Louis Gabriel, the leaders from the Sherman Oaks IBD Meetup Group; and Jerry Samet, who helps teach at several IBD Meetup Groups.
Ted Leplat has taught over 250 IBD Meetup Groups across the country as an IBD national speaker and educator. He says, “Investing is the greatest opportunity, and everyone can learn to profit from the market.” From his vast teaching experience, Ted realizes that most people are short on time, so Ted has a simple routine that he teaches to the Meetup groups:
1. First, Ted goes to The Big Picture column to determine the overall trend. He makes note of stocks that are up on volume from the Market Pulse and starts a watch list.
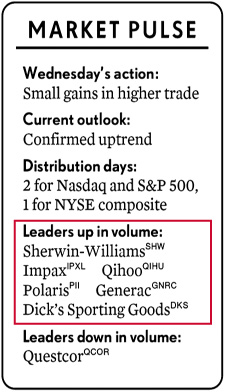
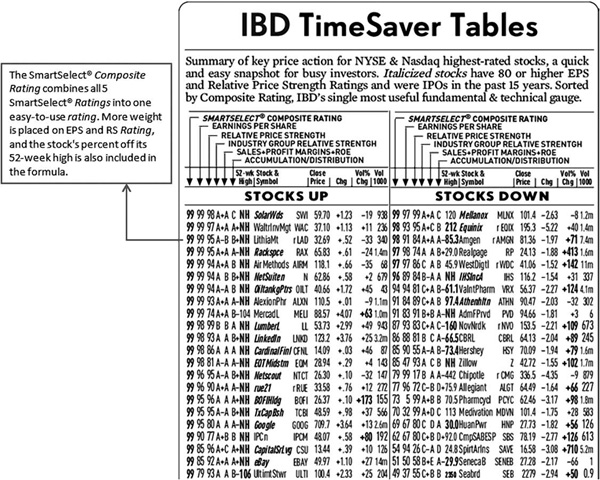
2. Next, Ted takes the stocks that he found up on volume from the Market Pulse and looks for the stock that is highest ranked in the Timesaver Table. This provides one new stock to add to a watch list every day.
3. Then Ted takes investors to Stock Checkup® on Investors.com as a quick way to check a stock’s strength in its industry group, earnings, sales, and other key fundamental data.
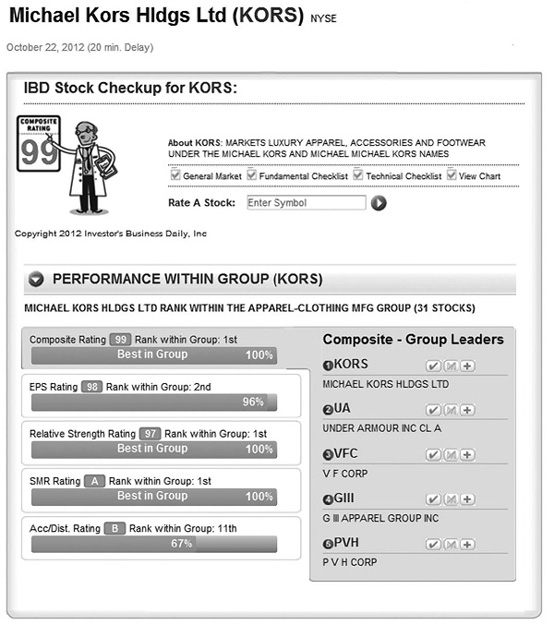
4. Finally, Ted consults a chart to see if the stock is setting up in a base pattern.
On the weekend, investors can read other IBD features to validate their picks during the week.
“The person with more time can do this routine with as many of the stocks in the Market Pulse as they want to,” says Ted.
Rao N. says, “I have learned a lot about CAN SLIM and the importance of a routine from Ted Leplat and the IBD Meetups.”
Join a free IBD Meetup Group at http://www.investors.com/Meetup.