 Don’t own more stocks than you can handle properly and watch carefully.
How Many Stocks Should You Own?
How to Build and Maintain an Actionable Watch List
How to Do a Profitable Post-Analysis
“Many investors over-diversify. The best results are usually achieved through concentration, by putting your eggs in a few baskets that you know well and watching them carefully.”
—WILLIAM J. O’NEIL, IBD CHAIRMAN AND FOUNDER
There is no magic formula that determines exactly how many stocks you should own. But here are some basic guidelines to keep in mind.
 Don’t own more stocks than you can handle properly and watch carefully.
I remember talking with an investor at a Money Show years ago who told me she owned over 60 stocks! Who has time to keep tabs on 5 dozen different positions? Not me! And not anyone else I know at Investor’s Business Daily either—including Bill O’Neil.
So before you jump in and start buying a bunch of stocks, ask yourself a simple question: How much time will you realistically spend on investing each week?
Let’s say you only have 10–20 minutes a day and some more time on the weekend. That is definitely enough to go through the simple routines (Chapter 4) and start generating good profits—if you limit yourself to a few top-rated stocks.
Remember what I keep saying about keeping it simple. That also goes for the number of stocks you own.
Start small. If you find you can handle more stocks down the road, fine. But definitely don’t buy more stocks than you can manage successfully when you’re just getting started.
 Diversify for the right reasons.
Diversification is not a bad thing, per se. The problem is, too many investors diversify for all the wrong reasons—and that’s what gets them into trouble. Here are some examples.
 Diversification can dilute your results. Your goal is to have your biggest winners also be your biggest positions. If you get a 100% gain in a stock that is only 1 of 20 different positions in your portfolio, it’s a nice percentage gain—but it doesn’t make you any significant money.
 Over-diversification can lead to buying some stocks with less potential or lower quality. Will you really achieve superior results by buying inferior stocks? Be picky, and only invest in top-rated stocks that pass the Buying Checklist.
 Over-diversification does not protect your portfolio. Here’s why the idea of “safety in numbers” doesn’t apply to your portfolio.
First, it’s much harder to spot early warning signs if you have to constantly track 15 or 20 stocks. But you can do it very quickly if you only need to check in on 3 or 4 positions.
Second, when you own a lot of stocks, you also have to sell a lot of stocks to protect your overall portfolio. If you own 20 stocks, will you really sell 10 or 15 of them quickly enough to avoid serious damage?
Remember: A market downtrend will take 3 out of 4 stocks down with it. Owning a bunch of stocks doesn’t change that fact—it just makes it that much harder to reduce your risk.
On the other hand, if you own 3 or 4 stocks, you only need to sell 1 or 2 to quickly safeguard a significant portion of your money.
The main one is to avoid putting all your money into one industry.
For example, if you own nothing but semiconductor stocks or nothing but housing stocks—both of which are cyclical industries—you’re taking on undue risk. If bad news or an economic downturn suddenly rocked the industry, all of your stocks might instantly sell off.
Stocks move in groups. If institutional investors start pumping money into a particular industry, stocks in that business will generally go up. And when fund managers decide they want out, all stocks in that group are at risk.
In Bill’s quote at the beginning of this chapter, he didn’t say put all your eggs in one basket. The point is that you don’t want to diversify just because people say diversification is “good” or “safe.” Instead, concentrate on a few stocks in a “few” baskets—and watch them very carefully.
A General Guideline for How Many Stocks to Own
Based on the concepts above, here is a basic rule of thumb for how many stocks to have in your portfolio.
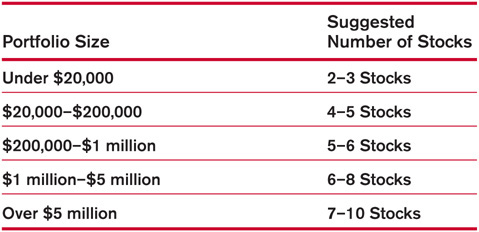
Set a Maximum Number, and Stick to It
 As part of your investing game plan, decide the maximum number of stocks you’ll own at one time. When you reach that cap, stay disciplined: Before you buy another—presumably better stock—sell your weakest holding to make room for it.
Bottom line: Be selective and only buy a few top-rated CAN SLIM®stocks that pass the Buying Checklist, then watch them very closely. That’s a more manageable way to grow your portfolio.
“It takes as much energy to wish as it does to plan.”
—ELEANOR ROOSEVELT
Superior results start with a superior watch list. So here are 4 steps you can take to build and regularly refresh your list.
Keep in mind: This is just one possible approach you can use to get started. Find whatever approach works best for you.
 Create 2 watch lists.
• Near Buy Point: For stocks near a potential buy point or in buying range right now.
To keep this list actionable, be sure to prune it regularly so it doesn’t get cluttered with stocks not currently near a buy point.
• Radar Screen: For stocks with CAN SLIM® traits that are not near a buy point right now.
You want to keep any eye on these because they could offer a buying opportunity later.
Most people set them up using tools from their online broker or trading platform. Ask your brokerage service what watch list tools they offer.
Set a limit on how many stocks you’ll have on each list. For a watch list to be valuable, it has to be actionable. So stick to a manageable number of stocks. You might limit your Near Buy Point list to 5–10 stocks and your Radar Screen list to 15–20. The number depends on how much time you have to spend on research.
Don’t hesitate to be picky! Only keep stocks that pass the Buying Checklist with flying colors on your list. Over the long term, focusing on the strongest stocks will generate the biggest returns.
 Use the Simple Weekend Routine and IBD tools to find quality stocks.
 See “Simple Routines for Finding Winning Stocks” (Chapter 4) and “More Ways to Find Winning Stocks” (later in this chapter).
 Run the most promising stocks through the Buying Checklist. If they pass, add them to your Near Buy Point list. If a stock has the CAN SLIM traits but is not currently near a buy point, you can add it to your Radar Screen list.
 Make a game plan for stocks on your Near Buy Point list.
To catch a stock as it breaks out, you need to make your game plan ahead of time. It’ll often be too late if you wait until after the stock has begun its move.
At a minimum, be sure to note:
 The ideal buy point
 How many shares you’ll buy if the stock breaks out on heavy volume
Trade triggers: You can also set up automatic trade triggers ahead of time if you can’t watch the market during the day (Chapter 4).
Earnings season: Check when a stock you’re tracking is scheduled to report. Stocks can make a big move—up or down—when they release their latest numbers (Chapter 3).
 Review and refresh your watch list regularly.
Your watch list will only be actionable and effective if you keep it focused and up to date.
 Regularly refresh your list as part of your weekend and/or daily routine.
 If you’ve reached the maximum number of stocks you set for your list, be sure to remove your weakest stock before you add a new one.
 When in doubt about what to keep or cut, focus on the “big rocks”:
 Which stock has the biggest earnings growth?
 Which company has the most innovative product or service dominating its industry?
 Which stock is being most heavily bought by institutional investors?
Keep building and refreshing your watch list even if the market is in a downtrend. The best stocks form bases during a correction, then quickly shoot higher when a new uptrend begins. To catch these winners and make big money when the market is up, you need to prepare while the market’s down.
• ACTION STEPS •
“The only way you get a real education in the market is to invest cash, track your trade, and study your mistakes.”
—JESSE LIVERMORE, LEGENDARY INVESTOR
Even the best investors make mistakes—but they learn from them. That’s why after decades of investing, IBD founder Bill O’Neil and his portfolio managers still regularly do a post-analysis of their trades. It’s simply the best (perhaps, the only) way to become a successful investor over the long term. So make sure you keep good records of your trades and review them at least once a year.
We’ll get into 2 ways to help you do that:
 5 questions to help you do a profitable post-analysis
 Improve your returns by improving your records
Finding and fixing just one or two common mistakes can have a huge impact on the amount of profits you make. Maybe you’re buying stocks when the overall market is weak or holding your stocks a little too long.
Whatever the issue, don’t get discouraged. Each time you address one of yesterday’s pitfalls, you add that much more to tomorrow’s profits.
Start with—and Stick to—Basic Rules
 You can easily avoid many common pitfalls from the start simply by following the buying and selling checklists found in this book.
These basic questions will help you pinpoint any habits that need to be addressed.
1. Was the market in an uptrend when you bought the stock?
Don’t fight the market! When the market is in a correction, it will take most stocks down with it. So keep the odds in your favor: Only buy stocks when the Market Pulse outlook says “Confirmed uptrend.”
See Big Rock #1 (Chapter 3).
2. Did the stock have CAN SLIM® traits when you bought it?
Always start your search for tomorrow’s big winners by looking for stocks that have the 7 CAN SLIM traits and the “big rocks” we discussed: Focus on stocks that have big earnings growth, new innovative products and are being heavily bought by institutional investors.
See the Buying Checklist (Chapter 3).
3. Did you buy at a proper buy point?
Most winning stocks launch their big moves as they break out of a cup-with-handle, double bottom or flat base. If you don’t use charts to identify those money-making opportunities, you’re putting yourself at a serious disadvantage. Charts prove that “timing really is everything.”
If you ran into trouble with the stock, go back and see if it passed the Buying Checklist at the time you bought it:
 Did you buy too late—after the stock was already over 5% past the ideal buy point?
 Did you buy too early—trying to anticipate a breakout?
 Was volume at least 40%–50% above average at the breakout?
 Was it a late-stage base?
 Were there serious flaws in the base, such as wide and loose action or excessive distribution (selling)?
 Did you hold a stock because it had good earnings growth and a great product—even as the stock fell lower and the chart flashed clear sell signals?
Whatever the issue is, don’t dwell on your mistake—fix it! A good starting point is to always make sure a stock passes the Buying Checklist before you buy.
See the Buying Checklist (Chapter 3) and Don’t Invest Blindly (Chapter 6).
4. Did you follow sound sell rules?
Maybe your emotions took over, and you let a little loss become a big one. Or maybe you sold too soon—and a stock you used to own went on to huge gains without you.
That’s frustrating, but here’s the good news: All those issues can be fixed by following some time-tested sell rules. And you can start applying the most important ones right now by using the Selling Checklist.
See the Selling Checklist (Chapter 5).
5. Did you continually weed out laggards and focus your money on your best-performing stocks?
One common—and costly—mistake many investors make is they sell their winning stocks and hold onto their laggards. That’s exactly the opposite of what you want to do. To build a winning portfolio, always shed your weak or losing stocks first.
Cut all losses short, and look for chances to steer money into your best-performing stocks when they form a 3-weeks tight or other alternative buy point. In other words: Maximize your returns by making your biggest gainers your biggest positions.
See the 8 “Secrets” of Successful Selling (Chapter 5) and Alternative Buy Points (Chapter 6).
If you ask these questions for each of your trades—and answer them honestly!—you’ll avoid making the same mistakes in the future. That’s how you generate even bigger profits for the rest of your investing career.
• ACTION STEPS •
“You can’t manage what you don’t measure.”
—W. EDWARDS DEMING
Your online broker keeps a basic record of your trades—purchase price, number of shares, etc. But to systematically improve your skills and returns, you’ll want to personally keep a more detailed account of every buy and sell. As you’ll see, it’s very easy to do, and the payoff is definitely worth the extra little effort.
As we just saw, regularly reviewing your trades is essential to your success. Having good records of your trades makes doing that review so much easier and faster.
Plus, writing down your reasons for the trade at the time you make it will help prevent rash buy and sell decisions. It forces you to step back and make sure you’re sticking to the buying and selling checklists. Trust me—you’ll be a lot more confident and comfortable if you have a sound rationale for making that trade before you make it.
Here’s a simple way to keep a snapshot of what each stock looked like when you bought or sold it. If you follow these steps, you can always go back and see what the chart action, ratings, earnings and other key criteria looked liked at the time of your trade.
Every time you make a buy, print out the following for each stock:
 Daily and weekly chart
 Current IBD Stock Checkup
You can print these out and keep them in a binder. I prefer to create PDF documents and store them on my computer. I find that easier to organize, but the format doesn’t matter. Do whatever works best for you. What’s important is that you keep a detailed record of what was happening with the stock at the time of your purchase.
Here’s the nice thing about printing out Stock Checkup: It does most of the work for you! Just print it out, and you have a permanent snapshot of what was happening at the time you bought the stock.
You’ll find pass, neutral or fail ratings for:
 Market direction: Uptrend or correction?
 Your stock’s fundamental performance (earnings and sales growth, return on equity, etc.)
 Your stock’s technical performance (fund ownership, Relative Strength Rating, etc.)
It takes all of about 2 seconds and makes doing a post-analysis much easier.
Here are some other things you want to note. I add them as “comments” on the chart PDFs I create, but you could also just grab a pen and write them down on your printouts.
 Basic info
 Date of purchase, number of shares purchased, cost per share.
 Base and buy point
 Note the type of base (e.g., cup-with-handle) or other buy point (e.g., pullback to 10-week moving average line), and draw it on the chart.
 Any yellow flags?
 Examples: Lower than ideal sales growth, a slightly weak industry group ranking, etc.
 Primary reasons for buying
 Examples: Breakout from cup-with-handle on heavy volume; new innovative product; emerging industry trends, etc.
 Target sell prices
 Offensive: Typically 20%–25% above ideal buy point
 Defensive: Typically 7%–8% below your purchase price
Just like when you buy a stock, print out the following every time you sell:
 Daily and weekly chart
 Current IBD Stock Checkup
Selling is one of the toughest parts of investing. But if you follow the Selling Checklist and get in the habit of keeping good records, you’ll be surprised how quickly you become more adept at locking in profits at the right time.
Be sure to write down the following:
 Basic info
 Date of trade, your sell price, number of shares sold, number of shares you still own after the sale (if any), your % gain or loss
 Reasons for Selling
 Examples: Hit target of 20%–25% above ideal buy point; fell 7% below what you paid for it; crashed below 50-day moving average line on the heaviest volume in months, etc.
To make money over the long term, you need good habits and routines. You can do that just by following the simple routines and checklists we covered earlier and by keeping detailed records so you’re able to properly review your results.
Just as athletes watch past games to improve their skills, as investors, we all need to review our past trades. But to do that, you need to have the “game tape”—and you will if you follow the steps above. Then you’ll be ready to do a quick and profitable post-analysis to minimize any mistakes and build on your successes.
IBD’s stock lists, ratings and other features all have one common goal: To alert you to today’s best stocks.
You’ll find today’s top performers in IBD’s lists because they screen the entire market, looking for stocks with CAN SLIM® traits—the 7 characteristics the biggest winners typically have just before they launch a major price move. Those are the same traits found on the Buying Checklist (Chapter 3).
We’ve already touched on some of the features we’ll get into here—IBD 50, Your Weekly Review, Sector Leaders and others.
If you’re busy, I suggest you start by using the tools and stock lists we covered as part of the Simple Weekend Routine and 10-Minute Daily Routine (Chapter 4). You can dig into other features as you get more comfortable with IBD and investing in general.
Pay special attention to any stocks that keep popping up on multiple lists.
There’s a reason that happens: These stocks are the true market leaders with the potential to double or triple in price.
They say “the squeaky wheel gets the grease.” Here’s just one example of how the “squeaky stocks” get the profits:
 Lululemon Athletica: 196% gain in just 10 months
The yoga apparel retailer launched that explosive price move when it broke out of a double bottom on September 14, 2010. Here are just a few of the places Lululemon was screaming “Look at me!” to anyone using IBD and the Simple Weekend Routine (Chapter 4).
 For well over a month before its breakout, Lululemon was continually featured in the IBD 50 (IBD 100 at the time) and highlighted as a Sector Leader.
 June 7, 2010: Featured in the Daily Stock Analysis video.
 September 10, 2010: Four days before it launched its 196% run, Lululemon made a massive 13% gap up on volume 612% higher than normal—a clear sign big investors were buying heavily.
That was a Friday, so when you did your Simple Weekend Routine, here are just some of the features that would have alerted you to that move:
 The Big Picture
 Stocks on the Move
 Smart Table Review
 IBD 50
 September 13, 2010: Doing your 10-Minute Daily Routine (Chapter 4), you would have seen Lululemon highlighted again in The Big Picture and Stocks on the Move.
 Key Points:
 All these mentions of Lululemon came before it broke out and shot up 196% in just 10 months.
 That gave you plenty of time to have the stock on your watch list (“How to Build and Maintain an Actionable Watch List” in this chapter) and set up a trade trigger (Chapter 4) with your broker to make sure you caught Lululemon right when it launched its move.
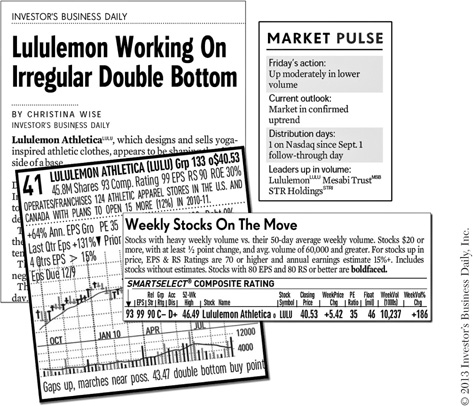
Lululemon Athletica was highlighted in IBD multiple times before it surged 196% in 10 months.
In every strong market uptrend, you’ll find similar examples. So while they say good stocks are hard to find, in IBD they’re hard to miss! You’ll see what I mean when you start using the stock lists and features highlighted below.
Never Buy a Stock Just because It’s Featured in IBD!
 These are not recommendations. The purpose is to alert you to stocks showing the most potential. Always make sure a stock passes the Buying Checklist before you invest.
As we’ve seen repeatedly in this book, since most stocks simply move in the same direction as the general market, successful investing starts with one basic question: Is the market currently heading up—or down?
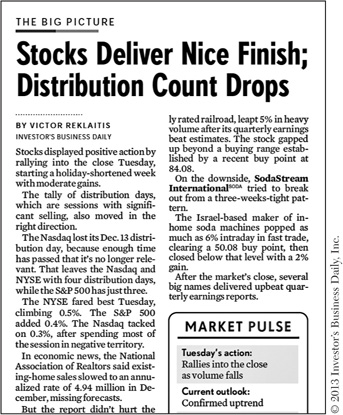
You can always find the answer by checking the Market Pulse in The Big Picture column.
Here’s another thing you’ll find in the Market Pulse: Leaders up in volume. As you scan The Big Picture during your daily or weekend routine, be sure to check that to see which top-rated stocks made a big move that day. That could be signaling the start of a nice run.
When & Where
Daily in the Making Money section of IBD and on Investors.com
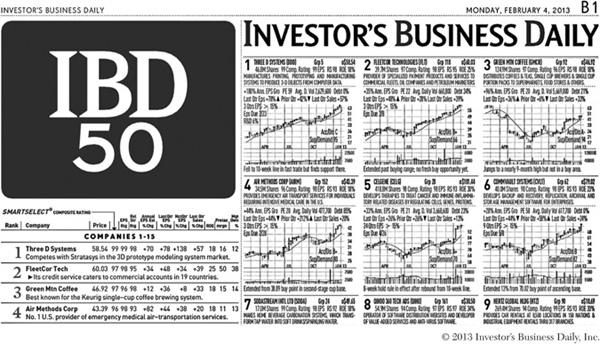
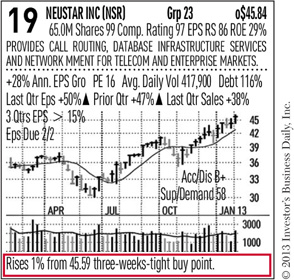
IBD 50 highlights the 50 top-rated growth stocks. It features stocks with market-leading earnings growth, a strong return on equity and other key CAN SLIM traits. When checking the IBD 50, be sure to read the Inside the 50 column for more insight into these top performers.
IBD 50, Your Weekly Review, Sector Leaders, and IBD Big Cap 20 also include a chart for each stock that features:
 Current ratings and other vital data
 IBD SmartSelect® Ratings
 Current and annual earnings growth
 Return on equity
 Industry group ranking
 Alerts to any potential buy points
 See Chapter 6, “Don’t Invest Blindly”
When & Where
Mondays and Wednesdays in the Making Money section of IBD In the Screen Center on Investors.com
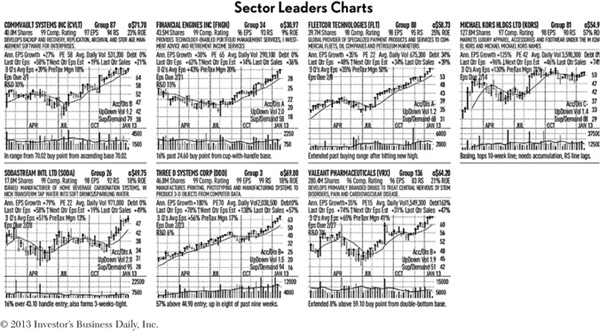
As the name suggests, this list features the top-rated stocks within their respective industry sectors. To be counted as a sector leader, a stock has to pass a tight screen that looks for exceptional earnings growth, return on equity and other vital factors. Because it’s such a demanding screen, only a few of IBD’s 33 sectors will have a company that qualifies as a leader.
To get more insight into the current sector leaders—what they do, industry trends, potential buy points—see the Smart Table Review column, found daily in the Making Money section of IBD and on Investors.com.
Like in the IBD 50, a chart with alerts to any potential buy points is included for each stock.
When & Where
Daily in the Making Money section of IBD The related Smart Table Review column is also available on Investors.com
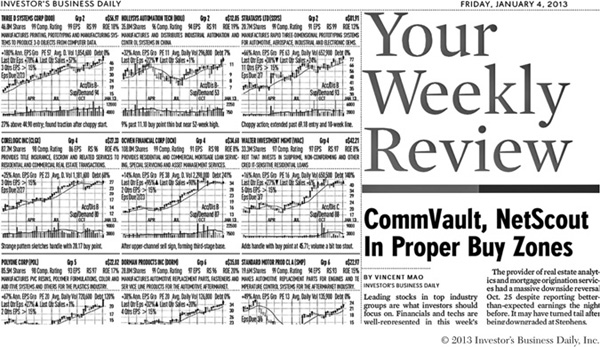
Your Weekly Review highlights stocks that have 2 of the most important factors to look for:
 85 or higher score for both EPS and RS Ratings
We saw earlier (Big Rock #2, Chapter 3) that you want to look for stocks with a strong EPS Rating and a solid Relative Strength (RS) Rating. Stocks must have both to make this list.
 A top-rated stock in a top-ranked industry group
Stocks on Your Weekly Review are sorted by industry group ranking, so you’ll find the leading stocks in the higher-ranked groups at the top of the list.
Like in the IBD 50 and Sector Leaders, a chart with alerts to any potential buy points is included for each stock.
You’ll also find a related column that provides more insight into the stocks on this list.
When & Where
Fridays in the A section of IBD The Your Weekly Review column is also available on Investors.com
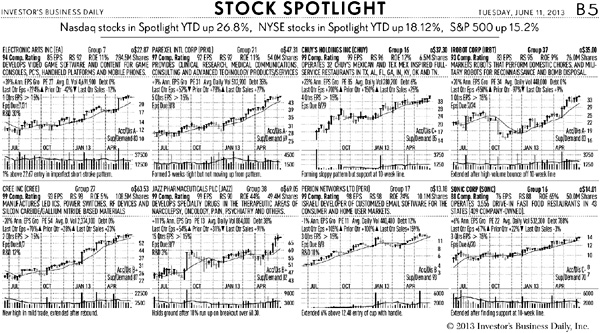
Stock Spotlight highlights 16 leading stocks forming a base or just breaking out. It includes a brief chart analysis for each stock, making it a powerful way to build a timely watch list.
Be sure to also read the article that accompanies the list. It typically features 1 or 2 stocks from that day’s list, noting any potential buy points or other key news.
When & Where
Daily in the Making Money section of IBD
The Stock Spotlight Analysis article is also available on Investors.com
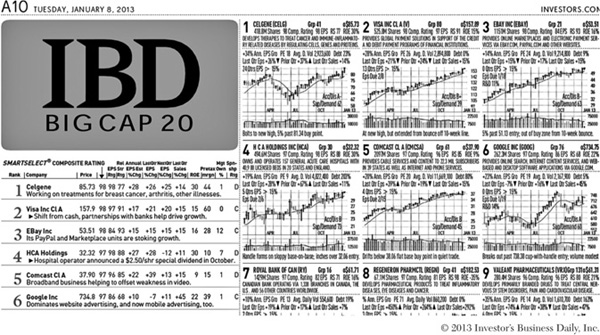
IBD Big Cap 20 highlights the top growth stocks with a market capitalization of at least $15 billion.
While all stocks can be volatile, the larger, more established companies that make this list tend to be more conservative and less susceptible to big price swings than smaller cap growth stocks.
For each IBD Big Cap 20 stock, you’ll find the same type of chart found in IBD 50 and Your Weekly Review, with alerts to any potential buy points.
Also look at the Inside Big Cap 20 column for additional insight into selected stocks and the latest trends affecting the list.
IBD Big Cap 20 can help you reduce volatility in your portfolio but still offer the potential for substantial gains.
When & Where
Tuesdays in the A section of IBD
The Inside Big Cap 20 column is also available on Investors.com
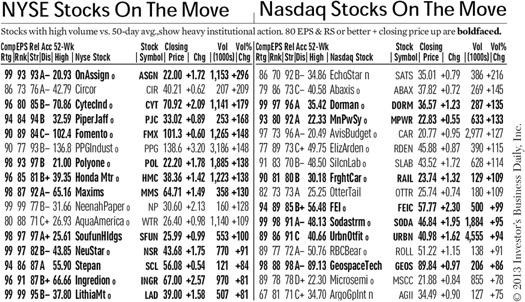
Daily print version of Stocks on the Move
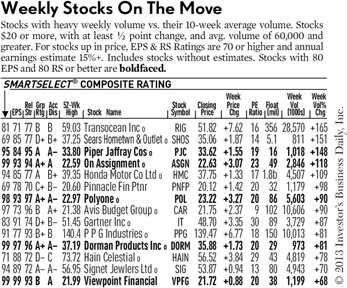
Weekly print version of Stocks on the Move
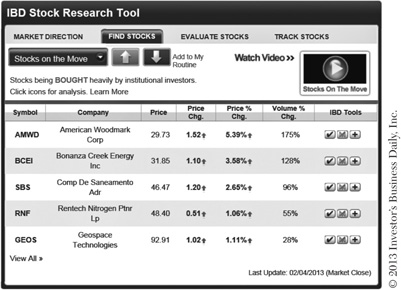
Online version of Stocks on the Move
Want an easy way to find stocks being heavily bought by institutional investors right now? Check Stocks on the Move. It highlights stocks making a big price move on unusually heavy volume—a sign of professional trading.
There are 3 different versions of this list:
 Daily print edition
 Weekly print edition
 Online version—updated every minute throughout the trading day
Be sure to check the print or digital edition of IBD at night or on the weekends to see which stocks made a big move that day or week. And if you have time, take a look at Stocks on the Move on Investors.com while the market is still open. Both are great ways to get new stock ideas for your watch list.
Since winning stocks tend to start a major new price move by jumping higher on a big spike in volume, virtually all big winners appear on Stocks on the Move in the early stages of their runs.
How to Get in Early on Winning Stocks
 Learn to spot future winners by seeing how you could have found Chipotle Mexican Grill before it broke out using Stocks on the Move. Take a look at www.investors.com/GettingStartedBook.
When & Where
Stocks on the Move: Daily in the Making Money section of IBD
Weekly Stocks on the Move: Mondays in the Making Money section of IBD
Online version of Stocks on the Move: Home page of Investors.com; updated every minute throughout the trading day

Each day in IBD, you’ll find these 3 powerful lists all on the same page— giving you a quick snapshot of stocks to keep an eye on.
 New High List
Remember what we learned earlier: Stocks hitting new price highs tend to go higher. This list shows you which stocks just hit a new 52-week price high that day. Be sure to also read the New High List Analysis article right below the list. That gives you more insight into the action of specific stocks.
 Stocks Just Out of Bases
Stocks tend to launch a big move by breaking out of a cup-with-handle, double bottom or other type of pattern (Chapter 6). This list highlights stocks that just did that. Still, you want to make sure the stock passes the Buying Checklist and is not “extended” beyond the 5% buying range.
If the stock is extended, keep an eye on it. It may go on to offer an alternative buying opportunity, like a pullback to the 10-week moving average line, which brings us to...
 Stocks Pulling Back to 10-Week Line
As we saw earlier (“Alternative Buy Points,” Chapter 6), after a stock breaks out, it may take a breather and pull back to that benchmark line. If it finds support and bounces higher on heavy volume, it could offer a buying opportunity.
When & Where
Daily in the Making Money section of IBD You can also read New High List Analysis column on Investors.com
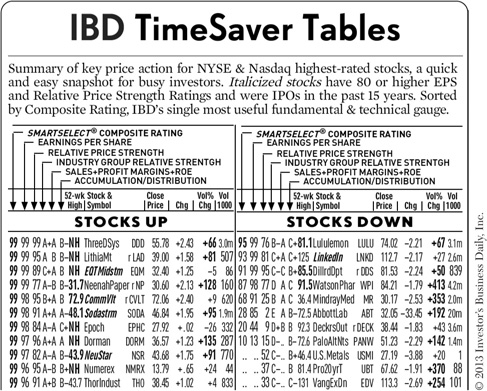
As the name implies, this list makes it quick and easy to see which top-rated stocks showed bullish action that day. The TimeSaver Tables are sorted by Composite Rating (Big Rock #2, Chapter 3) to help you zero in on the true market leaders.
When & Where
Daily in the Making Money section of IBD

The “N” in CAN SLIM stands for “new”—a new innovative product, new management or new industry trend.
It’s a key driver of a stock’s climb, as we saw in Big Rock #2: Focus on companies with big earnings growth and a new, innovative product or service.
Each day, The New America page profiles companies that have that all-important “N.”
Be sure to also check out our New America Analysis videos, which highlight the latest chart action, ratings and trends of companies recently profiled in The New America column.
When & Where
Daily in the A section of IBD and on Investors.com New America Analysis videos updated weekly under the “IBD TV” tab on Investors.com
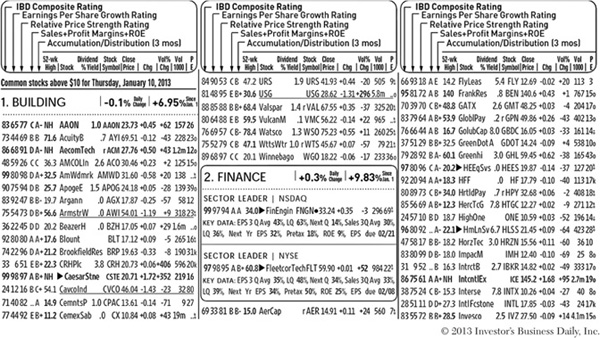
Not all stock tables are created equal.
Most publications either no longer even print stock tables—or just include bare bones data like how much a stock was up or down that day. Most don’t even include “volume” —and without volume, you can’t tell if institutional investors are heavily buying, heavily selling or just sitting tight.
We call our stock tables “smart tables” because they include a remarkable amount of vital data in one easy-to-use location. Here’s a quick look at what you’ll find:
• IBD SmartSelect ® Ratings for every stock to easily separate leaders from laggards
• Volume % Change for that day: Was it unusually heavy or light?
• Sector Rankings: The tables are sorted by sector strength so you can see where institutional investors are moving their money and identify the top stocks in the top industries.
When & Where
Daily in the Making Money section of IBD and on Investors.com
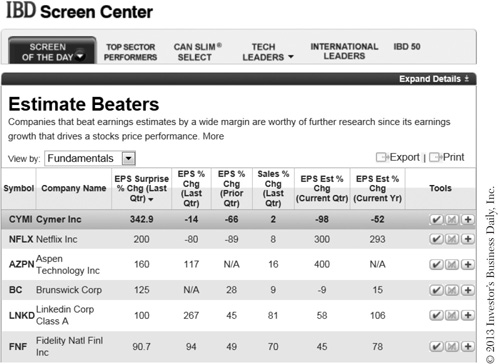
Here are just a few of the lists you’ll find on the IBD Screen Center:
• Screen of the Day: A rotating list of screens that looks for “Small-Cap Leaders,” “Young Guns,” “Estimate Beaters” and more.
• CAN SLIM® Select: A list of today’s top CAN SLIM stocks.
• IBD 50: The online, sortable and printable version of the IBD 50 list found in the paper.
When & Where
Updated daily and found under the “Research” tab on Investors.com
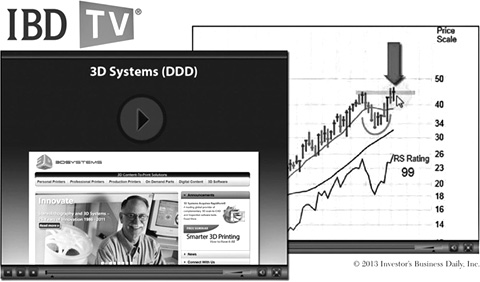
If you’ve been doing the Action Steps throughout this book (and I hope you have!), you’re already familiar with these IBD TV videos.
 Market Wrap
Think of Market Wrap as the video version of The Big Picture column.
It walks you through the latest market action, highlighting important moves and potential buy points of selected leading stocks. Since it’s in video format, you get a detailed look at chart patterns and other key price and volume movements. It’s a great way to stay on top of the latest market trends, improve your chart-reading skills and get new stock ideas all at the same time.
 Daily Stock Analysis
Like the Market Wrap video, the Daily Stock Analysis (DSA) helps you build a quality watch list as you also improve your chart-reading and stock-picking skills.
Each DSA video walks you through the latest action of a leading stock. It highlights chart patterns and potential buy points and takes a look at the story behind the stock, as well as the company earnings growth, analyst estimates and other factors that could affect its performance.
These short “how to” videos are a great way to see key investing strategies in action and get to know IBD’s tools and features. You’ll find videos on everything from How to Handle a Market Correction to IBD 50 Charts— A Profitable Tool for Your Portfolio.
When & Where
All videos are found under the “IBD TV” tab on Investors.com
Market Wrap: Monday–Friday
Daily Stock Analysis: Thursdays and Fridays
IBD 2-Minute Tips: Occasional
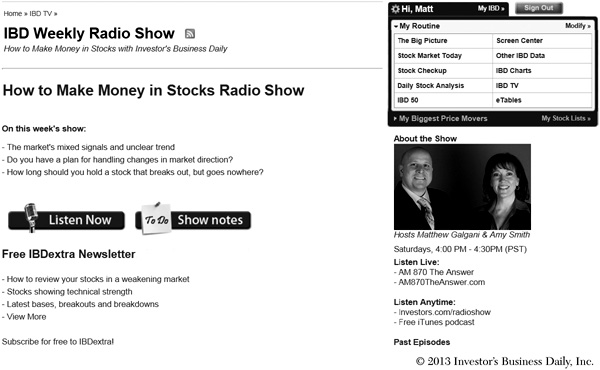
I hope you’ll join Amy Smith and me each week for the latest episode of the IBD radio show. It’s an easy way to stay on top of the market and learn to use key investing rules and strategies.
Tune in to hear about:
 Current market conditions
 Stocks to watch
 How to apply key investing rules to today’s market
 Insights from members of the IBD Markets Team and other special guests
You’ll also find show notes for each episode featuring chart markups, related videos and other resources that will help jump start your investing skills.
When & Where
For details on how and when to tune in, and to check out the show notes, visit www.investors.com/radioshow
You can also download current and past episodes for free on iTunes
Reading this column regularly is like having your own personal investing course—which you can take on your own time, at your own pace. It’s a great way to enhance and expand on what we cover in this book.

When & Where:
Daily in the Making Money section of IBD and on Investors.com
A must-read weekly column by IBD founder William J. O’Neil
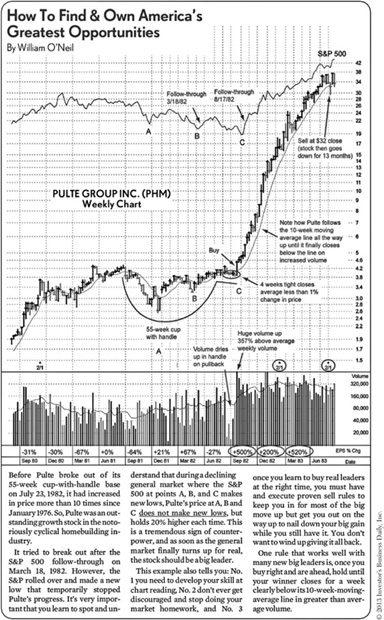
By now I think this point is clear: To find tomorrow’s big winners, you need to know what past winners looked like just before they made their big price moves. So as part of your search for the next “great story” stocks, be sure to also study past successes.
One of the best ways to do that is to always read Bill’s weekly column, where he walks you through the complete “life cycle” of a huge market winner. You’ll see:
 The explosive earnings growth and other CAN SLIM traits the stock had before it surged
 What innovative product or service was driving that growth
 The type of chart pattern that launched the stock’s big move
 Buy, sell and hold signals that showed you the right time to get in—and out
It’ll help you spot future winners—and handle them properly and profitably when you do.
When & Where
Wednesdays in the Making Money section of IBD

Leaderboard—IBD’s premium online service—is another way to find winning stocks before they launch a major price move.
Here’s how it works:
• Leaders List: The IBD markets team searches for the best-of-the-best stocks and adds them to this small, manageable list.
• Leaders near a buy point: Here you’ll find alerts to Leaders List stocks that are in or near a potential buying range.
• Intraday chart analysis with buy—and sell—signals: Typically before the breakout, the markets team annotates the charts so you can see the pattern, the exact buy point and any positive or negative signs to keep an eye on. After a stock breaks out, the team continues to track the stock, alerting you to any signs that it might be time to lock in your profits.
Because you get ongoing markups and analysis of the charts, I highly recommend Leaderboard as a way to learn chart-reading, while also getting alerts to both buy and sell signals in the top-rated stocks.
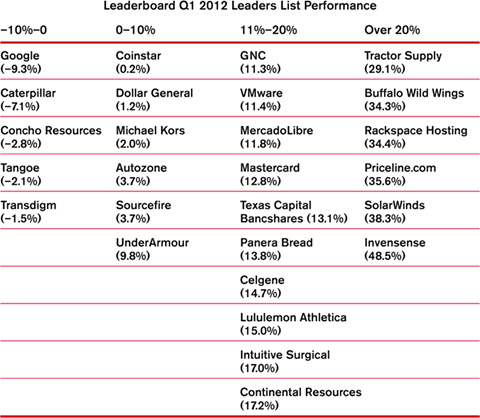
The Results Are In
Here’s just one example of the kind of gains you can tap into using Leaderboard.
See How Leaderboard Works—and Take a Free Trial
 To watch a video my radio show co-host Amy Smith and I did that shows Leaderboard in action—and to try Leaderboard free for 2 weeks—visit www.investors.com/GettingStartedBook.