It takes something new to produce a startling advance in the price of a stock. It can be an important new product or service that sells rapidly and causes earnings to accelerate faster than previous rates of increase. Or it can be a change of management that brings new vigor, new ideas, or at least a new broom to sweep everything clean. New industry conditions—such as supply shortages, price increases, or the introduction of revolutionary technologies—can also have a positive effect on most stocks in an industry group.
In our study of the greatest stock market winners, which now spans the period from 1880 through 2008, we discovered that more than 95% of successful stocks with stunning growth in American industry fell into at least one of these categories. In the late 1800s, there was the new railroad industry connecting every part of our country, electricity, the telephone, and George Eastman’s camera. Edison created the phonograph, the motion picture camera, and the lightbulb. Next came the auto, the airplane, and then the radio. The refrigerator replaced the icebox. Television, the computer, jet planes, the personal computer, fax machines, the Internet, cell phones … America’s relentless inventors and entrepreneurs never quit. They built and created America’s amazing growth record with their new products and new companies. These, in turn, created millions and millions of new jobs and a higher standard of living for the vast majority of Americans. In spite of bumps in the road, most Americans are unquestionably far better off than they or their parents were 25 or 40 years ago.
The way a company can achieve enormous success, thereby enjoying large gains in its stock price, is by introducing dramatic new products into the marketplace. I’m not talking about a new formula for dish soap. I’m talking about products that revolutionize the way we live. Here are just a few of the thousands of entrepreneurial companies that drove America and, during their time in the sun, created millions of jobs and a higher standard of living in the United States than in other areas of the world:
1. Northern Pacific was chartered as the first transcontinental railroad. Around 1900, its stock rocketed more than 4,000% in just 197 weeks.
2. General Motors began as the Buick Motor Company. In 1913–1914, GM stock increased 1,368%.
3. RCA, by 1926, had captured the market for commercial radio. Then, from June 1927, when the stock traded at $50, it advanced on a presplit basis to $575 before the market collapsed in 1929.
4. After World War II, Rexall’s new Tupperware division helped push the company’s stock to $50 a share in 1958, from $16.
5. Thiokol came out with new rocket fuels for missiles in 1957–1959, propelling its shares from $48 to the equivalent of $355.
6. Syntex marketed the oral contraceptive pill in 1963. In six months, the stock soared from $100 to $550.
7. McDonald’s, with low-priced fast-food franchising, snowballed from 1967 to 1971 to create a 1,100% profit for stockholders.
8. Levitz Furniture’s stock soared 660% in 1970–1971 on the popularity of the company’s giant warehouse discount-furniture centers.
9. Houston Oil & Gas, with a major new oil field, ran up 968% in 61 weeks in 1972–1973 and picked up another 367% in 1976.
10. Computervision’s stock advanced 1,235% in 1978–1980 with the introduction of its new CAD-CAM factory-automation equipment.
11. Wang Labs’ Class B shares grew 1,350% in 1978–1980 on the development of its new word-processing office machines.
12. Price Company’s stock shot up more than 15 times in 1982–1986 with the opening of a southern California chain of innovative wholesale warehouse membership stores.
13. Amgen developed two successful new biotech drugs, Epogen and Neupogen, and the stock raced ahead from $60 in 1990 to the equivalent of $460 in early 1992.
14. Cisco Systems, yet another California company, created routers and networking equipment that enabled companies to link up geographically dispersed local area computer networks. The stock rose nearly 2,000% from November 1990 to March 1994. In 10 years—1990 to 2000—it soared an unbelievable 75,000%.
15. International Game Technology surged 1,600% in 1991–1993 with new microprocessor-based gaming products.
16. Microsoft stock was carried up almost 1,800% from March 1993 to the end of 1999 as its innovative Windows software products dominated the personal computer market.
17. PeopleSoft, the number one maker of personnel software, achieved a 20-fold increase in the 3½ years starting in August 1994.
18. Dell Computer, the leader and innovator in build-to-order, direct PC sales, advanced 1,780% from November 1996 to January 1999.
19. EMC, with superior computer memory devices, capitalized on the ever-increasing need for network storage and raced up 478% in the 15 months starting in January 1998.
20. AOL and Yahoo!, the two top Internet leaders providing consumers with the new “portals” needed to access the wealth of services and information on the Internet, both produced 500% gains from the fall of 1998 to their peaks in 1999.
21. Oracle’s database and e-business applications software drove its stock from $20 to $90 in only 29 weeks, starting in 1999.
22. Charles Schwab, the number one online discount broker, racked up a 414% gain in just six months starting in late 1998, a period that saw a shift to online trading.
23. Hansen Natural’s “Monster” energy drinks were a hit with the workout crowd, and Hansen Natural’s stock bolted 1,219% in only 86 weeks beginning in late 2004.
24. Google gave the world instant information via the Internet, and its stock advanced 536% from its initial offering in 2004.
25. Apple and the new iPod music player created a sensation that carried the company’s stock up 1,580% from a classic cup-with-handle base price pattern that was easy to spot on February 27, 2004—if you used charts.
And if you missed that last golden opportunity, you had four more classic base pattern chances to buy Apple: on August 27, 2004; July 15, 2005; September 1, 2006; and April 27, 2007—plus four more after March 2009.
In the years ahead, hundreds and thousands of new creative leaders just like these will continue to surface and be available for you to purchase. People from all over the world come to America to capitalize on its freedom and opportunity. That’s one secret of our success that many countries do not have. So don’t ever get discouraged and give up on the lifetime opportunity that the stock market will provide. If you study, save, prepare, and educate yourself, you too will be able to recognize many of the future big winners as they appear. You can do it, if you have the necessary drive and determination. It doesn’t make any difference who you are or where you came from or your current position in life. It’s all up to you. Do you want to get ahead?
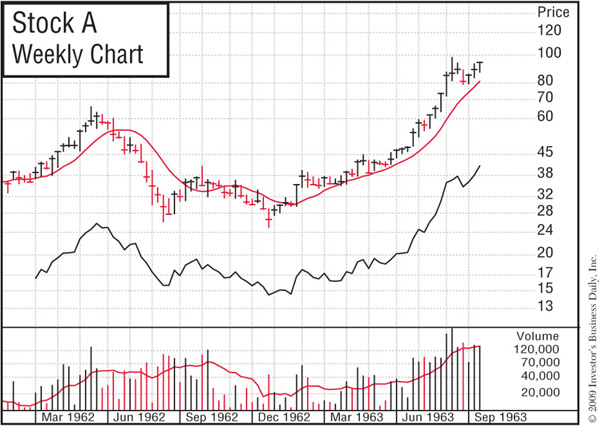
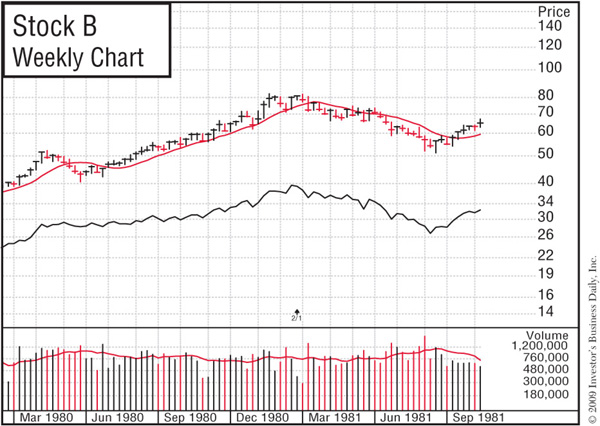
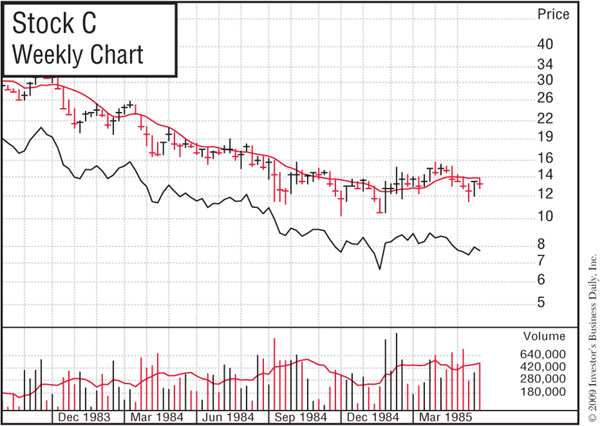
There is another fascinating phenomenon we found in the early stage of all winning stocks. We call it the “Great Paradox.” Before I tell you what it is, I want you to look at the accompanying graphs of three typical stocks.
Which one looks like the best buy to you, A, B, or C? Which would you avoid? We’ll give you the answer at the end of this chapter.
The staggering majority of individual investors, whether new or experienced, take delightful comfort in buying stocks that are down substantially from their peaks, thinking that they’re getting a bargain. Among the hundreds of thousands of individual investors attending my investment lectures in the 1970s, 1980s, 1990s, and 2000s, many said that they do not buy stocks that are making new highs in price.
This bias is not limited to individual investors, however. I have provided extensive historical precedent research for more than 600 major institutional investors, and I have found that a number of them are also “bottom buyers.” They, too, feel it’s safer to buy stocks that look like bargains because they’re either down a lot in price or actually selling near their lows.
Our study of the greatest stock market winners proved that the old adage “buy low, sell high” was completely wrong. In fact, our study proved the exact opposite. The hard-to-believe Great Paradox in the stock market is
What seems too high in price and risky to the majority usually goes higher eventually, and what seems low and cheap usually goes lower.
Are you finding this “high-altitude paradox” a little difficult to act upon? Let me cite another study we conducted. In this one, we analyzed two groups of stocks—those that made new highs and those that made new lows—over many bull market periods. The results were conclusive: stocks on the new-high list tended to go higher in price, while those on the new-low list tended to go lower.
Based on our research, a stock on Investor’s Business Daily’s “new price low” list tends to be a pretty poor prospect and should be avoided. In fact, decisive investors should sell such stocks long before they ever get near the new-low list. A stock making the new-high list—especially one making the list for the first time while trading on big volume during a bull market—might be a prospect with big potential.
If you can’t bring yourself to buy a stock at a level it has never before achieved, ask yourself: What does a stock that has traded between $40 and $50 a share over many months, and is now selling at $50, have to do to double in price? Doesn’t it first have to go through $51, then $52, $53, $54, $55, and so on—all new price highs—before it can reach $100?
As a smart investor, your job is to buy when a stock looks too high to the majority of conventional investors and sell after it moves substantially higher and finally begins to look attractive to some of those same investors. If you had bought Cisco in November of 1990 at the highest price it had ever sold for, when it had just made a new high and looked scary, you would have enjoyed a nearly 75,000% increase from that point forward to its peak in the year 2000.
Just because a stock is making a new price high doesn’t necessarily mean that this is the right time to buy. Using stock charts is an important piece of the stock selection process. A stock’s historical price movement should be reviewed carefully, and you should look for stocks that are making new price highs as they break out of proper, correct bases. (Refer back to Chapter 2 for more detail on reading charts and identifying chart patterns.) The 100 great full-page examples in Chapter 1 should have given you a real head start.
These correctly created breakouts are the points at which most really big price advances begin and the possibility of a significant price move is the greatest. A sound consolidation, or base-building, period could last from seven or eight weeks up to 15 months.
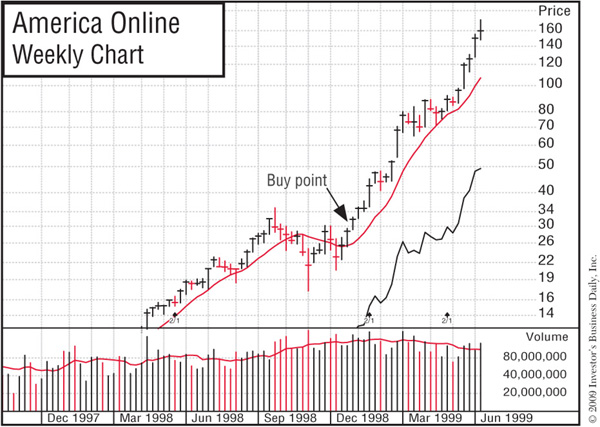
As noted in Chapter 2, the perfect time to buy is during a bull market just as a stock is starting to break out of its price base. (See the America Online chart on page 178.) If the stock is more than 5% or 10% above the exact buy point off the base, it should be avoided. Buying it at this level greatly increases the chance of getting shaken out in the next normal correction or sharp pullback in price. You can’t just buy the best stocks any old time. There’s a right time, and then there are all the other times.
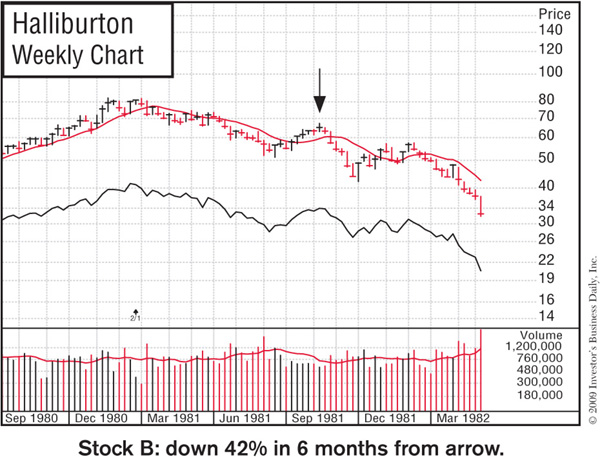
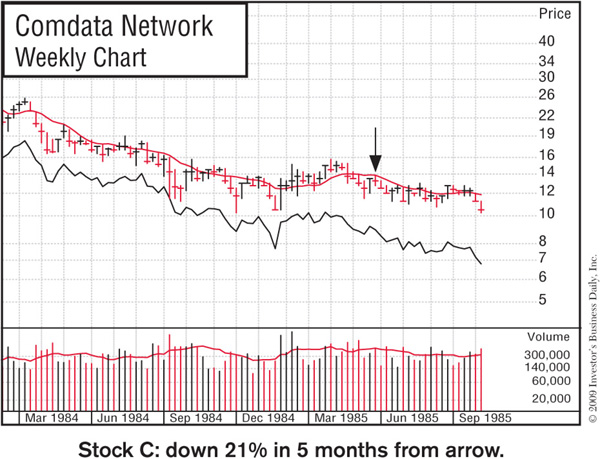
Now that you know the Great Paradox, would you still pick the same stock you did earlier in the chapter? The right one to buy was Stock A, Syntex Corp., which is shown on the next page. The arrow pointing to July 1963’s weekly price movements indicates the buy point. This arrow coincides with the price and volume activity at the end of the Stock A chart, adjusted for a 3-for-1 split. Syntex enjoyed a major price advance from its July 1963 buy point. In contrast, Stocks B (Halliburton) and C (Comdata Network) both declined, as you can see from the charts given on the next page. (The arrows indicate where the corresponding charts shown earlier left off.)
Search for companies that have developed important new products or
services, or that have benefited from new management or materially
improved industry conditions. Then buy their stocks when they are
emerging from sound, correctly analyzed price consolidation patterns and
are close to, or actually making, new price highs on increased volume.
