Chapter 3
Pursuing a Data Strategy
IN THIS CHAPTER
 Sourcing and mining for valuable data
 Identifying the hidden opportunities in your data
 Analyzing data on an ongoing basis for improved campaign performance
Data is all around you. With the advent of social media and broadcast platforms like Facebook and Twitter, data has become more powerful than ever, especially for Millennials. The amount of data that exists about them is unprecedented.
In this chapter, you develop a better understanding of the many forms in which you can extract, manipulate, and analyze data.
Recognizing the Value of Data
Data is everywhere, and as such, it’s extremely important. While the data may be overwhelming at times, when used correctly, it’s a valuable source of information that you can use in your marketing efforts.
In the following sections, you can read about several different types of data that you can use in your marketing efforts.
Raw data
Raw data is information in its purest form. Raw data is data extracted at the source but not yet processed. While raw data can be daunting when you first come across it, it’s completely malleable, which makes it one of the most valuable data types. An example of raw data sorted in a Microsoft Excel spreadsheet is shown in Figure 3-1.
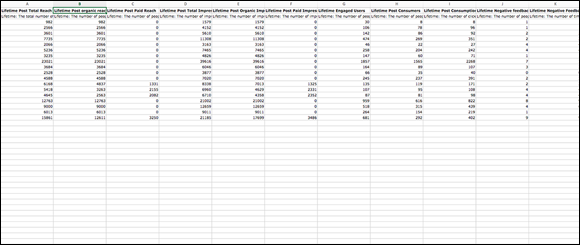
FIGURE 3-1: An example of raw data in Microsoft Excel.
Cooked data
The industry reference to cooked data relates directly to raw data. Cooked data is what marketers get when raw data has been manipulated in some way to highlight a particular segment, finding, or aspect of the unadulterated information.
Figure 3-2 shows an example of cooked data.

FIGURE 3-2: Cooked data is the result of some manipulation of raw information.
Social media user data
When it comes to social media, you can leverage a treasure trove of user information to create your marketing strategy. For example, Millennials may share answers to questions on their social feed that you never thought to ask.
Analyzing your social audience user data can be as simple as reviewing your Facebook Insights data, as shown in Figure 3-3. This data can lead to some significant breakthroughs. For more information about Facebook Insights see Book 7, Chapter 2.

FIGURE 3-3: You can find free social user data using Facebook Insights.
Customer lifetime engagement data
When a customer engages with your brand across multiple channels, a story is being told. At every touchpoint, or chapter of the story, data is collected, and you can analyze it to improve your marketing efforts.
Millennials have a preference for a single sign-in, where they have the ability to use a Facebook or Google profile to sign into all accounts, tools, websites, or online stores. With that single sign-in, information about the customer journey is collected at every step of the way, and that data is hugely valuable for improving the customer experience.
Brand profile data
You can usually find the jackpot of user data in the brand profile. This user data relates specifically to your organization. Every bit of information you extract directly informs how you might shift your marketing efforts, your sales tactics, or even some of your internal operations to improve efficiency.
Figure 3-4 shows you an example of Amazon’s recommendations. Tracking user profiles and searches and using advanced algorithms that learn about user tastes and preferences, Amazon can make customized recommendations to its customers. Over time, this robust profile data provides a company like Amazon with the ability to build a well-rounded view of each customer at every stage of the buying process.

FIGURE 3-4: Amazon recommends a series of tailored products to its customers based on their profile.
Visualized data
Just as with cooked data, visualized information is a representation of some sort of manipulated data in a visual framework. Plenty of tools exist to help users analyze and manipulate data to depict it in visual form.
Tableau (www.tableau.com), shown in Figure 3-5, is one such tool.
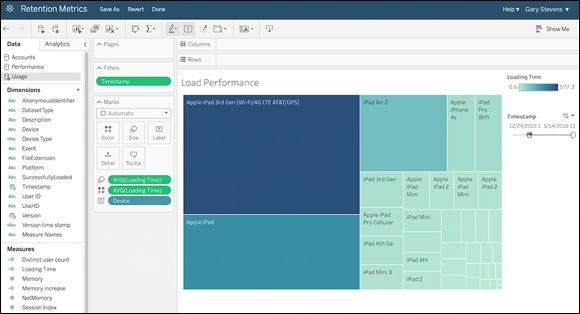
FIGURE 3-5: Tableau helps users visualize their data.
Big data
Big data means exactly what you might think it does. It’s a large amount of data collected from a variety of sources. You can analyze this data to make predictions, identify trends, improve pricing, optimize customer buying paths, and optimize products. While you can find plenty of other areas where big data may be of use, these are some of the most popular cases. For more information on big data, see Book 2, Chapter 1.
Small data
Small data results when you conduct an in-depth analysis of smaller segments of your complete data sets. When your data is condensed into smaller groups, it becomes significantly easier to analyze and more opportunities can be discovered. Diving into your small data can help improve your efforts with such things as
- Message targeting: Creating tailored messages for small groups of your Millennial audience leads to much higher engagement and conversion. Small data presents opportunities for improved targeting.
- Content and creative split testing and optimization: When you dive into your small data, you can identify minute details that allow you to optimize your campaign. This again can lead to some pretty dramatic improvements in your results.
- Rolling ad budget optimization: Improving the performance of your budget means making your ad dollars go further. When you analyze your small data, you can identify new information that leads you to change small details. These details include such things as maximum bids or placements of your ads, and they impact the performance of your campaign as a whole.
The opportunities with small data extend even further when you consider the fact that data is always full of surprises. Keep an open mind and analyze every possible angle of your small data subsets. Doing so can lead to major improvements in your campaigns.
Competitive data
You can learn quite a bit when you analyze publicly available competitive data. Your competitors are most likely trying to achieve the same objectives you are. Taking cues and learning lessons from both their successes and missteps will serve you well. What you learn from this process will help you achieve your objectives in a shorter time frame and avoid some pitfalls that were costly for your competitors.
Several tools exist for the purposes of competitive data analysis and tracking. The following three are easy to use:
- Alexa (an Amazon company) (
https://www.alexa.com): Figure 3-6 shows some of the data that Alexa pulls from a competitor’s website and digital presence when using the Pro version. The product provides users with insights into the online performance of sites across the web. - BuzzSumo (
https://buzzsumo.com): When it comes to tracking your competitors’ social presence, you have dozens of additional options. Figure 3-7 showcases BuzzSumo, which provides insights into the performance of content on social media and assists with the development of effective content strategies. - TrackMaven (
https://trackmaven.com): TrackMaven, shown in Figure 3-8, has some great features like content optimization capabilities, integrated social networks including paid ad optimization, and some pretty extensive insights into the performance of your marketing efforts.
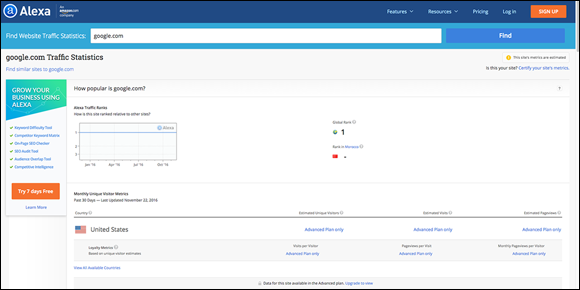
FIGURE 3-6: Alexa.
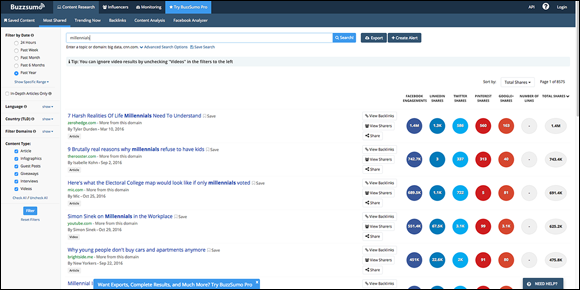
FIGURE 3-7: BuzzSumo.
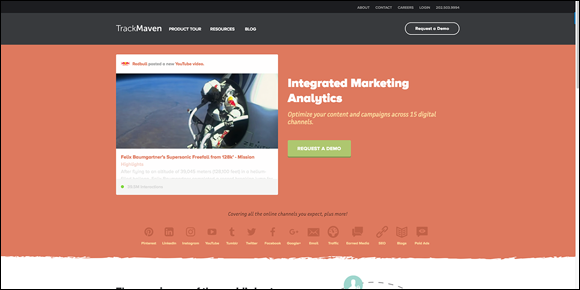
FIGURE 3-8: TrackMaven.
All of the preceding tools can help you
- Identify responsive audiences: Identify audiences that have been most responsive to your competitors’ content on both websites and social channels.
- Create effective content strategies: Craft content strategies that have a higher likelihood of driving engagement from your intended audience based on content that has succeeded in your competitors’ campaigns.
- Discover pain points: Pinpoint missteps and pitfalls that your competitors have suffered or are currently dealing with so that you can avoid facing the same issues.
- Uncover industry insights: You can use several tools to discover industry insights. Another, more advanced example of a product that highlights industry insights is Crimson Hexagon (
www.crimsonhexagon.com), which is shown in Figure 3-9. (In 2018, Brandwatch.com merged with Crimson Hexagon. At the time of this writing, they’re continuing to operate as separate brands.)
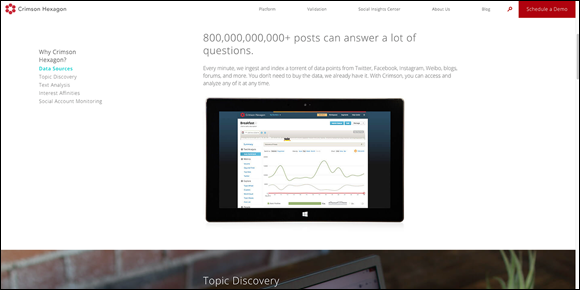
FIGURE 3-9: Crimson Hexagon is an advanced, enterprise-grade industry analysis tool.
You can also achieve the following objectives with the strategic use of industry insights:
- Development of a new or expanded content strategy
- Expansion into new media and new platforms based on engagement from your target audiences
- Development of new short- and long-term objectives
- Identification of trends that indicate how an additional investment may be beneficial
Transactional data
Transactional data are the insights gleaned from your customer transactions. If your organization has digitized its client records or if you sell products via an e-commerce platform, then transactional data will be very useful to you. Perhaps the most notable reason why you’ll want to leverage transactional data is for the purpose of improving the buyer journey, thereby shortening the path to conversion and decreasing your internal costs that go into the customer experience and marketing timeline.
Transactional data can also be extremely useful to you when allocating your marketing budget. Within a transaction, assuming that your tracking has been properly developed and implemented, you can monitor each touchpoint reached by your customer. Identifying the most valuable touchpoints across hundreds or even thousands of transactions will allow you to optimize the resources to which your budgets are allocated.
Pinpointing Key Indicators in Your Data
Although data comes in many different types, all data exhibits certain universal indicators. By monitoring these indicators, you can get a better sense of what your data is telling you and how to use it.
The following sections describe some of the more common indicators.
Outliers
Outliers are data points that sit outside of the normal range that you may expect to see when looking at a particular performance indicator, such as engagement. For example, if you generally expect to see 10 clicks on a link and a specific post receives 50 clicks, then that data point would be an outlier as it falls far outside the range that you normally see with regards to clicks and engagement. Outliers are perhaps the most valuable indicator of importance within your data sets. You can see a graphical representation of this phenomenon in Figure 3-10.
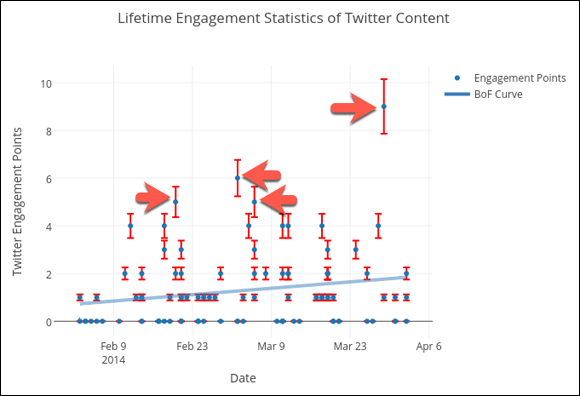
FIGURE 3-10: An example of an outlier in a data set.
You can find the steps for running a linear regression using a source like Statistics Solutions (www.statisticssolutions.com). You can also use a free analytic tool like Plotly (www.plot.ly), which is shown in Figure 3-11. The data used for these kinds of analyses can range from engagement metrics to conversions to clicks. You can analyze virtually any isolated data set using this extremely powerful method.
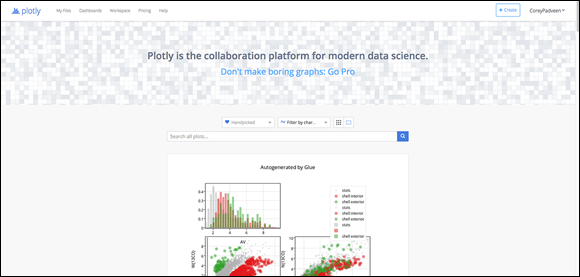
FIGURE 3-11: Plotly is a powerful free tool that makes data analysis simple.
Peaks and valleys
As with outliers, you’re looking for anomalies (things that are unusual) in your data when identifying peaks and valleys (highs and lows) within a given set.
Run through highs and lows with specific performance indicators, such as traffic from a particular social network, and determine what commonalities exist at each high point and each low point. You can compare periods of analysis — for example, a week or a month. Take what you’ve found and integrate those findings in your everyday strategy. For example, if you see on the first of every month that an unusually high amount of traffic comes from Facebook, and upon further analysis, you see that on the first you tend to share a particularly inspiring quote accompanied by a link to a landing page, use those findings to expand on this strategy and use it more frequently. Repeat this process for all your identified peaks and valleys, where it is applicable.
Correlations
When analyzing data of a particular type (whether it’s audience data or post-level data), you want to pay close attention to any correlations, either positive or negative, that exist.
Your Facebook Page’s post-level data are the insights gathered and exported about your individual posts, rather than general data about your Page and audience. The value in analyzing post-level data is that it aggregates insights about the most valuable kinds of engagement, such as clicks to your website or shares on Facebook. It provides you with the necessary information to build a robust content strategy.
For example, if you analyze high-performing posts shared on Facebook, ask yourself whether these posts share similarities such as the time they were posted, an abundance of a certain color, or length. You can then use these indicators to develop new content that will ensure a significantly higher engagement rate.
Industry trends
Using an industry monitoring technology has several benefits. One of the greatest is undoubtedly the ability to spot conversational trends within your industry before the competition does.
When using an industry monitoring tool, pay close attention to upward-trending conversation topics within your audience segments. Identifying these trends can be extremely beneficial when developing your next campaign or creating new, relevant content.
Here are some competitive data tools to consider:
Waste
When you want to optimize your budget and improve operational efficiency, waste is a powerful indicator. In this case, waste refers to ad spends put toward ads that yield little to no results. You know you have waste if you find these two primary indicators:
- A higher than average number of touchpoints in a particular sales cycle, which may indicate inefficiencies with the cycle flow.
- A significantly greater cost-per-conversion or cost-per-action, which may indicate flaws or discrepancies between the product and the Millennial audience you’ve targeted.
Using Your Data as the Foundation of Your Strategy
Millennials, more so than any generation before them, have populated the web with a seemingly endless amount of data. As a result, everything you choose to do from building audiences to developing social ad campaigns will be completely rooted in data. For more information about building audiences and ad campaigns, see Book 1.
Following are five steps you can take — before employing any strategy or starting any campaign — to ensure that you have data to justify every one of your decisions:
-
Review all the data sources to which you have access.
The following section covers specific sources, but you’ll effectively review all your owned, earned, and paid media data sources in order to pinpoint all the data to which you have access.
-
Segment your data to focus entirely on Millennials.
After you access all your data, filter anything that isn’t relevant to Millennials. Begin with age ranges and then expand to include those that possess the Millennial mindset. (See Book 4, Chapter 1 for more detail.)
-
Establish your objectives.
Of course, establishing objectives is a standard practice with every campaign you run. But in this case, you justify your objectives with actual data.
-
Refine your objectives through the use of your data.
You can now analyze the information that you have filtered to elaborate or change some of the more universal objectives that you have outlined for a given campaign.
-
Set your benchmarks and key performance indicators.
What is most important about this step is the fact that any one of your benchmarks and all your indicators should be measurable. That measurability will result from your ongoing data analysis.
Data is agnostic. That means that for every campaign you run, you can implement these five simple steps. You support every one of your actions with numbers and justify every decision with the statistics needed to back it up. Implement this process each time you plan on launching something new, and the entire process will be simpler and more successful.
Identifying Data Sources
Data can come from virtually everywhere. Millennials leave small bits of information everywhere they go. To develop your Millennial marketing strategy, you use three types of data:
- Data from your owned media channels like your website
- Data from social media channels like Facebook, Twitter, and YouTube
- Data from public channels
Data from your owned media
Perhaps the richest center of owned data is available from the backend on your website. The vast majority of businesses track their web data using Google Analytics, shown in Figure 3-12.
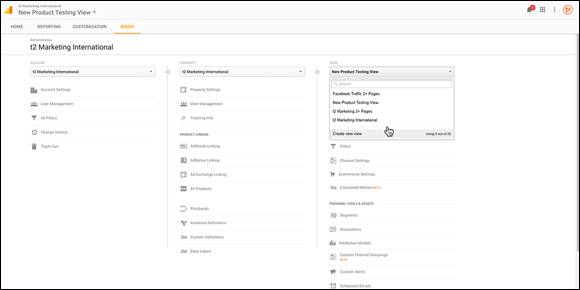
FIGURE 3-12: The Google Analytics audience dashboard.
Within Google Analytics, you can segment data according to a variety of elements. One is the ability to segment by age.
Creating a segmented dashboard in Google Analytics is simple and is useful when you want to isolate a specific cluster of data for deeper analysis. Simply follow these steps:
-
Create a new view to avoid filtering other data.
A mistake that marketers often make is applying segments or filters to general Google Analytics data. Google doesn’t save data that it doesn’t collect, so when you filter data from your general dashboard, it’s gone forever. Instead, create a new view in your admin dashboard and title it something specific, such as Millennial Web Data.
-
Add a segment in your audience dashboard.
Select the option to add a new segment in your audience dashboard, as shown in Figure 3-13.
-
Select a new segment and filter by age.
You can also filter by other criteria, but for the purposes of Millennials, you need to add only an age filter, as shown in Figure 3-14.
After you do this step, the data pulled into this segmented view will be only the data that fits the applied filters. Now, all the data you analyze in the backend of your website will relate specifically to the actions taken by Millennials visiting your website.
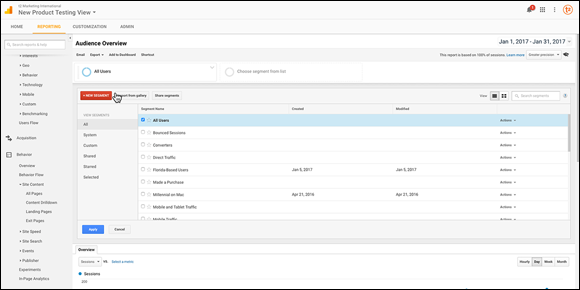
FIGURE 3-13: Create a new segment from your audience dashboard.
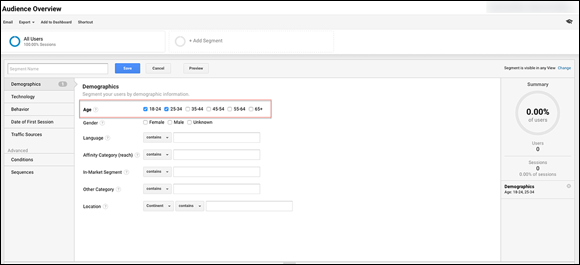
FIGURE 3-14: Select the age range filter.
You can utilize the information you collect to develop new strategies for content and marketing. For example, in the analysis of your website’s content, you can identify what posts and pages Millennials are most attracted to. Using this information, you can develop Millennial-oriented content strategies. If you’re working in an e-commerce space, you can analyze the products that are most frequently viewed or purchased by Millennials. Then you can allocate more of your marketing dollars to these high performers and eliminate some of the waste that might go to ad dollars spent on less popular products.
Another area of focus in the backend of Google Analytics will be your acquisition dashboard. Here, you can identify the channels and campaigns that have driven the most Millennial engagement. This information allows you to optimize ad dollar spending and marketing budget allocation for the different networks. You don’t want to be spending money on a channel that isn’t sending viable Millennial traffic.
Data from social media
When it comes to publicly available, accessible data on Millennial consumers’ habits and interests, you can’t find many places with such a comprehensive amount of information as social media. Millennials share everything, and you can access that data on several media platforms, such as Facebook, Twitter, and YouTube, to leverage it:
Though you can extract profile and user data from many other platforms, these three sources cover the most valuable social media platforms and provide the most insightful information about your users.
The backend of your Facebook Page contains a world of information about your audience. Simply clicking the Insights tab, as shown in Figure 3-15, reveals an abundance of data about your overall audience on the Page.

FIGURE 3-15: Access free Page insights on Facebook.
While you may not be able to segment your audience specifically by age on Facebook, like you can on your website, your audience will largely fall into the category of users that fit the Millennial mindset. This means that the observed habits that you identify in the back end and the content you analyze will be largely applicable to your Facebook content strategy.
Within Facebook, you can also export page and post-level data for further, more in-depth, analysis. This data is exported pseudo-raw, which means that it’s segmented but not manipulated. You can manipulate this information using a variety of tactics or tools to discover new opportunities.
Twitter also offers a fairly robust backend to gather insights, shown in Figure 3-16. This dashboard is available when you create an ad account, and can be found by visiting https://analytics.twitter.com, though you don’t need to be running any ads to access this data.
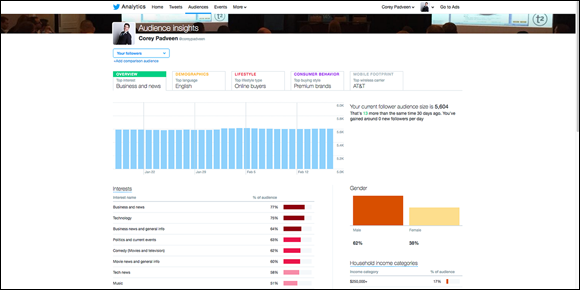
FIGURE 3-16: Twitter provides some good insight into both content and audiences.
Using Twitter, you can gather many valuable insights about audience interests, engagement rates, and details about your content. By aggregating this Twitter insight data, your content strategies can become significantly more refined, and you can develop content that leads to action.
YouTube
Much like Google Analytics age and user data, YouTube links your content with profiles of the users watching your videos. This powerful approach provides you with a better understanding of your audience’s viewing habits so that you can develop even more successful video content. It also helps you create channel and content strategies that appeal to the Millennials watching your videos.
Some of the details of YouTube view data include Watch time, Average view duration, and Views, as shown in Figure 3-17.
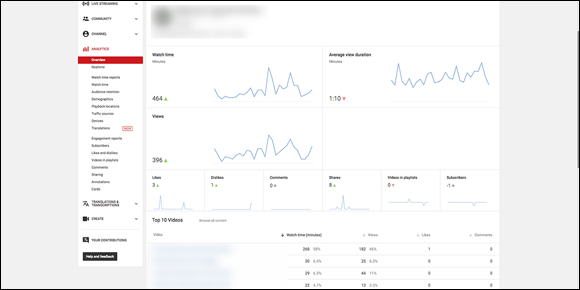
FIGURE 3-17: User viewing habits data in YouTube.
Data from public channels
You can find plenty of publicly available databases related to Millennials across the web. To manually sift through billions of public posts and bits of information would be impossible, so you’ll want to use tools that are designed to do that. Many of these products peruse tens if not hundreds of millions of online sources including blogs, forums, social networks, and e-commerce websites.
These tools are designed to scour any readily available data on the web for keywords, phrases, and brand names to provide you with the most accurate view of what the conversation looks like. These data are then visualized in an easy-to-analyze format, which allows you to quickly and efficiently identify opportunities so that you can statistically justify your strategies.
The following list of tools have some of the highest user satisfaction reviews on the market. Each has the ability to filter your user data by age range, which will allow for the analysis of all publicly available information about Millennials across your industry.
- AgoraPulse (
www.agorapulse.com): AgoraPulse offers a fairly broad range of services within its platform, from insights to management to engagement. Reporting with AgoraPulse is top quality, and it’s very affordable. (As of this writing, prices start at $49 per month.) A free trial is available. - Brandwatch (
www.brandwatch.com): Brandwatch falls on the more costly side of the spectrum of data analysis tools, but the detailed data reports make it worthwhile. You can quickly analyze your brand from all angles and measure your performance across the web compared to your competitors. You can also drill down pretty deep into the data, which can be particularly useful when it comes to identifying new campaign opportunities. A free demo is available. - Mention (
https://mention.com): Mention is a simple yet powerful listening tool that offers some great insights into the conversations taking place within your industry and around your brand. You can analyze trends at the keyword level and use that data to exploit new opportunities. A free demo is available.
A keyword in this case is a particular term with significance related to the subject matter of your audience’s conversations. If, for example, you’re analyzing conversations in the technology sector, a keyword of interest may be “machine learning,” while another term, such as “real estate,” may not be as important, depending on what it is you’re trying to analyze.
Analyzing Your Data on a Regular Basis
After you look at the key indicators that you need to analyze to get the most out of your data, you need to determine what steps to take to maximize the benefits from the strategic use of your data.
Following is a step-by-step auditing process that you can easily implement on a regular basis using the tools and processes discussed earlier in this chapter:
-
Establish an auditing schedule.
At the outset of your auditing process, you need to develop a schedule to ensure that you’re regularly keeping up-to-date with your process review.
 Generally, for smaller organizations, a monthly review is all you need. If, however, you’re a very data-driven organization, then you’ll want to review your data, benchmarks, and objectives either every two weeks or even weekly.
 -
Pinpoint the factors that indicate an opportunity.
Outliers and correlations can be indicative of opportunities within your Millennial audience. In addition, look at things like upward trending conversation topics or spikes in audience segment participation.
-
Establish benchmarks for the newly created opportunities and review benchmarks for ongoing initiatives.
You may need to establish new benchmarks each time you conduct an audit. Remember, Millennial habits may shift from one period to the next; they don’t necessarily have long attention spans when it comes to content and campaigns.
-
Review your key indicators to identify new opportunities.
Just as you review your key indicators to establish benchmarks and make the necessary adjustments, you need to review your data’s key indicators to discover new opportunities.
 Keep in mind that data can often be industry and audience agnostic. By agnostic, it’s meant that raw data can apply to any or all situations and demographics and isn’t necessarily limited by a particular group or scenario. This means that the lessons, tips, and processes covered in this chapter may not be limited to Millennials.
 When extracting raw data, running a simple linear regression and analyzing your data for outliers, generally within a 5 to 10 percent margin of error, will give you some great insights into what is working and what is not. A linear regression is a statistical analysis whereby a curve, expressed in this case by the formula y=ax+b is calculated and placed to fit over a given data set. This straight line is the closest representation of a linear progression through the data, and the proximity of your data point to this line — or curve — indicates how well a particular point fits the average. The points that fall far outside this curve are your outliers.