8
IR Spectrophotometry
- 8.1 IR Spectrophotometry
- 8.2 Instrumentation
- 8.3 Recording by Transmission, Diffuse Reflectance, and Attenuated Total Reflection
- 8.4 Instrument Calibration
- 8.5 NIR Spectrophotometry
8.1 IR Spectrophotometry
Infrared (IR) spectrophotometry is based on the fact that all atoms in organic molecules are in continuous vibration and rotation with respect to each other. When the frequency of a specific vibration is equal to the frequency of the IR radiation directed to the molecule, the molecule absorbs the radiation and the radiation is converted into energy of molecular vibration.
IR spectrophotometry follows the same basic principles for absorption of electromagnetic radiation as described for UV spectrophotometry and the principle is shown in Figure 8.1. Normally the wavelength region between 2500 and 15 000 nm is used for IR spectrophotometry. This region is termed the middle infrared region. Alternatively, the range from 800 to 2500 nm can be used. This region is termed the near infrared (NIR) region and is utilized in NIR spectrophotometry.
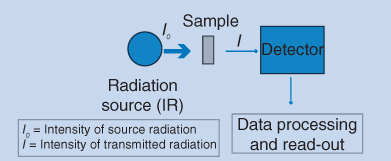
Figure 8.1 Basic principle of IR spectrophotometry
IR spectra show more detailed absorption bands than UV spectra (see Figure 8.2). IR spectra are like fingerprints of organic molecules and identification based on such spectra are considered highly reliable. The differences in complexity between UV and IR spectra are visualized in Figure 8.2 with salicylic acid as an example. In UV spectra, absorbance is plotted as a function of wavelength. However, by convention IR spectra plot transmittance as a function of wavenumber (see Figure 8.2). Transmittance is defined as follows:

I0 is the intensity of radiation directed to the sample and I is the intensity of radiation transmitted through the sample. Transmittance is often expressed as a percentage:
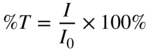
At a wavelength where the sample does not absorb any radiation, I = I0 and the transmittance is 100%. In contrast, at a wavelength where all radiation is absorbed, the transmittance is 0%. The vertical transmittance axis in IR spectra is therefore scaled from 0% to 100%. Wavenumber is used on the horizontal axis. Wavenumber is defined as follows:
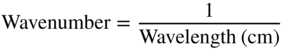
A high value for the wavenumber corresponds to a low wavelength and vice versa. Wavenumbers are expressed in cm−1 and IR spectra are typically recorded in the spectral range from 4000 to 650 cm−1.
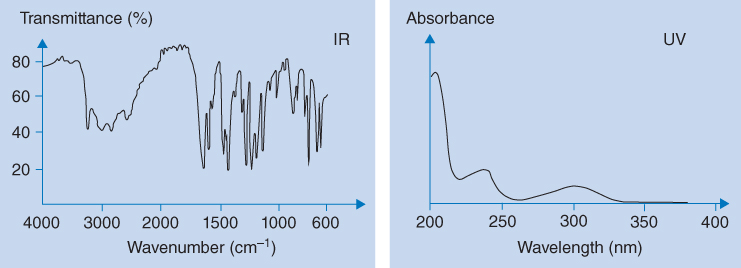
Figure 8.2 IR and UV spectra of salicylic acid
Each absorption band in an IR spectrum is correlated to the molecular structure of the substance by the wavenumber that is characteristic of the absorbing bond. At wavenumbers above 1500 cm−1, the most readily assigned bands are present. Table 8.1 shows some characteristic absorption bands. From IR spectra of unknown compounds, structural information can be derived using tables like Table 8.1. Below 1500 cm−1, which is termed the fingerprint region, absorption is very complex, and reliable assignment of bands to particular functional groups can be challenging. Box 8.1 illustrates some of the absorption bands in the spectrum for salicylic acid in relation to Table 8.1.
Table 8.1 Characteristic infrared absorption bands
| Binding | Functional group | Wavenumber (cm−1) | Intensity |
| CH | Alkanes | 2850–2970 | Strong |
| 1340–1470 | Strong | ||
| Alkenes | 3010–3095 | Medium | |
| 675–995 | Strong | ||
| Alkynes | 3300 | Strong | |
| Aromatic rings | 3010–3100 | Medium | |
| 690–900 | Strong | ||
| OH | Alcohols, phenols | 3650–3950 | Variable |
| H‐bound to alcohols, phenols | 3200–3600 | Variable (broad) | |
| Carboxylic acids | 3500–3650 | Medium | |
| H‐bound to carboxylic acids | 2500–2700 | Broad | |
| NH | Amines, amides | 3300–3500 | Medium |
| C=C | Alkenes | 1610–1680 | Variable |
| Aromatic rings | 1500–1600 | Variable | |
| CN | Amines, amides | 1180–1360 | Strong |
| CO | Alcohols, ethers, esters, carboxylic acids | 1050–1300 | Strong |
| C=O | Alcohols, ketones, esters, carboxylic acids | 1690–1760 | Strong |
| NO2 | Nitro substituents | 1500–1570 | Strong |
In the context of pharmaceutical chemical analysis, IR spectrophotometry is primarily used for identification of pharmaceutical ingredients and active pharmaceutical ingredients (APIs) in pharmaceutical preparations. In such cases, the spectrum of the substance to be examined is compared with a spectrum of a chemical reference substance (CRS). Both spectra are recorded in the wavenumber range 4000–650 cm−1. The transmission minima (absorption maxima) in the spectrum of the substance to be examined should correspond in position and relative size to those in the CRS spectrum. One example of such identification is illustrated in Box 8.2 for ibuprofen.
8.2 Instrumentation
The IR spectrophotometer comprises a radiation source (light source), a monochromator or interferometer, and a detector. Instruments equipped with a monochromator are termed dispersive instruments, which are very similar to UV spectrophotometers. The radiation source emits continuous IR radiation that is split into two equivalent beams (double‐beam configuration) that pass through the sample holder (sample channel) and the reference holder (reference channel), respectively. The reference holder is usually empty and the sample is placed in the sample holder. Using an optical chopper (such as a rotating mirror) the IR radiation through the sample and the reference channels are alternately directed through the monochromator. The monochromator scans the wavelength and the radiation signals through the sample and reference channels are amplified and then compared electronically for recording of transmittance. The double‐beam configuration is used to correct for variations in the intensity of the radiation source and to correct for fluctuations in the detector and the electronic systems. This is particularly important in the IR region because the intensity of radiation sources is relatively low. In addition, the double‐beam configuration enables continuous subtraction (background correction) of absorbance from water vapour and carbon dioxide present in the instrument, which both have strong absorption bands in the IR spectrum between 1400 and 4000 cm−1 (Figure 8.3). Thus, the signal in the reference channel is subtracted from the signal in the sample channel at each wavelength, and this net absorbance (or transmittance) is plotted as a function of wavelength (or wavenumber). Therefore, no absorption bands from water and carbon dioxide are present in the net spectrum of the pharmaceutical substance to be examined.
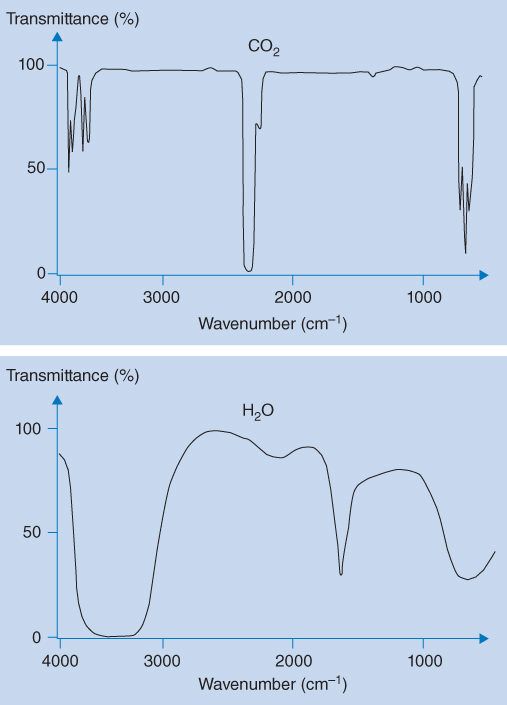
Figure 8.3 IR spectrum of water (bottom) and carbon dioxide (top)
The monochromator used in IR spectrophotometers is constructed in the same way as monochromators used in UV spectrophotometers. The major difference is the number of grooves per millimetre used in the optical grating. The grating used in UV spectrophotometers has 300–2000 grooves/mm, while the grating used in IR spectrophotometers has about 100 grooves/mm due to the higher wavelengths used in IR spectrophotometry.
The instruments described above are dispersive IR spectrophotometers where the beam from the radiation source is dispersed by the monochromator before the beam enters the detector. However, Fourier transform IR (FTIR) spectrophotometers have become very popular due to their superior speed and sensitivity. In the FTIR instruments, the monochromator is replaced by an interferometer. The interferometer produces interference signals (interferogram) that contain infrared spectral information generated after passage through the sample. A mathematical operation known as Fourier transformation converts the interferogram to the final IR spectrum. The operational principle of interferometers is very complex and is outside the scope of this textbook.
8.3 Recording by Transmission, Diffuse Reflectance, and Attenuated Total Reflection
UV spectra are recorded on diluted solutions of the analyte. In IR spectrophotometry, recording on dilute solutions is less convenient because most solvents (including water) have strong IR absorption bands. IR spectra recorded in solution will therefore contain absorption bands both from the pharmaceutical substance and the solvent. This complicates the interpretation of spectra. Therefore, IR spectrophotometry is preferably performed directly on the solid (or liquid) substance to be examined and the spectrum is recorded either by transmission (or absorption), diffuse reflectance, or attenuated total reflection, as described in the following.
The principle of recording by transmission is illustrated in Figure 8.4. The IR radiation passes through the sample and the transmitted radiation (I) is measured by the detector. If the substance to be examined is a liquid, a thin film of the liquid is sandwiched between two plates of sodium chloride (NaCl) or potassium chloride (KCl). This sandwich is then inserted in the radiation path (sample channel) and the transmission measurement is performed. Sodium chloride and potassium chloride are both transparent to IR radiation above 400 cm−1, and does therefore not contribute to interference from absorption bands in the spectrum of the substance to be examined.
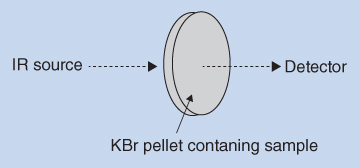
Figure 8.4 Recording by transmission
If the substance to be examined is solid, transmission is normally recorded on KBr discs. A small amount of the substance to be examined (1–2 mg) is finely ground and mixed with 300–400 mg of dry potassium bromide (KBr) in a mortar. The mixture is then compressed into a transparent disc at sufficiently high mechanical pressure. The disc is then placed in the sample holder which in turn is placed between the radiation source and the monochromator. Potassium bromide is transparent to IR radiation in the range above 400 cm−1 and has no absorption bands in the region traditionally used for IR spectrophotometry. The absorption bands recorded on the KBr disc thus originate from the analyte or impurities present in the KBr mixture. The best results are obtained when the KBr mixture is compressed in vacuo to exclude air and water. Residual water in the disc has absorption bands at 3450 and 1640 cm−1. Large particles in the disc contribute to band distortion due to scattering of the radiation. In order to minimize the effect of scattering, solid samples are ground to small particles of 2 μm or less in size.
A more recent approach is recording by diffuse reflectance, as illustrated in Figure 8.5. A small portion of the substance to be examined is ground to a fine powder and dispersed in KBr. Typically, this powder mixture contains 5% (w/w) of the substance. This powder is then loaded into a small metal cup. The powder is irradiated and the incident radiation is reflected from the base of the metal cup. IR radiation is absorbed during passage through the sample and back again, and this absorbance is measured by photocells. The resulting absorption spectrum is then converted by the instrument to a transmission spectrum. The resulting spectrum is thus very similar to the spectrum recorded by transmission through KBr discs. Diffuse reflectance is widely used in NIR spectrophotometry and can also be used to study different crystal forms of pharmaceutical ingredients (polymorphs).
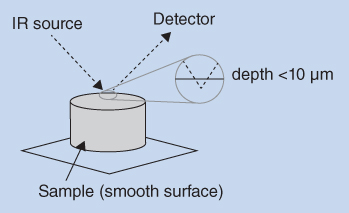
Figure 8.5 Recording by diffuse reflectance
Another recent and very popular approach is recording by attenuated total reflectance (ATR). The principle is illustrated in Figure 8.6.
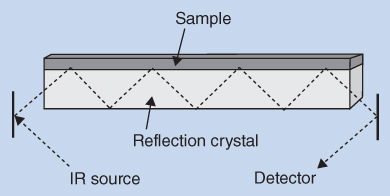
Figure 8.6 Recording by attenuated total reflectance (ATR)
The substance to be examined is placed directly in close contact with a reflection crystal such as diamond, germanium zinc selenide, or another suitable material having a high refractive index and that does not absorb IR radiation. In this case, the substance to be examined is not dispersed in KBr. A close contact between the substance and the reflection crystal is obtained by mechanical pressure or by evaporation of a solution of the substance on the reflection crystal. An infrared beam is directed on to the crystal at a certain angle. The internal reflectance creates a wave that extends beyond the surface of the crystal into the sample held in contact with the crystal. This evanescent wave protrudes a few micrometres beyond the crystal surface and into the sample. In regions of the IR spectrum where the sample absorbs energy, the evanescent wave will be attenuated or altered. The attenuated energy from each evanescent wave is passed back to the IR beam, which then exits the opposite end of the crystal and is passed to the detector in the IR spectrophotometer. Using an FTIR spectrophotometer, the IR spectrum is collected in seconds.
8.4 Instrument Calibration
IR spectrometers should be calibrated regularly to verify that absorption bands are recorded at the correct wavenumber and to control the spectral resolution. The wavenumber scale is verified using a polystyrene film, which has transmission minima (absorption maxima) at the wavenumbers (in cm−1) shown in Table 8.2. A number of absorption maxima for polystyrene are used to control the wavenumber scale and limits for satisfactory accuracy are given.
Table 8.2 Transmission minima (cm−1) and acceptance tolerances of a polystyrene film
| Transmission minimum (and acceptance tolerance) | Transmission minimum (and acceptance tolerance) |
| 3060.0 (±1.5) | 1583.0 (±1.0) |
| 2849.5 (±2.0) | 1154.5 (±1.0) |
| 1942.9 (±1.5) | 1028.3 (±1.0) |
| 1601.2 (±1.0) |
Control of resolution performance is based on a recorded spectrum of a polystyrene film. If resolution is too low, details in the spectra are lost, and consequently the value of the spectral information is reduced. The resolution performance test shown in Box 8.3 is according to the European Pharmacopoeia (Ph. Eur.).
8.5 NIR Spectrophotometry
NIR spectrophotometry is a technique with wide and varied applications in pharmaceutical analysis. The NIR spectral range extends from about 780 nm to about 2500 nm (from about 12 800 cm−1 to about 4000 cm−1). NIR spectrophotometry records spectra either in transmitted, scattered, or reflected mode. Measurements can be made directly on samples without any pretreatment. Physical as well as chemical information, both qualitative and quantitative, is available from NIR spectra. NIR spectrophotometry has a wide variety of applications for both chemical and physical testing, including:
- Identification of active substances, excipients, dosage forms, manufacturing intermediates, chemical raw materials, and packaging materials
- Quantitation of active substances and excipients
- Determination of hydroxyl value, iodine value, and acid value
- Determination of water content
- Determination of degree of hydroxylation
- Control of solvent content
- In‐process control of blending and granulation
- Testing of crystalline form, crystallinity, polymorphism, pseudo‐polymorphism, and particle size
- Testing of dissolution behaviour, disintegration pattern, hardness
- Examination of film properties
NIR is often used in connection with process analytical technology, where analysis is conducted directly and on‐line in the pharmaceutical manufacturing process. Detailed discussion about NIR spectrophotometry is outside the scope of this textbook.