
FIGURE 1. A schematic illustration of how receptive fields support neural representations in touch (above) and vision (below).
Paul Kim
AS WITH SO MANY SCIENTIFIC DISCOVERIES, it took both serendipity and suffering to reveal vision’s hidden maps within the human brain. The first of these maps was unearthed because of two things: bullets and blindness. The story of how they intersected illustrates what a brain map actually is and why it matters.
The year was 1904. Two empires, Japan and Russia, were locked in a war over territory and naval dominance. As casualties on both sides mounted, the Japanese authorities noticed something strange: a surprising number of their wounded soldiers had become fully or partially blind. Many of these cases, as might be expected, involved injuries to the eye. But nearly a quarter were due to brain damage—a proportion far greater than that of previous wars.
This shift reflected a change in weapons. The Russians were using a new type of gun: a high-velocity rifle called the Mosin-Nagant Model 91. Its bullets were 7.6 mm in diameter, smaller than bullets fitted to previous rifle models. Clocking speeds of 620 meters per second out of the barrel, they were faster as well. These changes enabled the Russians to fire bullets that traveled farther yet still hit their mark. They also changed the types of injuries these weapons caused. Previously, gunshot wounds to the head often shattered the skull or sent shock waves through tissue, creating large cavities in the brain. Not so with the Mosin-Nagant Model 91. The new bullets sliced clean through both brain and bone, leaving small, neatly circumscribed holes like perfect rounds in a paper target. As a result, more soldiers survived gunshot wounds to the head, and those who did were left with fewer mental and perceptual problems than those with head wounds in previous wars.
The Japanese soldiers who were shot in a certain part of the head reported visual problems. They experienced a hole in vision—a blind patch called a scotoma—and it traveled with their gaze as they looked from one place to the next. Damage to the eyeball can cause a person to experience a scotoma. Yet the wounds that caused these particular scotomas were in an odd location—the back of the head, far from the eyes.
These holes in vision differed, both in size and location, from one patient to the next. One man might have a scotoma in the far right-hand corner of his vision, so that wherever he looked, objects on the right would be obscured. Another man might be unable to see the very thing he fixed his gaze upon; whether he tried to look directly at a written word or at the face of his wife, the blind patch would eclipse it.
These scotomas marred a patient’s vision whether he tried to see with only his left eye, only his right, or both eyes at once. It became clear that the scotomas would handicap the soldiers for life. To compensate for these injuries and lost future income, the Japanese government planned to award the men larger pensions—a complex undertaking, in the bureaucracy of the empire. In order to determine the size of each soldier’s pension, the government needed documentation of the location and size of his scotoma.
The somber task of gathering that information would fall to Dr. Inouye Tatsuji, a young ophthalmologist who was just finishing his medical studies when the war broke out. Inouye’s work entailed performing visual field tests on the wounded soldiers. A visual field is the expanse that a person can see in all directions without moving the eyes. When you fix your gaze on a point in space, you can still see a certain distance above, below, and to either side of it. If your vision is normal, you will see best at your center of gaze, which corresponds to the point in space where you are looking. Yet you also collect visual information far from your center of gaze, such as when you notice someone “out of the corner of your eye.” Vision scientists and ophthalmologists call these regions on the outskirts of the visual field the visual periphery. Your visual field is the sum of your vision at your center of gaze and in your visual periphery. Ophthalmologists can test a patient’s visual fields in many ways, from flashing lights at different places in the visual field to simply holding up fingers in various parts of the visual field and asking the patient to count them. When a patient fails to see anything in a portion of that field (say, the lower left-hand portion), they might have a scotoma.
During his time as an army physician, Inouye performed countless visual field tests on patients with gunshot wounds or other traumas, and he compiled records of everything he found. Although his government simply needed the records to calculate pensions, the young doctor realized that they might also hold the key to resolving a long-standing scientific mystery: where was the seat of visual perception in the human brain, and how exactly was vision represented there? For decades, scientists had labored to answer these questions. Their work hinted at the existence of a map for visual information in the brain, but its exact location and layout remained unknown.
A map is a spatial representation of something else. Therefore, a brain map is a spatial representation in the brain of something else. Brains have sizes and shapes, fronts and backs, tops and bottoms. So having something spatial in the brain, something that takes up space in its surfaces, bundles, and folds, is easy enough to accept. But what does it mean for your brain to represent something about the world, whether that something is the sight of a painting or the sound of a siren?
The answer to that question begins not in the brain, but elsewhere in the body. Or rather, the key places where the body meets the outside world. Your skin is the largest and most obvious of these, but there is also the retina that lines the back of each of your eyeballs. There is the cochlea nestled deep inside each of your ears. There are the delicate tissues lining the inside of your two nostrils, and there are the moist surfaces of your tongue and mouth. And that’s more or less it. These surfaces are the conduits through which you collect information about the outside world. Each of these surfaces is lined with cells called sensory receptors, which detect information from the external world and translate it into internal messages that will be sent to the brain. These receptors are unimaginably precious. Life without them would be a life unmoored from your surroundings.
Take a closer look at one of the features that anchors you to reality: your skin. It forms a continuous surface. If you focus on any spot of skin on your body, you will likely find more skin to the left, to the right, above and below. Sure, there are interruptions, such as the eyes, the mouth, and the nostrils. But the skin continues around them, just as the shore continues around a lake. The skin on your foot is next to your ankle skin, which is next to your shin skin. In other words, your skin has features that are consistently arranged across a continuous surface. That means your skin, like the surface of the earth or the moon, has a topography, or landscape. Imagine some microbes living on your skin. If colonies of microbes could communicate and explore, they might chart out the landscapes (or perhaps skinscapes) of your body and travel around, guided by its landmarks. Want to get to the armpit? Hang a right at the belly button and a left at that oddly shaped mole.
Although your skin is continuous, its touch receptors are not. Many thousands of receptors are embedded in your skin. Some detect trauma and signal pain, whereas others register pressure, vibration, or heat. Consider the set of receptors that specifically registers pressure and vibrations on your skin. Thanks to them, you are able to feel a poke and distinguish a smooth surface from one that is rough. Each of these receptors works its magic at only one spot on your skin. A receptor on your right kneecap is tasked with detecting and broadcasting touch on one patch of that kneecap. That is all. Think of it as something like a reclusive landowner hunkered down with a shotgun: The rest of the world may do what it pleases, but if someone sets foot on my land, there’ll be hell to pay!
For that little kneecap receptor, all that matters is its kneecap territory. Scientists call this its receptive field; it is the field, or zone, from which that cell receives information. Pressure within its receptive field triggers a response, or message, from the cell. Something is happening! Pressure outside that receptive field triggers nothing. Like landowners, some receptors are responsible for bigger areas than others, but all receptors are restricted to their local plots of skin. Don’t ask a receptor on your kneecap what is happening on your back. It couldn’t tell the difference between a luxurious back massage, a slap on the back, or no touch at all. Each sensory receptor simply tells the story of its little patch of skin and sends that on to the brain.
This is where representation begins. The signals sent from an individual receptor, say, one embedded in the skin of your right knee, represent compression of that skin. So if I want to know whether your knee is being pressed, I don’t have to inspect your knee. Instead, I could listen in on the signals sent from your skin to your brain. The signal from this receptor tells me all I need to know about that single patch of skin. The signal represents the physical forces acting upon that one part of your body.
Imagine that we follow the signal sent by the receptor on your knee and travel with that signal into the brain, where it reaches a type of brain cell called a neuron. Not just any neuron, mind you; this is no willy-nilly pairing of sender and receiver, like some cartoon of an old-fashioned switchboard. The precious signal will land upon just the right neuron: a specialist that gathers signals about touch but not sight, taste, smell, or hearing. Not just that, but a super-specialist that gathers signals about touch only on and around your knee, not your elbow or your face. Even though this neuron is in your brain rather than on your skin, it has a receptive field on your body: a plot of skin on your knee. That is all it knows; it receives information about that solitary site.
Likewise, when this neuron is ready to send a signal of its own to other parts of the brain, it can speak only to what it knows: information about touch on your knee. Even though this neuron is in your head and not on your kneecap, its signals will represent touch information from your knee. When this cell sends a signal to other places in the brain, this signal means something. It represents what has happened on that specific patch of skin. This is the central idea behind representation in the brain and a necessary ingredient of brain maps, not to mention pretty much everything the brain achieves. If brains did not create such representations, we would be done for. Brains allow us to gather clues from our sensory receptors and send instructions to our muscles only by representing what receptors sense and how muscles move.
Because of such representation, neuroscientists can now detect what a person is feeling on their skin simply by observing activity in their brain. Conversely, they can manipulate what a person thinks they feel on their skin by directly mucking around with their brain. That is the powerful thing about representation: once you know how it works, you can use it to listen in on signals or even change them.
Representation works nearly the same way for vision as it does for touch. Vision begins at the back of the eyeballs. When tiny packets of light, or photons, enter your eyes, they travel through your eyeballs and land on the delicate tissues of your retina. Embedded in each retina are many millions of sensory receptors that detect photons.
Just as skin is continuous, the retina that lines the back of the eyeball is a continuous sheet. And just as your skin has a topography, so too do your retinas. For instance, each retina has a conspicuous pit called the fovea; when you look directly at something—say, a stop sign—light that bounces off that sign and enters your eye will fall upon a sensory receptor in your fovea. Because light travels in a straight line and because the receptors in your eye are anchored in place, a receptor in your fovea will only ever detect and represent light coming in from your center of gaze, the area you are currently looking at. Likewise, a receptor far away from your fovea will only ever detect and represent light coming from elsewhere, a specific region of space far away from where you are directing your eyes. In this way, receptors in your eyes, like receptors in your skin, have receptive fields, allowing your retina and, eventually, your brain to represent the information that you collected with your eyes—in essence, to represent what you see.
FIGURE 1. A schematic illustration of how receptive fields support neural representations in touch (above) and vision (below).
Paul Kim
So although your skin and your retinas are continuous surfaces, your ability to detect touch with your skin or light with your eyes is not. It is built from the sum of all of those little signals coming from tiny patches. Like a mosaic of colored tiles that together form a meaningful image, your experience of sight and touch must be cobbled together from fragmented bits of information. The same is true for your sense of hearing.
How are these shards of perception integrated to form the more unified experiences we have of touch, sight, and sound? Scientists can’t fully answer this question, but they do know that it doesn’t happen all at once. The mosaic of information we receive from our sensory receptors is assembled in steps. (See Figure 1.) These steps take place as information about a representation moves from one part of your brain, containing one map, to another. It might seem odd to think that your perception of the world is actively constructed by your brain out of thousands of specks, or to imagine that these specks merge and meld gradually, in a series of maps, to generate experience as you know it. But this is the odd reality of perception and the remarkable nature of our senses.
By the close of the nineteenth century, not long before Inouye was examining bullet wounds and testing visual fields, scientists generally agreed that the brain’s representation of vision was housed somewhere near the back of the brain. They also knew that the representation was spatial and that its layout in the brain somehow mirrored the layout of light entering the eye. Yet the details of where and how this strange map was laid out remained unclear.
Based on his study of more than a hundred patients, the Swedish neuropathologist Salomon Henschen had correctly identified the specific place at the back of the brain that housed the visual representation. He even proposed a theory for how the map was laid out in this area, but his description would prove wrong. The damage in his patients’ brains was too widespread to make accurate observation possible. A little more than a decade later, young Inouye would triumph where Henschen had failed, and he would owe much of this success to the brutal efficiency of the Russians’ new guns. The clean, neatly circumscribed bullet holes made by these guns, and the smaller scotomas that they created, made it possible to link bullet holes to blindness and, in doing so, to uncover the hidden map of vision in the soldiers’ brains.

FIGURE 2. Photographs of a soldier in Inouye’s study, showing the cranio-coordinometer in use (left) and the path of the bullet through the soldier’s body (right).
From Die Sehstörungen bei Schussverletzungen der kortikalen Sehsphäre (Visual disturbances following gunshot wounds of the cortical visual area) by Inouye Tatsuji (Leipzig: W. Engelmann, 1909).
Inouye recognized the importance of precision. If he hoped to accurately chart the seat of vision in the brain, he would need painstaking measurements of both the scotoma and the location of the bullet hole in each soldier’s head. Visual field tests were already accurate and commonly used, but Inouye had to conceive his own method for measuring and comparing brain damage from one soldier to the next. He invented an instrument called a cranio-coordinometer, which was essentially a series of rulers attached to one another in three dimensions by means of adjustable screws. (See Figure 2.) The instrument could rest on a person’s head like a cap, which allowed Inouye to accurately measure the dimensions of different heads. He extrapolated each bullet’s three-dimensional course through the brain and compared this with the location and extent of the blindness each patient experienced.
In 1909, Inouye published a monograph presenting his findings from twenty-nine soldiers. His report detailed an actual map of visual space in the human brain. And unlike Henschen, Inouye got nearly all of the details right. The map is split into two halves, one on each side of the brain. Both halves are tucked away at the very back of the brain, in an area that we now call the primary visual cortex, or its nickname: V1. Compared to the visual field it is based on, the representation is upside-down: representations of grass and soil sit above those of sky and clouds in the actual tissues of the brain. The representation is also left-right flipped, so that the right visual field is represented in the left side of the brain, and vice versa. Furthermore, this visual representation is profoundly warped, as if a strong magnifying glass has been placed where the map represents visual information from the center of gaze. But Inouye’s discoveries didn’t end there. He reported tantalizing evidence that V1 is not alone; additional visual maps are buried in the human brain.
In charting the intimate link between the location of damage in the brain and the location of blindness in perception, Inouye revealed the first known visual brain map. Still, the very notion of having a visual map in your brain—not to mention many of them—might strike you as nonsensical. This may be because of your everyday experience with geographic maps. From tourism brochures to mall directories to subway signs, these visual displays are all around us. Like all maps, they are spatial representations of something else. These particular examples are made from stuff—actual physical materials such as pigments on a sheet of paper formed from wood pulp.
Of course, many of the maps we see today are displayed on screens, which illustrates how little a map’s materials matter. When you pull up a map of your travel route on a computer screen, your route is represented in wavelengths of light emitted from the screen. If you print out the map to take it with you on the road, you re-create the same map with ink on paper, but the representation is the same. That is the beauty of representation: it lets us communicate information about entities and phenomena without having to reproduce them. I don’t have to rebuild the pyramids to show you their arrangement at Giza. All I need is a pen and a scrap of paper, a fingertip and a foggy window, or a stick and a sandy beach. In short, it doesn’t matter what a map is made of. A map can be fashioned from virtually any material.
Brain maps are not drawn on paper nor lit on a screen; they are made of cells. The brain contains a variety of cells, half of which are neurons. Neurons are interconnected by beautiful branching limbs that carry electrical and chemical signals from one neuron to the next. A neuron can fire electrical impulses one after another, and the rate at which it issues these impulses depends on the information the neuron is representing.
When I think about these rates, called firing rates, I can’t help but think of a classroom of young children vying for their teacher’s attention: Me me me me, pick me! Ooh ooh ooh, me! The more frequently they call out, the more urgency they lend to their message, be it the answer to the teacher’s question or a request to use the restroom. The calls from different children in the classroom, like the impulses sent by different neurons in the brain, may have entirely different meanings. But in each case, the frequency or rate of the signal reflects the urgency or importance of the message. When a neuron increases its firing rate, issuing a rapid volley of impulses, this means it has important information to convey at that moment.
Imagine that we could open up someone’s skull and unfold the ridges at the back of the brain, so that V1 lies flat. That flat surface of brain stuff would be made up of neurons, just as paper is made up of wood pulp. The sheet of neurons is like the sheet of paper upon which a conventional map is printed. But instead of using inks that vary in hue, brain maps represent information through the firing rates of the neurons they are made up of: which ones are firing rapidly and which ones are barely firing at all. Technically, a neuron’s firing rate is the number of electrical signals it sends in a certain amount of time. In essence, you could say that in brain maps, electricity and time play the role that ink does in a conventional map.
Cells, electricity, and time. Those are the raw materials your brain needs to build a map.
The notion of such a map might take a moment to sink in. It is a dramatic departure from more familiar ones. But the map in your V1 is fundamentally no different from one you might keep in your glove compartment. Just as you can translate a map from your computer screen to a piece of paper by printing it, you can translate that same map from the paper to the neurons in V1 simply by gazing at it. One is as good as the next, and all are real maps.
Brain maps are also different from traditional geographic maps because they are dynamic. Once a geographic map is sketched on papyrus or etched on a placard, it is fixed and unchanging. This isn’t a big setback because landmarks are immobile, and geographic change tends to happen slowly. When such changes do happen, printed maps become outdated. They can’t be automatically updated to reflect a changing world. And so all we can do is discard the old maps and make new ones from scratch.
But some maps can be updated. Just think of the map that may be displayed beside your dashboard in your car, or perhaps on the screen of your cell phone. Computerized maps can be updated to represent a newly opened shopping mall or a highway exit that is closed for repair. These maps also incorporate GPS technology, which pinpoints your current location on the planet. From this, your dynamic computerized map is updated as you move about in the world. As you drive north, the map on your display shifts north as well, so that it is always showing you the landmarks that are directly around you. Such a map would be wholly disorienting without the context of your journey and a familiar, salient frame of reference: you. Although your GPS-linked display is constantly changing, or being updated, as you drive, it is still very much a map. And since it has a consistent frame of reference (your current position on the planet), you have no trouble making sense of this dynamic map.
The map in V1 is also dynamic. As you move your body from place to place, as you move your eyes to glance around a scene, and as the objects around you move, the information represented in this map will be updated. But, like your navigation display, the changing information represented in V1 isn’t disorienting because it too is anchored to a familiar and salient reference: where you are directing your gaze.
Unintuitive as it may be, maps can be made out of brain cells, and they can be updated and change. But there remains a third challenge to the concept of maps in a brain. Even a map drawn on a foggy window or carved into the sand can be seen. But V1 doesn’t turn blue when you stare at the ocean or darken in squares when you look at a checkerboard. Doesn’t a map need to have features you can see?
The answer to that question is no. To see how and why, let’s indulge in a brief thought experiment inspired by the history of spy warfare. Although we tend to think of ciphers and spy communications as a modern invention, invisible inks have been used for hundreds of years to send secret messages. During the American Revolution, George Washington and his spies used an invisible ink made from a special recipe; this ink could be revealed only when the document was treated with a counterstain. Intelligence, plans, and yes, probably maps penned in this invisible ink were transported without detection and changed the course of the war.
Imagine that one of Washington’s spies had used this ink to draw a map of occupied New York City, marked with the gathering places of British troops. Was this invisible map actually a map? Absolutely. And George Washington could have proved it by brushing the paper with the counterstain to make the ink visible. The information contained in the map did not change when the counterstain was applied. The map represented New York City both before and after it became visible to the naked human eye.
The tale of Washington’s invisible ink raises an intriguing question: could one apply a counterstain to the V1 map and make it visible? In 1988, a group of vision scientists did exactly that, revealing the V1 map of macaque monkeys. Like humans and other primates, macaque monkeys rely heavily on their sense of sight and have V1 maps similar to our own.

FIGURE 3. A demonstration of the correspondence between the right half of what a creature is viewing (pattern at left) and how that information is represented with activity in the left half of the V1 visual brain map (photograph of brain slice at right).
From The Journal of Neuroscience, vol. 8, no. 5. Copyright © 1988 by the Society for Neuroscience.
In the experiment, each monkey stared at a flashing pattern on a computer monitor while a compound resembling sugar, but containing a radioactive tag, was injected into its bloodstream. The most active neurons in the monkey’s V1 map took up the radioactive compound—this is because neurons that are firing at a rapid rate need more energy. Each monkey was then anesthetized until its heart stopped beating, at which point the scientists added preservatives to the brain tissue, removed the brain from its skull, and removed the visual cortex from the rest of the brain. They unfolded V1 so that it lay flat on a slide, froze it, and sliced it with a frozen blade. Then they sandwiched X-ray film against the frozen slices for two weeks to three months before they finally developed the film. It revealed remarkable images of the patterns the monkeys were staring at some weeks or months earlier, in the moments before they died. You can see an example in Figure 3: on the left, the pattern the monkey was staring at and, on the right, the pattern of activity in the V1 map made visible in a slice of the animal’s brain.
Just as General Washington added his counterstain to make visible the letters and maps he received, the scientists were able to make the V1 map visible by treating, unfolding, freezing, and filming the brain. In other words, yes, it is possible to open up the brain and see the map in V1, but only with a great deal of effort. New technologies have provided us with easier ways of visualizing brain maps. Ultimately, any method that can translate neurons’ firing rates into visible wavelengths of light will do the trick.
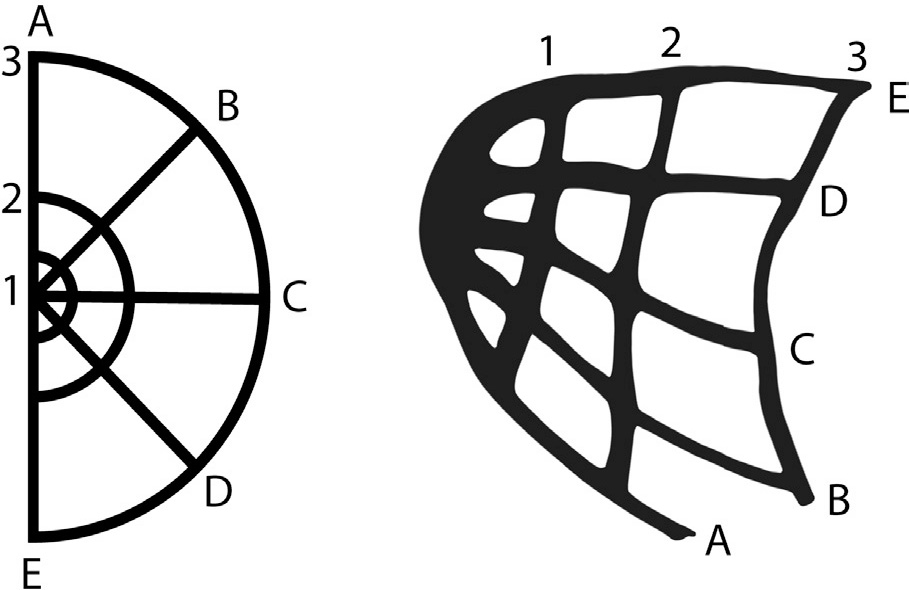
FIGURE 4. Labels on the viewed visual pattern (left) and on the corresponding activity within the monkey’s V1 visual map (right) reveal how the representation in the V1 map is inverted and warped.
Paul Kim, adapted from The Journal of Neuroscience, vol. 8, no. 5. Copyright © 1988 by the Society for Neuroscience.
Even a cursory inspection of the images above reveals an obvious problem: the pattern on the brain slice looks quite different from the pattern on the display. The difference is not an error. The activity in the monkey’s V1 map was not a faithful representation of what the monkey was staring at before he died. The V1 map is profoundly warped. Labels on the panels in Figure 4 reveal how. The vertical straight line on the left side of the original pattern has been stretched into a wide C-shape in the brain, while the perfect semicircle on the right side of the pattern has been flattened and even slightly inverted. The pattern is upside-down, so that the upper portion of the display is represented in the lower part of the V1 map. And there’s more: something is wrong with the brain’s representation of the concentric circles, so that the smallest semicircle takes up far too much space. These anomalies are the very distortions that Inouye discovered more than a century ago.
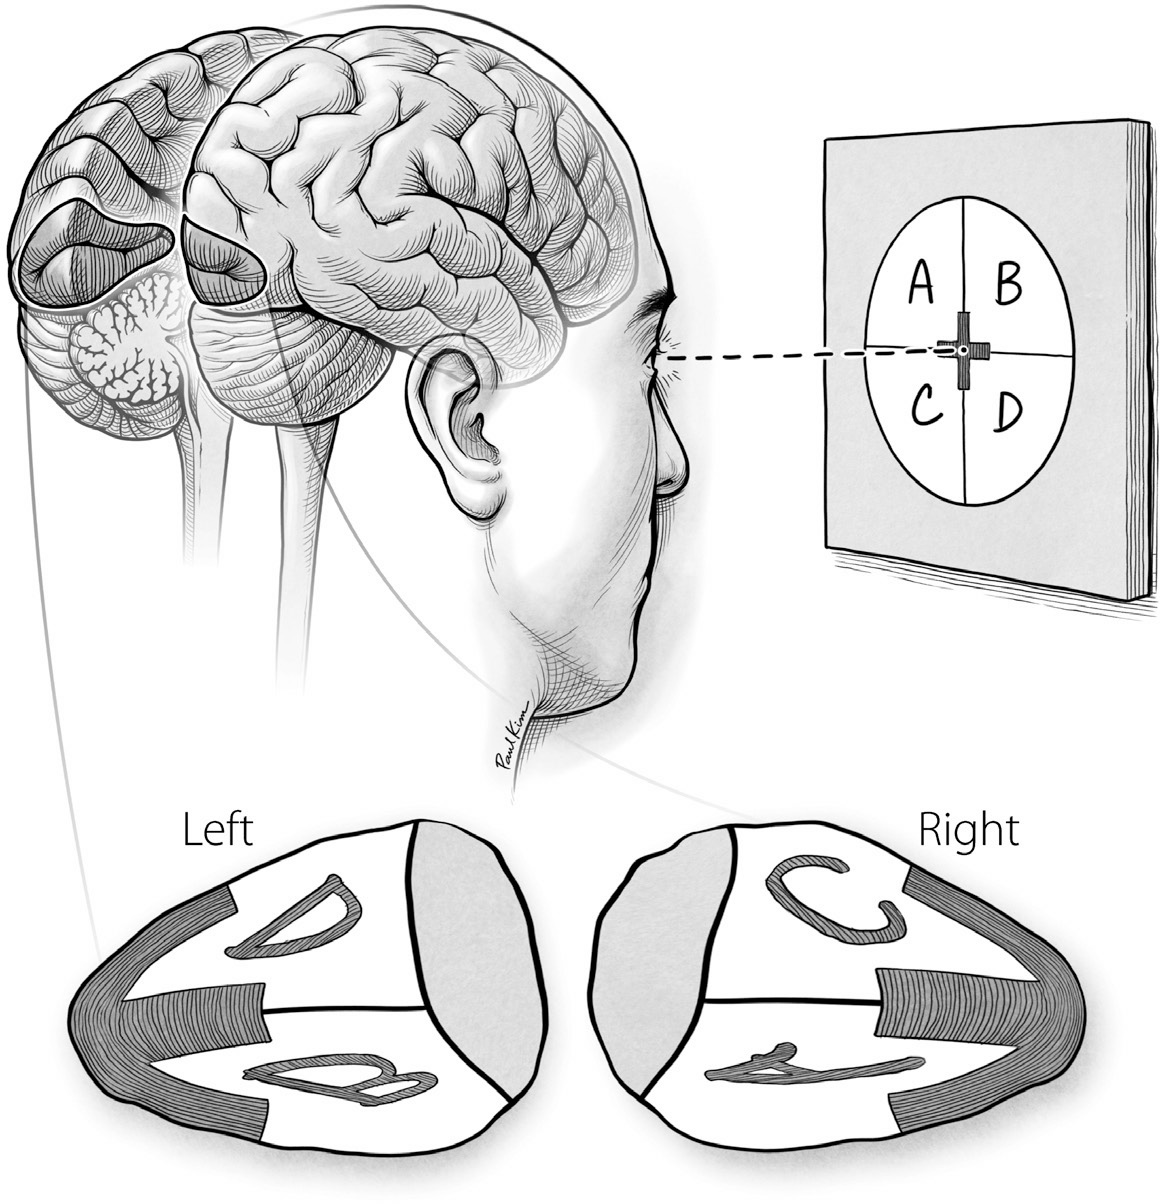
FIGURE 5. How visual information is represented on the left and right sides of the human V1 visual map.
Paul Kim
Thanks to the work of Inouye and a host of scientists before and after him, the once elusive seat of visual perception in the brain is known. The region is tucked away within folds at the back of your brain. It contains a map made of neurons that represent visual information by means of electricity and time. The illustration in Figure 5 shows where V1 hides and how its visual representation is laid out. This is the map that was pierced by bullets in Inouye’s patients, leaving them with holes in their vision even though both of their eyes worked just fine.
The mere existence of such a map in your head may seem strange and improbable. Yet maps like V1 are not the exception but the rule. The brains of creatures great and small are chock full of such maps. The coming chapters will explore their remarkable variety and how their idiosyncrasies and distortions shape what you think and experience. But first there is a fundamental question to answer: why are brains such consummate mapmakers? The answer can be culled from electronics design and evolution, and it touches on topics from hungry brains to the navigational prowess of the humble desert ant. You will come to see that what is truly improbable is your capacity to see your world at all. Visual brain maps like the one in V1 are the solution to a problem that you never knew you had. They uniquely make vision and your other senses possible in a world of bitter hunger, scarcity, and predation.